Lead Poisoning and The Bell Curve
Nevin, Rick
9 February 2012
Lead Poisoning and
The Bell Curve
Rick Nevin
Working Paper
Abstract
A robust environmental health literature demonstrates that preschool lead exposure can cause neurodevelopmental damage and associated adverse impacts on IQ, education, and
behavior. Cognitive psychology research also shows an association between IQ and education and behavior risks, but finds that IQ is largely inherited. The impact of lead exposure was
barely acknowledged in a fierce debate over IQ after the 1994 publication of The Bell Curve, but subsequent research has shown that trends in behavior linked to IQ in The Bell Curve have
tracked lead exposure trends across decades and around the world. Preschool lead exposure trends continue to predict global crime trends and USA trends in education attainment, mental retardation, and teenage pregnancy. Evidence from temporal analyses and other lead toxicity
research suggest a causal relationship between lead exposure and important societal trends. Trends in tooth enamel formed in early childhood also confirm that The Bell Curve reflected
The Bell Curve, by Herrnstein and Murray (1994), reviewed research showing that IQ is largely inherited, and examined background and annual interview data from the 1979-1990
National Longitudinal Survey of Youth (NLSY), a representative sample of Americans born in the late-1950s and early-1960s. NLSY participants, ages 14 to 22 in 1979, were given the Armed Forces Qualification Test in 1980. Those scores were converted to the IQ scale, which
measures individual IQ relative to the scores recorded by a representative “norm” sample of test-takers. Average IQ of 100, by definition, corresponds to the average norm sample score.
A statistical method calculates individual IQ relative to the norm sample score distribution, so 5% of the norm test-takers have IQ below 75, 20% have IQ of 75-90, 50% have IQ of 90-110, 20% have IQ of 110-125, and 5% have IQ above 125. The Bell Curve found that white NLSY
[image:4.612.72.540.402.699.2]participants with IQ below 90 had a greater risk of unwed births, incarceration, and failure to get a high school degree, with even higher risks for youths with IQ below 75 (Figure 1).
Figure 1: Behavior Risks by IQ for White Youths Ages 14-22 in 19791
1
Herrnstein and Murray (1994)
0% 10% 20% 30% 40% 50% 60%
IQ < 75 75 - 90 90 - 110 110 - 125 IQ > 125
IQ Score
1979-1990 Failure to Graduate from High School
1979-1990 Unwed Birth (Females)
1979-1990 Correctional Facility Interview (Males)
Based on a comparison of NLSY data for white and black youths, Herrnstein and Murray argued that racial differences in academic attainment and undesirable behavior prevalence can
be largely explained by racial differences in IQ. The authors did concede that a relationship between inherited IQ and crime could not explain changes in national crime rates over time. Since the 1994 publication of The Bell Curve, juvenile offending, unwed teen pregnancy, and
dropout rates have all plummeted, with the most dramatic declines recorded by black youths. In response to controversy over The Bell Curve, the American Psychological Association
(APA) prepared a report on Intelligence: Knowns and Unknowns. (Neisser et al., 1996) This report states that IQ is positively correlated with education attainment (years of schooling) and achievement test scores (curriculum knowledge). Other research confirms that low IQ is
associated with increased risk of impulsive and criminal behavior. (Moffitt, 1993)
The APA report briefly notes that lead exposure has “well-established negative effects on
intelligence”. Nevin (2000; 2007; 2009) has shown that lead exposure trends explain most of the variation across many decades in USA mental retardation prevalence, unwed pregnancy
rates, Scholastic Achievement Test scores, and violent and property crime rate trends in the USA, Canada, Britain, France, Finland, Italy, West Germany Australia, and New Zealand. An analysis of lead in tooth enamel formed in early childhood also shows that USA urban lead
exposure peaked around the mid-point of the 1979 NLSY birth years. (Robbins et al. 2010)
Lead Exposure and Societal Trends: Evidence of Causation
Lead poisoning can be caused by lead paint chip ingestion, air lead inhalation, and other sources, but the most common exposure pathway for children is lead-contaminated house dust ingested via normal hand-to-mouth activity as they crawl. (Lanphear et al. 1998) Ingested
that establish a basis for expected neurobehavioral damage, and "the unfortunate expectations based on ... lead's toxic effects are fulfilled by the findings from studies of neuropsychological
functioning in lead-exposed children". (Lidsky and Schneider, 2003)
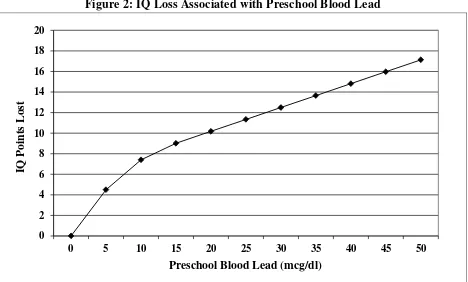
An increase in blood lead from 1 to 10 mcg/dl (micrograms of lead per deciliter of blood) is associated with a loss of 7.4 IQ points. (Canfield et al. 2003) Another one-third IQ point is
lost per mcg/dl increase from 10 to 15 mcg/dl, and one-quarter IQ point lost per mcg/dl over 15 mcg/dl. (Schwartz 1994) Therefore, blood lead over 20 mcg/dl can lower IQ to less than
90 among children who would have had average IQ of 100, and blood lead over 40 mcg/dl can lower IQ to less than 75 for children who would have had IQ of 90 (Figure 2). When large scale blood lead screening began in many USA cities around 1970, 25% of city children tested
had blood lead over 40 mcg/dl. (Gilsinn, 1972) In addition to reducing IQ, preschool lead exposure is directly associated with an increased risk of violent and delinquent behavior.
[image:6.612.73.541.434.716.2](Denno, 1990; Dietrich et al., 2001; Needleman et al., 1996; 2003; Wright et al., 2008)
Figure 2: IQ Loss Associated with Preschool Blood Lead
0 2 4 6 8 10 12 14 16 18 20
0 5 10 15 20 25 30 35 40 45 50
IQ P
oin
ts Lost
The use of lead in paint and gasoline caused global exposure to lead -contaminated dust over the 20th Century. Lead paint use surged in the 1800s, and heavily-leaded circa-1900
paint deteriorated by “chalking”, causing severe lead dust hazards. The leaded share of USA
pigments fell from near 100% in 1900 to 35% by the 1930s, but the USA didn’t ban lead paint
until 1978. From 1935 through the mid-1980s, average USA preschool lead exposure tracked
trends in per capita use of lead in gas, as air lead fallout contaminated dust while lead paint exposure changed slowly with changes in the housing stock. Lead paint in older homes is the
main cause of USA preschool lead exposure today. (Nevin et al., 2008; Nevin, 2010)
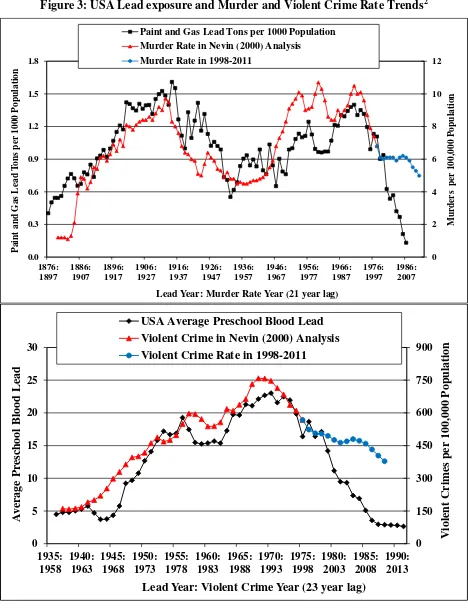
USA murder rates have tracked the rise and fall of per capita use of lead in paint and gasoline, with a 21-year time lag, for over a century (Figure 3). This correlation should not be
dismissed as coincidental because the evidence from temporal analyses, in the context of the broader lead toxicity literature, presents compelling evidence of the indicators of causation
identified by Bradford Hill (1965), now widely-accepted in public health research.
The Biological Plausibility of lead-induced cognitive and neurobehavioral impairment is
established by neurochemical, subcellular, and cellular effects of lead exposure in animal and human studies. (Banks et al., 1997) Neurodevelopmental effects include a reduction in gray matter (neuron cell bodies) in the frontal lobe, the seat of impulse control (Cecil et al. 2008),
and the destruction of myelin sheaths and decreased activity of an enzyme needed for myelin synthesis. Myelin insulates and thickens the white matter connections between neuron cell
bodies, affecting the speed of neuronal signals, allowing the brain to work more in concert. Brain scan studies (Sowell et al. 1999; Bartzokis et al. 2001) suggest that impulsive behavior in all youths could be affected by a gray matter growth surge in the early-teens, followed by
Figure 3: USA Lead exposure and Murder and Violent Crime Rate Trends2
2
Nevin (2000); U.S. Centers for Disease Control and Prevention, 2011a; U.S. Department of Justice, 2011a; 2011b (2011 crime rate trend based on six-month data)
0 2 4 6 8 10 12 0.0 0.3 0.6 0.9 1.2 1.5 1.8 1876: 1897 1886: 1907 1896: 1917 1906: 1927 1916: 1937 1926: 1947 1936: 1957 1946: 1967 1956: 1977 1966: 1987 1976: 1997 1986: 2007 M u rd er s p er 100,000 P op u lation P ain t an d G as L ead T on s p er 1000 P op u lation
Lead Year: Murder Rate Year (21 year lag) Paint and Gas Lead Tons per 1000 Population Murder Rate in Nevin (2000) Analysis
Murder Rate in 1998-2011
0 150 300 450 600 750 900 0 5 10 15 20 25 30 1935: 1958 1940: 1963 1945: 1968 1950: 1973 1955: 1978 1960: 1983 1965: 1988 1970: 1993 1975: 1998 1980: 2003 1985: 2008 1990: 2013 V iol en t C rim es p er 100,000 P op u lation A ve rage P re sc h ool B lood L ead
Lead Year: Violent Crime Year (23 year lag) USA Average Preschool Blood Lead
Brain growth parallels age-related property crime offending that surges in the early-teens, peaks in late-adolescence, and falls sharply by age 30, and violent offending that peaks in the
early-20s and declines through age 50. These age-related offending patterns are not explained by IQ because individual IQ is relatively stable after adolescence. If white matter growth reduces impulsive behavior, then lead-induced myelin impairment could cause more common
and severe behavior problems, especially among youths, and the association between low IQ and criminal behavior could be caused by separate neurodevelopmental effects of lead.
The Strength of the relationship between lead exposure trends and trends in Scholastic Achievement Test (SAT) scores, mental retardation (MR), and unwed pregnancy and crime is evident in the statistical significance of lead exposure in regression analyses and in the very
high percent of variation in education and behavior trends explained by lead exposure. USA blood lead trends explain 65% of the 1953-2003 variation in average SAT math scores, 45%
of variation in SAT verbal scores, and 65% of 1948-2001 variation in MR prevalence. USA blood lead trends also explain 58% of the 1972-1996 variation in the pregnancy rate for girls
under age 15, and the combined impact of abortion legalization and blood lead trends explain s 96% of 1955-1996 variation in unwed pregnancy rates for ages 15 to 17, and 94% of the 1955-1996 variation for ages 18 and 19. International blood lead trends explain: 63% to 93%
of variation in index crime rates (violent plus property crime) over several decades in every one of nine nations examined; 91% to 93% of variation in aggravated assault rates in the USA
and Britain; 84% to 90% of variation in rape rates in the USA and Britain; 70% to 89% of variation in robbery rates in the USA, Britain, Canada, West Germany, New Zealand, and Australia; and 65% to 91% of variation in burglary rates in the USA, Britain, Canada,
The Consistency of the relationship between lead exposure and crime trends within each nation explains otherwise bewildering divergences in crime rates across nations over time. In
1980, the USA index crime rate was 22% higher than the rate in France and 40% higher than
Australia’s rate, but the 2001 USA index crime rate was 39% below the French rate and 45%
below Australia’s rate. Canada’s index crime rate was 60% higher than the rate in Britain in
the early-1970s, but 20% lower in 2001. In 1974, the USA burglary rate was 50% higher than the rate in Britain and twice the rate in Australia, but the 2002 USA burglary rate was less
than half the rates in Britain and Australia. The Canadian robbery rate was five times the rate in Britain in 1962, but the 2002 Canadian robbery rate was less than half the rate in Britain. The 1960 USA aggravated assault rate was almost three times the rate in Britain, but the 2002
USA rate was half the rate in Britain. Crime in the USA and Canada rose and fell earlier than in other nations because gasoline lead exposure rose and fell earlier in the USA and Canada.
Temporal Precedence requires, at a minimum, that a suspected cause precede the effect.
The statistical best-fit time lags that relate lead exposure and societal trends present especially
compelling evidence, linking every outcome to neurodevelopment in the first year of life: A 12-year time lag for ages 6-18 mental retardation; A 17-year lag for SAT scores; A 15-year lag for under-age-15 pregnancy; A 17-year lag for age 15-17 unwed pregnancy; An 18-year
lag for burglary; A 23-year lag for violent crime; A 19-year lag for overall index crimes that are about 90% property crimes and 10% violent crimes. Temporal Precedence is also evident
Figure 4: USA Preschool Blood Lead and Mental Retardation (MR) Trends3
3
Nevin (2009); U.S. Department of Education, 2011; 2008-2011: MR prevalence increased slightly from 1992 to 2000, as public schools switched from the 1974 WISC-R IQ test to the 1991 WISC-III. The WISC III was based on a norm sample of children born as lead exposure declined in the 1970s and 1980s. Students with mild MR (IQ above 55) who took both tests recorded IQ that averaged 5.6 points lower on the WISC-III than on the WISC-R. (Kanaya et al., 2003) As a result, more students have WISC-III IQ scores associated with MR, when many of those students would have WISC-R scores above the threshold associated with MR. The impact on MR prevalence due to
0.0% 0.5% 1.0% 1.5% 2.0% 2.5% 0 5 10 15 20 25 1936: 1948 1941: 1953 1946: 1958 1951: 1963 1956: 1968 1961: 1973 1966: 1978 1971: 1983 1976: 1988 1981: 1993 1986: 1998 1991: 2003 1996: 2008 2001: 2013 P u b li c S ch ool MR P re valence A ve rage B lood L ead ( m cg/d l)
Lead Year:Special Education Year (12 year lag) USA Average Preschool Blood Lead
USA Public School MR Prevalence in Nevin (2009) Analysis USA Public School MR Prevalence in 2005-2010
0.0% 0.2% 0.4% 0.6% 0.8% 1.0% 1.2% 1.4%
1991 1992 1993 1994 1995 1996 1997 1998 1999 2000 2001 2002 2003 2004 2005 2006 2007 2008 2009 2010
Age -S p ec if ic M R P re valence
With respect to Experimental Evidence, Bradford Hill states that “the strongest support
for the causation hypothesis may be revealed” when preventive action is taken and it does in
fact prevent. Regulatory actions to phase out leaded gasoline and reduce lead paint hazards anticipated societal benefits from education attainment gains associated with higher IQ. That promise has been fulfilled by large gains in high school completion and college enrollment
rates associated with birth years of declining preschool lead exposure, after decades devoid of national academic attainment progress across birth years of gasoline lead exposure. National
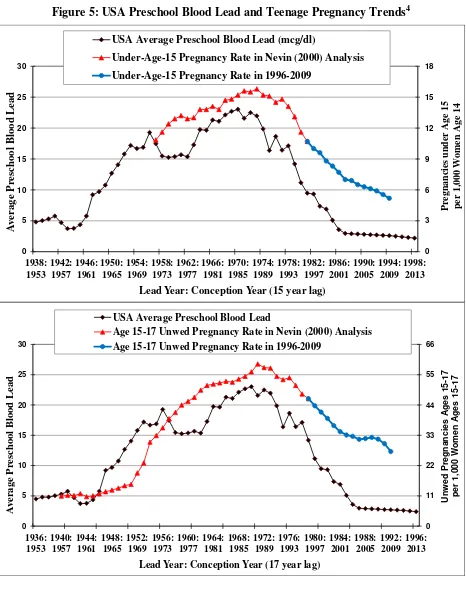
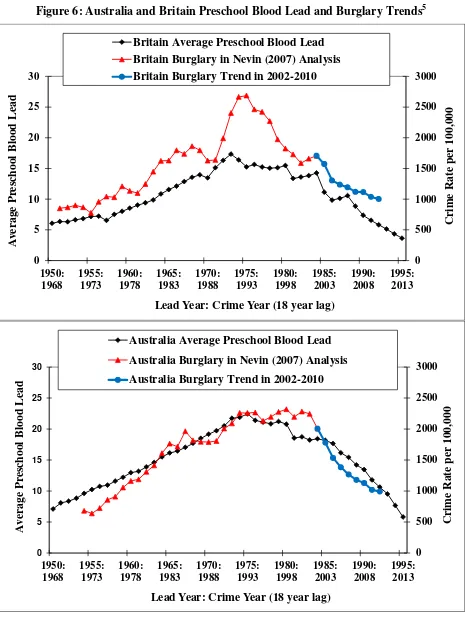
blood lead trends also continue to forecast trends in USA teenage pregnancy and international crime rates with remarkable accuracy (Figures 5 and 6).
A Dose-Response relationship between preschool blood lead and IQ later in life is clearly
established. Temporal analyses show a corresponding population-dose-response relationship between preschool blood lead trends and population MR prevalence, crime, and unwed teen
pregnancy rates. Average USA preschool blood lead rose by almost 500% from the 1930s through the 1960s. MR prevalence then rose by 500% with a 12-year lag; age-15-17 unwed
teen pregnancy rates rose by 500% with a 17-year lag; the Index crime rate rose by 500% with a 19-year lag; and the violent crime rate rose by 500% with a 23-year lag.
The Specificity indicator of causation might seem to be lacking in light of the diverse
societal impacts of preschool lead exposure, but rising MR prevalence, falling SAT scores, stagnant or falling education attainment, and rising crime and unwed teen pregnancy rates are
Figure 5: USA Preschool Blood Lead and Teenage Pregnancy Trends4
4
Alan Guttmacher Institute, 2010; U.S. Centers for Disease Control and Prevention, 2011b; 2011c: Teen pregnancy rates shown reflect age-specific abortion rate for each year plus the corresponding birth rate for the following year, to approximate the pregnancy rate associated with year of conception. Trend shown for 2009 is based on 2010 USA
0 3 6 9 12 15 18 0 5 10 15 20 25 30 1938: 1953 1942: 1957 1946: 1961 1950: 1965 1954: 1969 1958: 1973 1962: 1977 1966: 1981 1970: 1985 1974: 1989 1978: 1993 1982: 1997 1986: 2001 1990: 2005 1994: 2009 1998: 2013 P re gnan ci es un der Age 15 per 1,00 0 Wo men A ge 14 A ve rage P re sc h ool B lood L ead
Lead Year: Conception Year (15 year lag) USA Average Preschool Blood Lead (mcg/dl)
Under-Age-15 Pregnancy Rate in Nevin (2000) Analysis Under-Age-15 Pregnancy Rate in 1996-2009
0 11 22 33 44 55 66 0 5 10 15 20 25 30 1936: 1953 1940: 1957 1944: 1961 1948: 1965 1952: 1969 1956: 1973 1960: 1977 1964: 1981 1968: 1985 1972: 1989 1976: 1993 1980: 1997 1984: 2001 1988: 2005 1992: 2009 1996: 2013 Un w ed P regn ancies A g es 15 -17 p er 1,0 00 W o men A g es 15 -17 A ve r age P re sc h ool B lood L e ad
Lead Year: Conception Year (17 year lag) USA Average Preschool Blood Lead
Figure 6: Australia and Britain Preschool Blood Lead and Burglary Trends5
5
Australian Bureau of Statistics, 2010; 2011; U.K. Home Office, 2011
0 500 1000 1500 2000 2500 3000 0 5 10 15 20 25 30 1950: 1968 1955: 1973 1960: 1978 1965: 1983 1970: 1988 1975: 1993 1980: 1998 1985: 2003 1990: 2008 1995: 2013 Cr im e Rat e p er 100,000 A ve rage P re sc h ool B lood L ead
Lead Year: Crime Year (18 year lag) Britain Average Preschool Blood Lead Britain Burglary in Nevin (2007) Analysis Britain Burglary Trend in 2002-2010
0 500 1000 1500 2000 2500 3000 0 5 10 15 20 25 30 1950: 1968 1955: 1973 1960: 1978 1965: 1983 1970: 1988 1975: 1993 1980: 1998 1985: 2003 1990: 2008 1995: 2013 Cr im e Rat e p er 100,000 A ve rage P re sc h ool B lood L ead
Lead Year: Crime Year (18 year lag) Australia Average Preschool Blood Lead
Australia Burglary in Nevin (2007) Analysis
With respect to Coherence, Bradford Hill states that a causal interpretation “should not seriously conflict with the generally known facts of the natural history and biology of the
disease”. This principle is inadequately addressed by The Bell Curve interpretation of NLSY
data, concluding that inherited IQ is an important causal factor in criminal offending, when that interpretation is not coherent with national crime trends. Ironically, evidence that lead
exposure affects so many interrelated societal trends can incite disbelief that any one factor could cause so many effects, but that coherence is evidence of causation.
The Bell Curve behind The Bell Curve
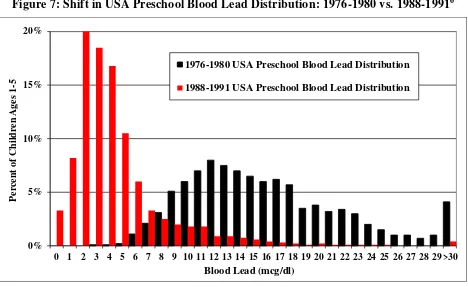
The Second National Health and Nutrition Examination Survey (NHANES II), from 1976 to 1980, provided the first representative data on the USA preschool blood lead distribution.
[image:15.612.73.541.406.693.2]NHANES III data, from 1988-1991, showed that the phase out of leaded gasoline shifted the preschool blood lead distribution to lower levels, concentrated in a narrower range (Figure 7).
Figure 7: Shift in USA Preschool Blood Lead Distribution: 1976-1980 vs. 1988-19916
0% 5% 10% 15% 20%
0 1 2 3 4 5 6 7 8 9 10 11 12 13 14 15 16 17 18 19 20 21 22 23 24 25 26 27 28 29 >30
P
er
ce
n
t
of
Chi
ld
re
n
Age
s
1
-5
Blood Lead (mcg/dl)
1976-1980 USA Preschool Blood Lead Distribution
NHANES II revealed another bell curve that was the mirror image of the IQ bell curve with respect to income and race: Poor children and black children are more likely to be at the
high end of the blood lead bell curve and at the low end of the IQ bell curve. Poor children have higher blood lead because they are more likely to live in older housing with deteriorated lead paint and with lead paint on windows that create lead-contaminated dust (Jacobs et al.,
2002; Nevin and Jacobs, 2006). Black children regardless of income are more likely to live in older housing, and had more gas lead exposure because they were concentrated in cities where
traffic increased air lead and caused more severe lead dust hazards. From 1950-1970, many children suffered additive exposure to city air lead and lead paint in deteriorated slum housing that was built around 1900, when the use of heavily leaded interior paint was common. When
MR prevalence peaked in the 1970s, the mildly retarded (IQ over 55) accounted for 75% to 80% of MR students, with most cases due to unknown cause, and high prevalence among
“low income groups - who often live in slums” (National Research Council, 1982).
Nevin (2007) derived preschool blood lead trends across several decades in nine nations
by combining available blood lead data with trends in per capita gasoline lead expo sure, citing evidence that national trends in blood lead and leaded gas use were very highly correlated. Those national blood lead trends reflect a temporal shift in the entire blood lead distribution,
encompassing a rise and fall in marginally higher blood lead associated with marginally lower IQ, academic achievement and attainment, and juvenile property crime offending, and a rise
and fall in severe lead poisoning more associated with MR and violent offending.
The dose-response relationship between preschool blood lead and IQ means that the wider NHANES II blood lead distribution would have profoundly affected any IQ norm sample
distribution would have caused much less variation in lead-induced cognitive losses for an IQ norm based on test-takers born in the mid-1980s, but the statistical method used to calculate IQ from a norm sample obscures this impact of the preschool blood lead bell curve. By
definition, 5% of every IQ norm sample has IQ below 75, 20% of those test-takers have IQ of 75-90, 50% have IQ of 90-110, 20% have IQ of 110-125, and 5% have IQ above 125.
The APA report cited studies showing IQ is largely inherited, but also noted that some sort of “environmental” influence was evident in a racial convergence in National Assessment of
Educational Progress (NAEP) scores. The racial difference in average NAEP scores narrowed at different times for ages 9, 13, and 17, but black gains at each age are traced to changes over the same 1962-1973 birth years. Nevin (2007; 2009) has linked those same birth years to
narrowing racial differences in SAT scores, MR prevalence, and juvenile burglary arrest rates, and linked all of these trends to a racial convergence in lead exposure over the 1960s.
African-Americans occupied 56% of substandard city housing in 1960, as white children were increasingly concentrated in suburbs with far less gasoline lead exposure, in new homes with
little or no lead paint. As urban sprawl spread more lead emissions to suburbs over the 1960s, African-Americans were disproportionately displaced by city slum clearance programs. Those trends suggest that lead exposure among black children, and the average racial
difference in preschool lead exposure, likely peaked around 1960.
A study of lead concentrations preserved in tooth enamel formed from 1936 to 1993 in
Cleveland has now confirmed that average preschool lead exposure peaked around 1960 in this largely black urban population. This peak in urban tooth lead, a decade before the peak in USA gas lead emissions, is consistent with a peak in lead poisoning prevalence before slum
1960s. Across the entire span of birth years from 1936 to 1993, this study also confirms a very high correlation between tooth lead and gasoline lead trends, and confirms the same
order-of-magnitude temporal variation in lead exposure derived from USA gasoline lead trends: The circa-1960 peak in average tooth lead was about 500% higher than average tooth lead in 1936–1950 and in 1986–1993.
The Bell Curve controlled for race by first examining the relationship between IQ and behavior among white youths, but did not control for the wide variation in the white preschool
blood lead distribution during NLSY birth years of the late-1950s and early-1960s. In 1960, 51% of blacks and 30% of whites lived in central cities, and the fact that blacks occupied 56% of substandard city housing means that whites still occupied almost half of 1960 substandard
city housing. Most white children born in those years lived in new suburban homes, but many other white children still suffered additive exposure to lead paint hazards and urban air lead .
The extremely wide variation in the white preschool blood lead distribution during birth years of the 1979 NLSY was the root cause of the wide variation in incarceration, unwed birth, and
high school dropout rates attributed to inherited IQ.
Inherited IQ and an Unobserved Confounder
The APA report notes that an “environmental” influence on IQ is also evident in Flynn’s
research showing global 20th Century IQ gains. IQ of 100 is “redefined” as the average score on every new IQ test, based on the norm sample for that test, but new norm samples also take
an older test so “norm comparisons” can verify that individual IQ is similar on both tests (to validate new tests). Individual IQ is similar on old and new tests, but Flynn discovered that almost every new norm sample has average IQ above 100 on older IQ tests, indicating gains
points per decade on spatial visualization and figure similarity tests, and smaller gains on number series and verbal tests more affected by education.
Nevin (2000) has shown that Flynn reports IQ gains in many nations that are relatively rapid across birth years of declining lead paint exposure in the first half of the 20th Century, followed by IQ gains that slowed or stopped across birth years when rising gasoline lead use
offset ongoing declines in lead paint exposure. That pattern does not appear in USA data because many USA IQ norms span a wide range of birth years (e.g., adults age 16-48), and
because Flynn’s USA data are for white IQ only (to incorporate early IQ norms that included
only whites). Blacks were increasingly concentrated in cities as air lead increased, as white children were increasingly born in suburbs with far less gas or paint lead exposure, muting the
impact of gasoline lead on long-term trends in average white IQ.
While acknowledging some evidence of environmental influence on IQ, the APA report
cited extensive evidence that IQ is inherited, based on studies showing the IQ correlation for adopted siblings raised in the same family is lower than the correlation for genetic siblings
separated by adoption. Genetic siblings raised apart did not share the same socioeconomic environment through childhood, but even identical twins separated at birth shared the same maternal blood lead exposure, and many genetic siblings separated by adoption after the age
of nine months shared the same exposure to lead contaminated dust as they learned to crawl. Despite the extensive cognitive research showing that IQ is inherited, the APA report also
notes that a genetic explanation for racial differences in IQ implies that African-Americans with lighter skin and more Caucasian heritage should have higher IQ than those with darker skin, but this is not the case. The known history of preschool lead exposure suggests that IQ
discrimination restricted African-Americans of any shading to cities with severe air lead exposure and neighborhoods with older housing with lead paint.
The pioneers of research showing that lead exposure impairs IQ often faced skeptical questions about whether this was a coincidental correlation resulting from inadequate study controls for confounding by parental IQ, education, income, and other confounders associated
with inherited IQ. The extensive research on this subject has now definitively shown the adverse impact of preschool lead exposure on IQ after controlling for confounders. In light of
that evidence, and the history of global lead paint exposure predating the earliest IQ tests, and the strong, consistent, coherent, ongoing, dose-response relationship between lead exposure trends and subsequent trends in important IQ-correlates, it is now reasonable to ask: Could the
References
Alan Guttmacher Institute, 2010, U.S. Teenage Pregnancies, Births and Abortions: National and
State Trends and Trends by Race and Ethnicity.
Australian Bureau of Statistics, 2010, Recorded Crime - Victims, Australia, 2009 Australian Bureau of Statistics, 2011, Recorded Crime - Victims, Australia, 2010
Banks, E, Ferretti L, Shucard D. 1997 Effects of low level lead exposure on cognitive
function in children: A review of behavioral, neuropsychological and biological evidence,
Neurotoxicology, 18, 237-81
Bartzokis et al. (2001) Age-related changes in frontal and temporal lobe volumes in men: a magnetic resonance imaging study, Archives of General Psychiatry, 58, 461-465)
Canfield, R., Henderson, C., Cory-Slechta, D., Cox, C., Jusko, T., Lanphear, B. 2003 Intellectual impairment in children with blood lead levels below 10 g/dL, The New England Journal of
Medicine, 348, 1517-1522
Cecil K, Brubaker C, Adler C, Dietrich K, Altaye M, Egelhoff J, et al. 2008 Decreased Brain Volume in Adults with Childhood Lead Exposure PLoS Med 5(5): 0741-50
Denno, D. W. 1990. Biology and Violence, Cambridge University Press, NY, NY
Dietrich, K., Ris, M., Succop, P., Berger, O., Bornschein R. 2001. Early Exposure to Lead and Juvenile Delinquency, Neurotoxicology and Teratology, 23, 511-518
Gilsinn 1972 Estimates of the Nature and Extent of Lead Paint Poisoning in the United States, U.S. Department of Commerce
Hill, AB. (1965) The environment and disease: association or causation? Proc R Soc Med
58:295–300.
Jacobs D, Clickner R, Zhou J, Viet S, Marker D, Rogers J, et al. 2002 The prevalence of lead-based paint hazards in U.S. housing, Environ Health Perspect, 110, 599-606
Kanaya T., Scullin, M., & Ceci, S., 2003, The Flynn Effect and U.S. Policies: The Impact of
Rising IQ Scores on American Society Via Mental Retardation Diagnoses, American Psychologist, 58: 778-90.
Lanphear, B, Matte, T., Rogers, J., Clickner, R., Dietz, B., Bornschein, R., et al., 1998. The contribution of lead-contaminated house dust and residential soil to children’s blood lead levels: a pooled analysis of 12 epidemiological studies. Environ. Res. 79, 51–68.
Lidsky T, Schneider J. 2003 Lead neurotoxicity in children, Brain, 126, 5-19 Moffitt T. 1993. Adolescence-limited and life-course-persistent antisocial behavior: a
developmental taxonomy. Psychol Rev 100:674–701
National Research Council 1982 Placing Children in Special Education, National Academy
Press, Wash. DC
Needleman, H., Riess, J., Tobin, M., Biesecker G., Greenhouse J. 1996 Bone lead levels and delinquent behavior, Journal of the American Medical Association, 257, 363-369.
Needleman, H., McFarland, C., Ness, R., Fienberg, S., Tobin, M. 2003 Bone lead levels in adjudicated delinquents. A case control study. Neurotoxicology and Teratology, 24, 711-717.
Neisser, U, Boodoo G, Bouchard T, Boykin A, Brody N, Ceci S, et al. 1996 Intelligence: knowns and unknowns, American Psychologist, 51, 77-101
Nevin R. 2000 How lead exposure relates to temporal changes in IQ, violent crime, and unwed
Nevin, R., Jacobs D. 2006. Windows of opportunity: lead poisoning prevention, housing affordability, and energy conservation. Housing Policy Debate 17(1), 185–207
Nevin R. 2007 Understanding international crime trends: the legacy of preschool lead exposure,
Environ Res, 104, 315–336
Nevin, R., Jacobs D., Berg M., Cohen J. 2008 Monetary benefits of preventing childhood lead
poisoning with lead-safe window replacement. Environ Res 106, 410–419. Nevin R. 2009 Trends in preschool lead exposure, mental retardation, and scholastic
achievement: Association or causation? Environ Res, 109, 301-310
Nevin R. 2010 Energy-efficient housing stimulus that pays for itself, Energy Policy, 38: 4-11 Pirkle, J., Brody, D., Gunter, E., Kramer R., Paschal D., Flegal K., Matte T. 1994 The decline in
blood lead levels in the United States. Journal of the American Medical Association, 272, 284-91
Robbins N, Zhang Z, Sun J, Ketterer M, Lalumandier J, Shulze R (2010) Childhood lead exposure and uptake in teeth in the Cleveland area during the era of leaded gasoline Science
of The Total Environment 408 (19): 4118-4127
Schwartz, J. 1994. Low-level lead exposure and children's IQ: A meta-analysis and search for a threshold, Environ Res., 65, 42-55
Sowell et al. (1999) In vivo evidence for post-adolescent brain maturation in frontal and striatal regions, Nature Neuroscience, 2, 859-61
Wright J, Dietrich K, Ris M, Hornung R, Wessel S, Lanphear, B, et al. 2008 Prenatal and Childhood Blood Lead Concentrations with Criminal Arrests in Early Adulthood, PLoS Mede 5(5): 0732-0740
U.S. Centers for Disease Control and Prevention 2011a Deaths: Final Data for 2008, National Vital Statistics Report, Volume 59, Number 10
U.S. Centers for Disease Control and Prevention 2011b Births: Final Data for 2009, National Vital Statistics Report, Volume 60, No. 1
U.S. Centers for Disease Control and Prevention, 2011c Abortion Surveillance - United States,
2008, Morbidity and Mortality Weekly Report, Vol. 60, No. 15
U.S. Department of Education, 2011, Digest of Education Statistics: 2010
U.S. Department of Education, 2008-2011, Office of Special Education Programs Annual Reports to Congress
U.S. Department of Justice, 2011a, Crime in the United States, 2010