www.hydrol-earth-syst-sci.net/19/1501/2015/ doi:10.5194/hess-19-1501-2015
© Author(s) 2015. CC Attribution 3.0 License.
Scoping a field experiment: error diagnostics of TRMM
precipitation radar estimates in complex terrain as a basis for
IPHEx2014
Y. Duan, A. M. Wilson, and A. P. Barros
Department of Civil and Environmental Engineering, Pratt School of Engineering, Duke University, Durham, NC 27708, USA
Correspondence to: A. P. Barros ([email protected])
Received: 9 August 2014 – Published in Hydrol. Earth Syst. Sci. Discuss.: 10 October 2014 Revised: 15 February 2015 – Accepted: 4 March 2015 – Published: 25 March 2015
Abstract. A diagnostic analysis of the space–time struc-ture of error in quantitative precipitation estimates (QPEs) from the precipitation radar (PR) on the Tropical Rainfall Measurement Mission (TRMM) satellite is presented here in preparation for the Integrated Precipitation and Hydrol-ogy Experiment (IPHEx) in 2014. IPHEx is the first NASA ground-validation field campaign after the launch of the Global Precipitation Measurement (GPM) satellite. In antic-ipation of GPM, a science-grade high-density raingauge net-work was deployed at mid to high elevations in the southern Appalachian Mountains, USA, since 2007. This network al-lows for direct comparison between ground-based measure-ments from raingauges and satellite-based QPE (specifically, PR 2A25 Version 7 using 5 years of data 2008–2013). Case studies were conducted to characterize the vertical profiles of reflectivity and rain rate retrievals associated with large dis-crepancies with respect to ground measurements. The spatial and temporal distribution of detection errors (false alarm, FA; missed detection, MD) and magnitude errors (underestima-tion, UND; overestima(underestima-tion, OVR) for stratiform and convec-tive precipitation are examined in detail toward elucidating the physical basis of retrieval error.
The diagnostic error analysis reveals that detection errors are linked to persistent stratiform light rainfall in the south-ern Appalachians, which explains the high occurrence of FAs throughout the year, as well as the diurnal MD maximum at midday in the cold season (fall and winter) and especially in the inner region. Although UND dominates the error bud-get, underestimation of heavy rainfall conditions accounts for less than 20 % of the total, consistent with regional hy-drometeorology. The 2A25 V7 product underestimates low-level orographic enhancement of rainfall associated with fog,
cap clouds and cloud to cloud feeder–seeder interactions over ridges, and overestimates light rainfall in the valleys by large amounts, though this behavior is strongly conditioned by the coarse spatial resolution (5 km) of the topography mask used to remove ground-clutter effects. Precipitation associ-ated with small-scale systems (< 25 km2) and isolated deep convection tends to be underestimated, which we attribute to non-uniform beam-filling effects due to spatial averaging of reflectivity at the PR resolution. Mixed precipitation events (i.e., cold fronts and snow showers) fall into OVR or FA cat-egories, but these are also the types of events for which ob-servations from standard ground-based raingauge networks are more likely subject to measurement uncertainty, that is raingauge underestimation errors due to undercatch and pre-cipitation phase.
Overall, the space–time structure of the errors shows strong links among precipitation, envelope orography, land-form (ridge–valley contrasts), and a local hydrometeorolog-ical regime that is strongly modulated by the diurnal cycle, pointing to three major error causes that are inter-related: (1) representation of concurrent vertically and horizontally vary-ing microphysics; (2) non-uniform beam fillvary-ing (NUBF) ef-fects and ambiguity in the detection of bright band position; and (3) spatial resolution and ground-clutter correction.
1 Introduction
of water and ecosystem resources (Barros, 2013; Viviroli et al., 2011). Recent advances toward high spatial and tem-poral resolution satellite-based quantitative precipitation es-timation (QPE) make these estimates potentially attractive for flood forecasting and other operational hydrology studies (e.g., Tao and Barros, 2013, 2014, and references therein). Numerous studies have been conducted to compare satellite products against ground measurements to quantify errors and to improve retrieval algorithms (Amitai et al., 2009, 2012; Barros et al., 2000; Kirstetter et al., 2013; Tao and Barros, 2010; Wolff and Fisher, 2008). For long-term monitoring, raingauges remain the most autonomous and affordable in-struments, but large errors can be introduced in extrapolat-ing point observations to represent areal means (Prasetia et al., 2012). Considering the large uncertainties due to satel-lite temporal sampling and volume sampling discrepancies, and the challenges in accounting for atmospheric heterogene-ity and landform complexheterogene-ity, direct comparison of satellite-based precipitation estimates with ground-satellite-based point mea-surements (e.g., raingauges) poses many challenges, espe-cially at short timescales over small areas (< 1000 km; Ami-tai et al., 2012; Barros and Tao, 2008; Fisher, 2004; among many others).
In mountainous regions, terrain complexity is a key com-plicating factor not only because it introduces spatial vari-ability, but also because land in this region is difficult to ac-cess. This tends to constrain the type, density and locations of ground-based observations, leading to sparse, poorly main-tained, and irregularly distributed observing networks. Fur-thermore, observations from operational ground-based radar systems cannot be relied upon to monitor the lower tro-posphere due to blockage and ground-clutter effects and, thus, satellite-based observations provide an opportunity for long-term monitoring at high spatial resolution with consis-tent measurement quality. Studies evaluating satellite QPE consistently report widespread underestimation of rainfall in mountainous regions independently of the temporal scale (Barros et al., 2000; Barros and Tao, 2008; Lang and Barros, 2002; Prat and Barros, 2010a). In the southern Appalachi-ans and the adjacent piedmont, light rainfall (≤3 mm h−1) accounts for 30–50 % or more of the annual freshwater in-put to headwater catchments (Barros, 2013; Wilson and Bar-ros, 2014) and, therefore, light rainfall detection and esti-mation, which has been a long-standing challenge in remote sensing of rainfall, is critical to water cycle studies. On the other hand, vertical complexity and high spatial variability of heavy rainfall and mixed precipitation events associated with severe weather pose major challenges to operational weather and hydrological forecasting of extreme events.
A diagnostic analysis of the space–time structure of er-ror in QPE from the precipitation radar (PR) on the Tropical Rainfall Measurement Mission (TRMM) satellite in prepa-ration for the Integrated Precipitation and Hydrology Ex-periment (IPHEx) in 2014 is reported here. In particular, we examine the physical basis of false alarm (FA), missed
detection (MD), underestimation (UND) and overestimation (OVR) errors with the purpose of designing and implement-ing a ground-validation observimplement-ing system that captures the range of key conditions and hydrometeorological regimes linked to various types of retrieval errors and, thus, can in-form improvements in retrieval algorithms and precipitation product development in regions of complex orography.
IPHEx is the first ground-validation field campaign after the launch of the Global Precipitation Measurement (GPM) satellite (Barros et al., 2014). The configuration of the terrain and TRMM overpasses and the complex regional meteorol-ogy necessitate a comprehensive assessment of the spatial and temporal structure of uncertainty conditional on observ-ing geometry and hydrometeorological regime. In anticipa-tion of IPHEx, a science-grade high-density raingauge net-work was deployed at mid to high elevations in the southern Appalachian Mountains, USA, since 2007. This network al-lows for direct comparison of ground-based measurements from raingauges and satellite-based QPE from the TRMM precipitation radar (specifically, PR 2A25 V7), and the GPM Dual-Frequency Precipitation Radar (DPR) when these be-come available. Specifically, raingauge measurements were compared against 5 years of TRMM orbital precipitation es-timates (PR 2A25) collected between 2008 and 2013. The satellite-based estimates were evaluated via gauge-to-pixel analysis for spatiotemporally matched gauges and areal av-erage analysis at the PR pixel scale. Case studies were con-ducted to characterize the vertical profiles of reflectivity and rain rate associated with large uncertainty, as well as the spa-tial distribution for typical cases of quantitative errors (UND and OVR) and detection errors (FA and MD) for stratiform and convective precipitation.
Kirstetter et al. (2013) performed a comprehensive study and reported improvements of TRMM PR 2A25 V7 over ver-sion 6 (V6) across the southern conterminous US (CONUS) using the National Weather Service (NWS) operational radars and raingauges as reference. Several changes were implemented in the TRMM PR algorithm of V7 including the vertical profile of hydrometeor characteristics, which af-fects the reflectivity-to-rainfall rate (Z–R) relationship and attenuation correction, and the reintroduction of a correction for non-uniform beam-filling (NUBF) effects (described in Kozu and Iguchi, 1999) that had been removed from V6. Be-cause there are large gaps in the NWS operational observing system in mountainous regions, we build on earlier work by Prat and Barros (2010a) and overlapping V6 and V7 products (TRMM PR 2A25) are also compared here for the 3 years of concurrent availability in the study region (2008–2011).
Table 1. Inventory of long-term raingauges in the Pigeon River basin including the Great Smoky Mountains National Park (GSMNP) in the southern Appalachians used in this study.
Raingauge Latitude Longitude Elevation (m) Series
RG001 35.4 −82.91 1156
RG0XX eastern ridge RG002 35.43 −82.97 1731
RG003 35.38 −82.92 1609 RG004 35.37 −82.99 1922 RG005 35.41 −82.96 1520 RG008 35.38 −82.97 1737 RG010 35.46 −82.95 1478
RG100 35.59 −83.07 1495
RG1XX inner ridge RG101 35.58 −83.09 1520
RG102 35.56 −83.1 1635 RG103 35.55 −83.12 1688 RG104 35.55 −83.09 1587 RG105 35.63 −83.04 1345 RG106 35.43 −83.03 1210 RG107 35.57 −82.91 1359 RG108 35.55 −82.99 1277 RG109 35.5 −83.04 1500 RG110 35.55 −83.15 1563 RG111 35.73 −82.95 1394 RG112 35.75 −82.96 1184
RG300 35.73 −83.22 1558
RG3XX western ridge RG301 35.71 −83.26 2003
RG302 35.72 −83.25 1860 RG303 35.76 −83.16 1490 RG304 35.67 −83.18 1820 RG305 35.69 −83.13 1630 RG306 35.75 −83.17 1536 RG307 35.65 −83.2 1624 RG308 35.73 −83.18 1471 RG309 35.68 −83.15 1604 RG310 35.7 −83.12 1756 RG311 35.77 −83.14 1036
and convective rainfall as defined by TRMM-based criteria with the purpose of characterizing the uncertainty in each class and exploring the physical basis of associated errors. Section 4 focuses on diagnosing the potential sources of er-rors for illustrative case studies. Summary and conclusions follow in Sect. 5.
2 Data
2.1 The GSMNP raingauge network
A high spatial resolution raingauge network has been installed in the Great Smoky Mountains National Park (GSMNP) in the southern Appalachians since 2007 (Prat and Barros, 2010b). In this study, 32 stations equipped with tipping bucket (TB) gauges operating for the longest con-tinuous period, distributed at mid to high elevations (from
poten-Figure 1. Region of study including the GSMNP in the southern Appalachians. The right panel shows the Pigeon River basin where the raingauges are installed. Note RG0XX, RG1XX, and RG3XX were installed in summer 2007, 2008, and 2009, respectively. Additional raingauges and other instrumentation placed in the region are not shown here (see http://iphex.pratt.duke.edu).
tial errors due to spatial density and geolocation distribution of the gauges, wind effects, surface wetting of the gauge fun-nel, animal and human interference, evaporation, and splash-ing that may introduce error in the rasplash-ingauge observations independently of the measurement accuracy proper. For ex-ample, for high wind speeds, the reported rain rate is typi-cally 2–18 % lower than the actual value (Chen et al., 2013; Wang and Wolff, 2010). Nevertheless, the raingauge mea-surements provide a reliable and independent reference to evaluate uncertainties and identify possible biases associated with remote-sensing estimates.
Over the southern Appalachians, most precipitation is as-sociated with stratiform systems, although isolated thunder-storms and mesoscale convective systems are dominant in the warm season. Figure 1 shows a map of the study re-gion, where the GSMNP network is a relatively dense rain-gauge network deployed in the Pigeon River basin in the southern Appalachians spanning an area of about 1400 km2. As can be seen in Fig. 1, the RG0XX (easternmost) and RG3XX (westernmost) gauges are clustered over the outer ridges, whereas the RG1XX gauges are distributed in the inner mountain region. Figure 2 shows the spatial variabil-ity of average daily precipitation raingauge accumulations over the period of study. Note the lack of classic orographic rainfall enhancement with elevation (Fig. 2b), as well as the stronger variability for the RG1XX gauges in the inner mountain region (blue colors) with higher rainfall totals at lower elevations in the valleys and at ridge tops and a de-crease at intermediate elevations on hill slopes. The high val-ues in the valleys reflect the contribution of seeder–feeder processes resulting from the interaction of stratiform rain-fall with low-level clouds and thick fog banks (Wilson and Barros, 2014). Complex orographic precipitation effects in
Figure 2. (a) Average rain accumulation (mm day−1) for the rain-gauges deployed in the GSMRGN. Average rain accumulation as a function of (b) elevation and (c) geolocation of each raingauge with circle size indicating relative magnitude of the daily rain accumula-tion.
[image:4.612.114.479.69.258.2] [image:4.612.308.549.324.587.2]Figure 3. Three-hourly diurnal cycle as a function of the season of the year and the raingauge network location (eastern, inner, and western ridges) for (a) spring (April-May-June), (b) summer (July-August-September), (c) fall (October-November-December), (d) winter (January-February-March).
the summer, rainfall frequency peaks in the late afternoon (15:00 to 18:00 EDT – eastern daylight time) with daytime convection accounting for nearly 20 % of the seasonal total and is somewhat uniform in the remainder of the day with each period contributing about 10–15 %; during the winter, rainfall frequency reveals a strong diurnal cycle character-ized by a high-amplitude maximum in the early afternoon (12:00 to 15:00 EDT) and a relative minimum occurring be-tween 21:00 and 06:00 EDT. Spring and fall seasons, on the other hand, exhibit a much weaker diurnal cycle, with a rela-tive maximum occurring in the afternoon and otherwise more or less constant throughout the rest of the day.
2.2 TRMM PR 2A25 products
The TRMM satellite was launched in November 1997 and operated on a non-sun-synchronous orbit designed to cap-ture precipitation struccap-ture in the tropics. On 8 July 2014 NASA ceased station keeping maneuvers and TRMM is currently drifting downward from its operating altitude of 402 to 335 km, an altitude expected to be reached around February 2016, at which point data collection will be ter-minated. The PR is the first active microwave instrument used for measuring three-dimensional rainfall structures over the tropics and subtropics from space (Kozu et al., 2001) and produces more reliable near-surface estimates of pre-cipitation at a higher spatial resolution than radiometers in-cluding in mountainous regions (Barros et al., 2000; Bar-ros and Tao, 2008; Nesbitt et al., 2000). The PR operates
at 13.8 GHz frequency with 250 m vertical resolution and is thus capable of penetrating dense cloud layers to detect un-derlying precipitation (Prasetia et al., 2012). Retrieval errors such as the uncertainty of the assumed drop size distribu-tion (DSD), incorrect physical assumpdistribu-tions (freezing-level height, hydrometeor temperatures), possible contamination by surface backscatter, the reliability and physical basis of the stratiform-convective classification, attenuation and ex-tinction of the signal and NUBF effects, light rain sensitivity (minimum detectable signal), and surface clutter rejection all contribute to uncertainty in PR rainfall estimates, and the re-spective effects are corrected to varying degrees (Iguchi et al., 2009; Wolff and Fisher, 2008).
results suggested very small errors due to NUBF for the TRMM PR; however, no studies focused on subgrid-scale effects in mountainous regions where there is a strong co-organization of landform and precipitation along with strong space–time variability. Other sources of errors include the orbital geometry of the satellite at relatively high latitudes (Fisher, 2004), and local hydrometeorological regimes which may present cloud and rainfall vertical structure very dif-ferent from that implied in the retrieval algorithm’s micro-physical assumptions. Intercomparison of precipitation esti-mates from different algorithms allows for examination of the specific impacts of algorithm differences on QPE relia-bility and accuracy. For instance, the underestimation of rain rate in V6 (Prat and Barros, 2010a) was addressed in the V7 algorithm revisions by recalibration of theZ-R relation-ship over land and implementation of the NUBF correction to produce larger estimates both over land and over ocean (Seto et al., 2011). Finally, sampling errors are subject to sampling frequency and the spatiotemporal structure of pre-cipitation associated with diurnal, seasonal, and inter-annual variability of rainfall within a region. Even though sampling errors are more randomly distributed, they can be a signifi-cant contribution to the total error (Fisher, 2004). The main TRMM product used in this work is the PR 2A25 V7 prod-uct, described at http://disc.sci.gsfc.nasa.gov/precipitation/ documentation/TRMM_README. V6 products are used for assessing V7 algorithm improvements, specifically with re-gard to instantaneous precipitation estimates. For this pur-pose, all rainfall measurements observed coincidentally by TRMM overpasses and the GSMNP network from June 2008 to May 2011 are used.
An important challenge in the validation of satellite-derived estimations against ground measurements is the res-olution discrepancy of different data sets. Here, all the rain-gauge measurements within a 2.5 km radius from the center of the PR pixel position for each PR overpass within a se-lected timescale are integrated into one. Nevertheless, match-ing the observations from ramatch-ingauges and TRMM PR at the nominal pixel scale (∼5 km) in space and time introduces uncertainties due to differences in the measurement control volume, generally referred to as representativeness error (i.e., Porcù et al., 2014), which is further aggravated due to sparse spatial sampling and topographic variations: raingauges re-port near-surface point rainfall rate while satellite estimates correspond to a cloud volume-averaged rainfall rate, which is also highly dependent on the precipitation system, cloud physics and morphology, and associated rainfall (e.g., Habib and Krajewski, 2002; Prat and Barros, 2010a). However, this discrepancy can be alleviated by using an optimal integra-tion time interval for gauge observaintegra-tions (Prat and Barros, 2009; Wang and Wolff, 2010) as it is done in this manuscript (see Sect. 2.3). Despite these challenges, comparisons with ground reference gauges constitute a critical component in evaluating the accuracy of the PR estimates of surface pre-cipitation, reflectivity and rain rate.
2.3 Comparison of TRMM PR 2A25 V7 vs. V6
2.3.1 Rainfall detection
integra-Table 2. Contingency matrices for TRMM 2A25 V7 surface rain rate and 10 min raingauge rain rates for (a) all angles and (b) near-nadir cases. Counts are expressed as a percentage of the total number of observations. Values in parentheses are for V6. The 10 min timescale is centered over the time of the satellite overpass during June 2008–May 2011.
(a) All angles (RG0XX and RG1XX)
TRMM PR 2A25
Yes No Tot.
Yes 1.18 (1.12) 2.73 (3) 3.91 (4.12) No 0.74 (0.71) 95.35 (95.17) 96.09 (95.88) Tot. 1.93 (1.83) 98.07 (98.17) 100 (100)
(b) Near-nadir cases (RG0XX and RG1XX)
TRMM PR 2A25
Yes No Tot.
[image:7.612.159.435.106.243.2]Yes 2.23 (2.01) 2.83 (3.12) 5.06 (5.13) No 1.24 (1.28) 93.7 (93.59) 94.94 (94.87) Tot. 3.47 (3.29) 96.53 (96.71) 100 (100)
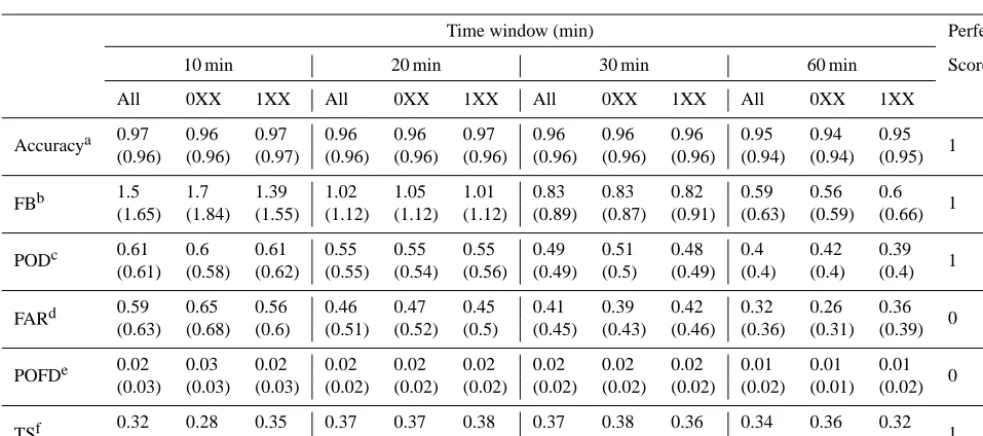
Table 3. Rainfall detection metrics for TRMM 2A25 V7 (V6) compared to RG observations as a function of timescale (10, 20, 30, 60 min) during June 2008–May 2011. Note the definitions of the skill scores are provided below.Y indicates positive detection;N indicates no detection.
Time window (min) Perfect
10 min 20 min 30 min 60 min Score
All 0XX 1XX All 0XX 1XX All 0XX 1XX All 0XX 1XX
Accuracya 0.97 0.96 0.97 0.96 0.96 0.97 0.96 0.96 0.96 0.95 0.94 0.95 1 (0.96) (0.96) (0.97) (0.96) (0.96) (0.96) (0.96) (0.96) (0.96) (0.94) (0.94) (0.95)
FBb 1.5 1.7 1.39 1.02 1.05 1.01 0.83 0.83 0.82 0.59 0.56 0.6 1 (1.65) (1.84) (1.55) (1.12) (1.12) (1.12) (0.89) (0.87) (0.91) (0.63) (0.59) (0.66)
PODc 0.61 0.6 0.61 0.55 0.55 0.55 0.49 0.51 0.48 0.4 0.42 0.39 1 (0.61) (0.58) (0.62) (0.55) (0.54) (0.56) (0.49) (0.5) (0.49) (0.4) (0.4) (0.4)
FARd 0.59 0.65 0.56 0.46 0.47 0.45 0.41 0.39 0.42 0.32 0.26 0.36 0 (0.63) (0.68) (0.6) (0.51) (0.52) (0.5) (0.45) (0.43) (0.46) (0.36) (0.31) (0.39)
POFDe 0.02 0.03 0.02 0.02 0.02 0.02 0.02 0.02 0.02 0.01 0.01 0.01 0 (0.03) (0.03) (0.03) (0.02) (0.02) (0.02) (0.02) (0.02) (0.02) (0.02) (0.01) (0.02)
TSf 0.32 0.28 0.35 0.37 0.37 0.38 0.37 0.38 0.36 0.34 0.36 0.32 1 (0.3) (0.26) (0.32) (0.35) (0.34) (0.36) (0.35) (0.36) (0.34) (0.33) (0.34) (0.32)
aAccuracy: (Y Y+N N)/total;bfrequency bias: FB=(Y Y+Y N)/(Y Y+N Y);cprobability of detection: POD=Y Y /(Y Y+N Y);dfalse alarm ratio: FAR=Y N /(Y Y+Y N);eprobability of false detection: POFD=Y N /(N N+Y N);fthreat score: TS=Y Y /(Y Y+N Y+Y N).
tion of Level 1 results, and can serve as a fair indicator of effective rainfall detectability of TRMM.
The contingency matrices of PR estimates, with regard to the gauge observations at a 10 min timescale for all an-gles (a) and for near-nadir cases only (b), are presented in Table 2. Table 3 provides a summary of detection metrics (i.e., skill scores) based on the counts of hits (Y Y), misses (N Y), false alarms (Y N) and correct rejections (N N) in-ferred from contingency matrices at timescales ranging from 10 to 60 min: accuracy, frequency bias (FB), probability of detection (POD), false alarm ratio (FAR), probability of false detection (POFD), and threat score (TS). The equations to calculate the skill scores are included as footnotes to Table 3.
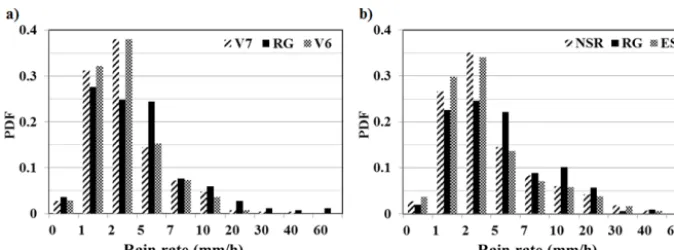
[image:7.612.52.544.300.518.2]de-Figure 4. (a) Probability distributions of rain rates for V7 and V6 comparison of non-null TRMM 2A25 near-surface rain rate (NSR) estimates and average raingauge rain rates for near-nadir pixels (scanning inclination angles ranging from 0 to 9◦) during the period 1 June 2008– 31 May 2013; (b) probability distribution of non-null TRMM 2A25 V7 surface rain rate products (estimated surface rain rate (ESR) and NSR) and average gauge rain rates during the period 1 June 2008–31 May 2013. Raingauge rain rates are calculated using timescales of 10 (RG0XX and RG1XX) and 30 min (RG3XX) corresponding to the interval centered at the time of satellite overpasses.
tection and correct rejection, and lower probability of false alarms and missed detection.
Results from the sensitivity study of the skill scores to timescale of integration of raingauge observations centered at the time of TRMM overpasses are summarized in Ta-ble 3. TB RG3XX data are excluded from this comparison considering its coarse measurement accuracy (1 mm tip−1), and due to the fact that the record length of concurrent V6 and V7 is too short. V6 and V7 exhibit similar skill in ac-curacy and POFD at different timescales. The FB scores, which indicate whether TRMM has a tendency to underes-timate (< 1) or overesunderes-timate (> 1) rainfall, show strong sensi-tivity to the timescale of integration, followed by the gauge measurement sensitivity. Unbiased results are obtained at the 20 min timescale with skill scores close to perfect (1). The POD scores decrease with the timescale as expected due to the space–time intermittency of rainfall, and no significant improvements were found in V7 as compared to V6. FAR scores, which count how often the satellite products detect rainfall in the absence of rainfall at the gauges, are slightly lower for V7. Lower scores are observed in the RG1XX ries in the inner mountain region than in the RG0XX se-ries on the eastern ridges, possibly because of the raingauge measurement threshold (RG0XX: 0.2 mm tip−1, RG1XX: 0.1 mm tip−1) and location (RG0XX: outer ridge, RG1XX: inner ridge). The TS values, which are sensitive to correct detection and penalize for both missed detections and false alarms, are consistently higher in V7 as compared to V6, but only slightly so. Overall, this analysis indicates that V7 im-provements in rainfall detection in the southern Appalachi-ans are minimal relative to V6. This result is consistent with Kirstetter et al. (2013), who reported improvement in QPE but not in detection metrics for 2A25 V7 products relative to V6.
2.3.2 Quantitative precipitation estimation (QPE) To assess the accuracy of TRMM PR rainfall estimates, his-tograms of concurrent satellite near-surface rain rate (NSR) estimates and gauge observations for the near-nadir cases are displayed in Fig. 4a, using the average raingauge rates at the PR pixel scale. Only non-zero data pairs are used, and thereby large amounts of non-rainy days are excluded from this comparison. The overestimation of the relative frequency of light rainfall (< 5 mm h−1) results from QPE underestima-tion of heavier rainfall. Figure 4b suggests that V7 NSR es-timates of moderate rainfall rates are higher than estimated surface rain rate (ESR) estimates. In addition, scatterplots and regression analysis were examined (not shown here) for ESR and NSR against raingauge observations with similar results to those reported by Prat and Barros (2010a). Com-pared to V6, a smaller slope is obtained in V7 for these two TRMM products, which is consistent with Seto et al. (2011), who showed that V7 rain rate estimates are larger than in V6 over land and over ocean. The tendency to underestimate rain rate (slope > 1) has been mitigated in V7 with slopes closer to unity, thus indicating better agreement with the reference ground observations. The severe underestimation of heavy rainfall rates in both versions can be attributed at least in part to the lack of areal representativeness of the raingauges which are point estimates in contrast with the area-averaged (5×5 km2) TRMM rainfall estimates, although the point es-timates of rain rate are reduced by using a timescale of at least 10 min centered at the satellite overpass time.
3 Statistics and physical basis of PR 2A25 V7 error structure
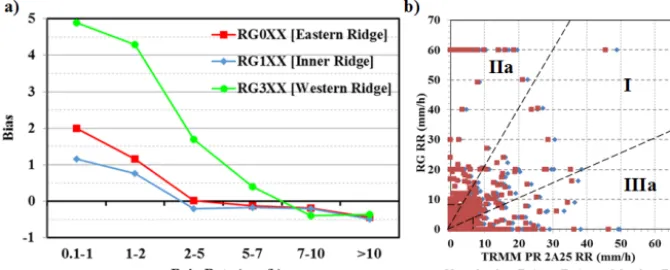
[image:8.612.131.468.66.191.2]sec-Figure 5. (a) Bias between TRMM 2A25 V7 NSR and average raingauge rain rates for different series: RG0XX, RG1XX, and RG3XX (see Table 1); (b) scatterplot for TRMM 2A25 V7 surface rain rates (NSR and ESR) and average raingauge rain rates during the period 1 June 2008–31 May 2013. Raingauge rain rates are using a 10 min (RG0XX and RG1XX) and 30 min (RG3XX) scale centered at the time of the satellite overpasses. Note the raingauge measurement and TRMM profile classifications as described in Table 4 (five primary categories, I-II-III-IV-V, and two subcategories, IIa-IIIa).
tion is organized by first evaluating the overall quantitative performance of TRMM precipitation estimates compared to gauge data, next, examining the rain type, rain rate, and the temporal distribution over a spectrum of timescales (e.g., di-urnal and seasonal) and, finally, exploring the relationship between rainfall error and vertical reflectivity structure.
3.1 Surface rain rate classes
The error analysis of TRMM estimates for 1820 PR over-passes in the southern Appalachians during 2008–2013 is presented here. The reference rainfall is computed in a sim-ilar manner to that described earlier by selecting raingauges that lie within a 2.5 km radius around the center of the PR pixel. A sensitivity analysis of bias was conducted on four TRMM PR 2A25 precipitation products: ESR, NSR, 2– 4 km averaged rain rate, and integrated column rain rate at various timescales ranging from 10 to 60 min (not shown here). Results for TRMM NSR indicate that bias is mini-mized at 10 min timescales for RG0XX and RG1XX, and 30 min for RG3XX estimates (RG0XX: ∼0.5, RG1XX:
∼0.2, RG3XX:∼0). Consequently, 10 and 30 min (centered at the time of overpass) rain rates from RG0XX and RG1XX and RG3XX, respectively, will be used as reference here-after. As seen in Fig. 5a, bias is lowest overall in the inner mountain region (RG1XX). Overestimation of light rainfall leads to large positive bias everywhere, but is much larger on the western ridges (RG3XX) than on the eastern ridges (RG0XX) or in the inner region (RG1XX) consistent with the gauges’ measurement resolution (Fig. 5a); for moderate and heavier rain rates (> 5 mm h−1), the bias is negative, rel-atively small, and uniformly distributed.
Regression analysis (not shown here) of PR 2A25 V7 rafall estimates (NSR and ESR) vs. averaged gauge data in-dicates that for non-null PR-gauge pairs, both estimates de-rived from PR are in good agreement (regression slope close
to one) with the ranges of rainfall intensity associated with the regional hydrometeorological regimes, but theR2value is very low for both estimates (NSR: 0.09, ESR: 0.08), which likely results from significant discrepancies for heavy rainfall events.
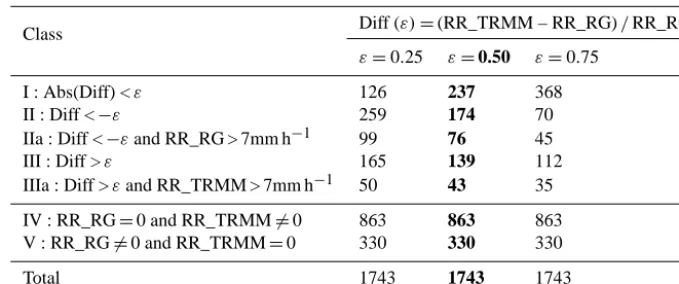
In order to better understand the quantitative discrepancy between TRMM and RG, the matched PR pixels and rain-gauge cluster pairs are classified into five distinct categories corresponding to the relative difference (ε) of the 2A25 esti-mates with respect to raingauge observations (see Fig. 5b and Table 4). The same classes are used later in the manuscript to examine TRMM reflectivity profiles. In Table 4, regard-less of the value of the discrepancy in the rainfall rate esti-mates, conditions when rain was simultaneously observed by the satellite and raingauges (cases I, II, III) correspond to ap-proximately 31 % of all cases, while about 50 % report rain for TRMM only (case IV, FA), and about 19 % report rain for raingauges only (case V, MD). As will be shown later in more detail (see Fig. 7a), a large fraction of FAs and MDs occurs at larger viewing angles (> 8◦) in which case NUBF
[image:9.612.132.467.70.205.2]can-Table 4. Classification of TRMM 2A25 reflectivity profiles as a function of the difference (ε) (RR_TRMM2A25 – RR_RG)/RR_RG that represents the relative error of the 2A25 estimates with respect to the raingauge observations. The timescale of integration is 10 min for RG0XX and RG1XX and 30 min for RG3XX, which corresponds to the minimum error bias for the period of record. Bold values correspond toε=0.5.
Class Diff (ε)=(RR_TRMM – RR_RG)/RR_RG ε=0.25 ε=0.50 ε=0.75
I : Abs(Diff) <ε 126 237 368 II : Diff <−ε 259 174 70 IIa : Diff <−εand RR_RG > 7mm h−1 99 76 45 III : Diff >ε 165 139 112 IIIa : Diff >εand RR_TRMM > 7mm h−1 50 43 35
IV : RR_RG=0 and RR_TRMM6=0 863 863 863 V : RR_RG6=0 and RR_TRMM=0 330 330 330
Total 1743 1743 1743
not be explained by TB raingauge measurement limitations alone.
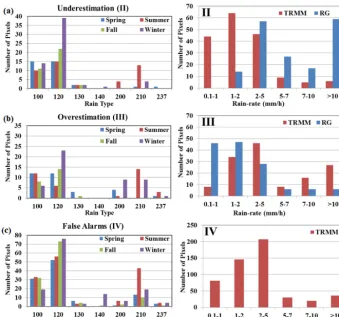
An overview of the organization of error categories as a function of rain type and rain rate is provided in Fig. 6. The rain type (derived in TRMM 2A23 as a parameter to sepa-rate convective and stratiform rain) and rain sepa-rate categories follow the error classification framework described in Ta-ble 4. A large fraction of UND errors (class II) is associ-ated with “probably stratiform” (rain type: 120) rainfall by the TRMM PR algorithm in the winter, but over 60 % cor-respond to heavy rainfall events (see Table 4, IIa) and most convective rainfall (200 and 210) occurs during the summer. There is a relatively small number of samples overall (the UND 5-year total is only 174, see Table 4). The errors tend to cluster at specific times of day that are consistent with the regional hydrometeorology, thus, enhancing our confidence on the diurnal cycle and providing a physical basis for at-tribution. Indeed, a survey of the results shows that the di-urnal cycle of UND error peaks during the period 15:00– 18:00 EDT (not shown here), a time of day typically asso-ciated with daytime solar forcing of convective activity. The histograms of TRMM and raingauge rain rate estimates for UND events (Fig. 6a, right panel) have a different skew with TRMM PR NSR estimates mostly below 5 mm h−1, whereas most raingauge observations exceed 10 mm h−1. This
indi-cates that UND errors cannot be corrected using linear bulk adjustments such as bias correction; rather, physical insight is needed to improve retrievals.
OVR (class III) errors are mostly associated with winter-time precipitation classified as “probably stratiform”. Inspec-tion (not shown here) of the apparent annual and diurnal cy-cles of OVR errors (note again the limited sample size on an hourly basis: 5-year total OVR is 139, Table 4, III) in-dicates that these errors exhibit a diurnal cycle peaking in January and March during daytime (09:00–15:00 EDT), con-sistent with the diurnal cycle of rainfall in winter (Fig. 3d). A
good overall agreement between the histograms of raingauge and TRMM rain rates (Fig. 6b, right panel) for these events suggests that bias correction of OVR errors should lead to immediate improvements in TRMM PR products. Figure 6c shows that FA (IV) errors are also associated with “strati-form” and “probably strati“strati-form” rainfall throughout the year and light rainfall rates (< 5 mm h−1).
Overall, the results show that the error budget of TRMM PR NSR estimates is largely controlled by ambiguity in the detection of the bright band (stratiform conditions) for sig-nificantly off-nadir observations (significant NUBF effects) for light rainfall conditions in all seasons and generally in the wintertime.
3.2 Space–time error structure
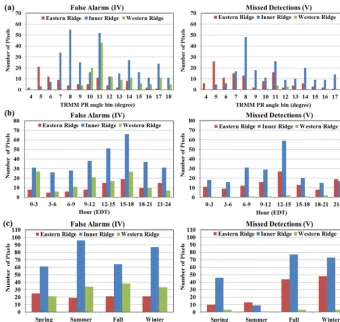
A survey of precipitation detectability skill in the TRMM PR 2A25 V7 from the point of view of FA and MD errors is presented in Fig. 7. The impact of the observing geometry is explored in Fig. 7a, focusing specifically on the interplay between complex orography, satellite orbit, and the viewing angle for each pixel in the satellite’s swath. Detection skill depends on the orbit and the specific trajectory of the satel-lite over the region. For the eastern ridges (RG0XX series), a large portion of FA occurs at small angles, in particular∼5◦, reflecting the geometry of the overpasses and the terrain un-derneath as the satellite approaches the Appalachians; in the inner ridges (RG1XX series) more cases are observed around 8 and 11◦; for the western ridges (RG3XX series) almost
all cases are registered at off-nadir angles (≥9◦), especially
[image:10.612.127.467.117.259.2]Figure 6. Histogram of rain type (left panels) and observed RG rain rate and NSR from TRMM (right panels) distributions for the different errors: (a) II (UND); (b) III (OVR); and (c) IV (FA). The error classification is provided in Table 4. The rain type categories correspond to the TRMM 2A23 rain-type flag: 100 – stratiform certain, 120 – probably stratiform, 130 – maybe stratiform, 140 – maybe stratiform or maybe transition or something else, 200 and 210 – convective certain, 237 – probably convective. (For further details please see the 2A23 documentation at http://disc.sci.gsfc.nasa.gov/precipitation/documentation/TRMM_README).
(blue color). The seasonal cycle shows that FAs in the eastern ridges and western ridges are relatively uniformly distributed throughout the year, whereas they peak in the summer in the inner ridges. Furthermore, the number of FAs and MDs in the inner region is very high and dominates overall statistics. Close examination of the diurnal cycle reveals that most FAs in the summer occur in the afternoon (12:00–18:00 EDT), corresponding to diurnal convective activity, while winter cases follow the diurnal cycle of precipitation pattern peak-ing in the early afternoon (not shown here).
Among all MD cases, most are classified as “no rain” and some are categorized as “other”, whereas only three are classified as stratiform and none are considered convective (not shown here). Figure 7b and c for MDs (class V) show a strong diurnal cycle with most occurring around 12:00– 15:00 EDT and a seasonal trend with a large proportion oc-curring during the cold season, which is attributed to the fre-quent presence of fog and low-level clouds in the fall and winter seasons, especially in the inner region (RG1XX). The very small count of MDs in the western ridges (RG3XX) is explained in part by the coarse gauge sensitivity (1 mm tip−1,
30 min timescale) and because fog seldom develops over this region due to strong winds. Dense and deep fog formation during the fall and winter seasons in the inner mountain re-gion establishes conditions for enhanced stratiform rainfall via seeder–feeder mechanisms at low levels (< 1 km) that is measured by the gauges in the inner mountain region (e.g., Wilson and Barros, 2014) but cannot be detected by the TRMM PR due to the topography and automatic ground-clutter correction. In addition, the minimum detectable sig-nal of TRMM PR is approximately 18 dBZ (0.4 mm h−1) (Heymsfield et al., 2000; Yang and Nesbitt, 2014) and, thus, weak radar reflectivity for light rainfall can also partly ex-plain MD statistics.
3.3 TRMM PR reflectivity profile and rainfall detectability
strat-Figure 7. Histograms of FA (left panel) and MD (right panel) occurrences as a function of the viewing angle (a), time of the day (b) and season of the year (c). As previously, the colors correspond to raingauges aligned with the eastern (red, RG0XX), western (green, RG3XX) and inner ridges (blue, RG1XX) in the region of study (Fig. 1, Table 1).
iform precipitation by TRMM-derived criteria, three cate-gories of reflectivity profiles have been identified (see Fig. 8): (1) stratiform with bright band (BB); (2) stratiform without BB; and (3) convective. Note that the reflectivity profile is used in the rain classification algorithm, in addition to the precipitation rate estimation proper.
For stratiform UND cases (see Fig. 8a and b, class II), the reflectivity gradually decreases with altitude and the median values between 2 and 4 km are in the range of 20–30 dBZ approximately. Some UND cases (see the red outliers in Fig. 8b, II) display high cloud tops (up to 9 km), consistent with the heavy rainfall events in Fig. 6a that are indicative of warm rain with embedded convection. Reflectivity data below 2 km are often removed due to ground-clutter contam-ination. In Fig. 8a (III), the mean reflectivity profile shows a decreasing tendency with height (from 2.75 km toward the ground surface), suggesting that summertime OVR errors are likely linked to light rainfall evaporating before it reaches the ground (see rain type: 100 in Fig. 6b). Compared to the UND (II) cases (left panels in Fig. 8), the reflectivity profiles for OVR cases show steeper positive gradients at lower levels, in particular below 3 km, and more measurements are
[image:12.612.129.469.66.388.2]Figure 8. TRMM 2A25 reflectivity profiles for error classes II (UND), III (OVR), and IV (FA): (a) stratiform conditions with BB detected (rain type: 100 and 130, Fig. 6), (b) stratiform conditions without BB detected (rain type: 120 and 140, Fig. 6), and (c) convective conditions (rain type: 200, 210, and 237, Fig. 6). The blue box denotes the interquartile range (IQR) from the lower quartile (25th) to the upper quartile (75th); the median is indicated by the red mark inside the box. The red line connects the median reflectivity at all levels to yield the median reflectivity profile. The two horizontal lines (“whiskers”) extending from the central box represent the±1.5 IQR interval. Outliers (points falling out of±1.5 IQR) are marked as red crosses. For each error class, the right panel shows the number of observations with height; the red line for error class IV (FA) shows the distribution of outliers with height.
4 Physical context of retrieval error
In this section, we focus primarily on diagnosing the poten-tial sources of errors in the retrieval algorithm by studying se-lected representative TRMM overpasses with substantial dis-crepancies between 2A25 V7 NSR estimates and raingauge observations, including isolated thunderstorms, mesoscale convective systems, cold fronts, hail events, and snow show-ers. Figure 9 shows the TRMM overpass in the region of study for each of the selected cases overlaid on the base re-flectivity fields from the KMRX and KGSP NWS (National Weather Service) radars, respectively, in Knoxville, TN, and Greer, SC.
4.1 Local underestimation (II)
Figure 9. Base reflectivity composites from KMRX (Knoxville, TN) and KGSP (Greer, SC) National Weather Service radars corresponding to the overpass times shown in Figs. 10–12 below. The lines of black circles show the overpass tracks corresponding to the cross sections in Figs. 10–12. The dashed line delimits the northern boundary of the TRMM PR swath over the southern Appalachians, and the 1000 m terrain elevation contour line and the outline of the study region (the Pigeon River basin) are marked in solid black for reference.
orographic clouds, this difference in elevation (∼650 m) is sufficient to explain the 1 order of magnitude difference in rainfall intensities by seeder–feeder enhanced coalescence (Wilson and Barros, 2014). The PR reflectivity profile extends up to 8 km in altitude and there is no indication of bright band or large ice-scattering aloft; nevertheless, this pixel is classified as “probably stratiform” (rain type: 120) based on the H method because of the weak echo. In addition to the ground-clutter filter that eliminates a signif-icant fraction of the measured reflectivity profile at lower levels, the incorrect classification of shallow convection as probably stratiform is also due in part to the effect of spatial averaging over the PR’s relatively coarse horizontal resolution, a smoothing effect that is amplified at off-nadir viewing angles. Similar results were reported by Heymsfield et al. (2000), who found that convective precipitation often falls from cells smaller than the PR footprint and its average reflectivity tends to be underestimated due to the NUBF effects, consequently leading to the rain-type classification being artificially biased toward the stratiform type. Nev-ertheless, an examination of the TRMM reflectivity cross section in Fig. 10a as well as PR 4 km reflectivity fields (not shown here) clearly reveals the substantial advantage of the satellite-based radar in mountainous regions, where the terrain blocks the monitoring effectiveness of the ground radars (see Fig. 9a).
Figure 10b and c display the vertical cross section of re-flectivity and rain rate of two adjacent scans on 8 July 2011, 15:51 EDT, associated with the presence of small bands and clusters of severe summer thunderstorms in the region of in-terest at the time of overpass (Fig. 9b). Two selected pixels (denoted as pixel 1 on one scan and pixel 2 on the other) ob-served at a∼12.1◦angle among those corresponding to the high altitude outliers (red+signs) in Fig. 8c (II) are high-lighted here. Note the steep increase in profile reflectivity at altitudes above 4 km followed by a decrease with height that indicates the existence of a bright band; along with high low-level reflectivities, the vertical structure of reflectivity suggests that over the western slopes of the Appalachians high precipitation rates were produced by a stratiform sys-tem with embedded convection. Although gauges RG303 (40 mm h−1) and RG311 (60 mm h−1) are very close together
embedded convection are very small, averaging significantly reduces the TRMM estimated rainfall and reduces spatial variability. Therefore, TRMM appears to underestimate rain-fall from the isolated small-scale summer convective cells, consistent with previous studies demonstrating the underes-timation of convection over land by the TRMM PR algorithm (Iguchi et al., 2009; Rasmussen et al., 2013). Among the two raingauge observations in pixel 2, more intense rainfall is observed in the nearby valley (RG311) than on the ridge (RG303), and the PR reflectivity in the valley is much higher than surrounding ridges. Despite horizontal separation in ad-dition to the elevation difference, the low-level enhancement of rainfall at RG311 compared to RG303 is consistent with the increased depth of the precipitation column and ,thus, enhanced raindrop growth by coalescence (Prat and Barros, 2010b; Wilson and Barros, 2014). In such circumstances, orographic rainfall does not increase with elevation as in the canonical model. This event highlights detectability chal-lenges over mountainous regions at coarse horizontal scales (e.g., high spatial variability due to the inability to resolve the complexity of the physics of orographic enhancement). The effective resolution deformation at far-range viewing angles may further contribute to the large underestimation.
4.2 Local overestimation (III)
At the time of the TRMM overpass on 18 August 2011, 18:53 EDT, there were small convective clusters and iso-lated thunderstorms scattered across the region (Fig. 9c). The KMRX radar located in Knoxville, TN, shows no ac-tivity over the Appalachians, but the KGSP radar located in Greer, SC, does show activity over the eastern ridges, which is consistent with the shallow isolated cells detected by the TRMM PR shown in Fig. 11a. Classified as “certainly con-vective” (the reflectivity profiles show no signal of ice scat-ter aloft), the retrieved near-surface rain rate overestimates the observed precipitation at RG005 (∼1.52 km; 12 mm h−1) and RG008 (∼1.74 km; 18 mm h−1) by nearly 60 % on av-erage (viewing angle is 5.2◦). Interestingly, despite very dif-ferent vertical structures including the bright band effects for the UND (II) case on 8 July 2011 discussed in Sect. 4.1, the near-surface precipitation estimates derived from TRMM for both cases are about the same (∼24 mm h−1). However, the OVR(III) problem could be related to the relative position of the two gauges at the edge of the isolated convective cluster (Fig. 9c) as the satellite moves over the orography, in which case NUBF artifacts should lead to overestimation of reflec-tivity over the gauges outside of the convective cluster. In-deed, the TRMM PR reflectivity between 2 and 4 km is in the 40–50 dBZ range, whereas the base reflectivity from KGSP at gauge locations is in the 20–30 dBZ range.
Two other relevant OVR (III) cases coincided with the pas-sage of a cold front with a leading pre-frontal convection line in the piedmont on 21 January 2012 that was captured by the TRMM overpass at 12:05 EDT (Fig. 9d), and a pattern
of disorganized thunderstorm activity ahead of the propaga-tion of a westerly convective system on 17 April 2012 with overpass at 15:09 EDT (Fig. 9e). The winter system produced major winter snow and ice precipitation from western North Carolina to New York State. In the reflectivity cross section (Fig. 11b), the vertical profiles exhibit a sharp decrease of about 16 dBZ in reflectivity between 2 and 3 km. The TRMM PR rain rate at∼2 km and the value observed at RG109 in the inner mountain region (∼1.5 km, Fig. 1) are 26.3 and 10.8 mm h−1, respectively, resulting in an overestimation of 140 %. However, raingauge measurements are expected to exhibit significant errors (∼up to 60 %) for frozen precip-itation and even higher for snow in the presence of strong winds. Since this event produced significant snow accumula-tion and frozen rain, error attribuaccumula-tion is an ambiguous propo-sition.
Both ground-based radars (KMRX, KGSP) miss the deep, isolated convective activity in the mountains that is detected by the TRMM PR (Fig. 11c). The vertical profiles for pixels 1 and 2 over the locations of RG001 and RG010 on the eastern slopes of the Appalachians show large reflectivity (> 30 dBZ) up to around 6–7 km, suggesting the presence of ice/hail aloft. Records held by the State Climate Office of North Car-olina (http://www.nc-climate.ncsu.edu/lsrdb/index.php) re-veal multiple reports of intense hail over large areas in the southern Appalachian Mountains at the time. However, rain-gauge records indicate only 1.2 and 9 mm h−1 compared to 25.8 and 36.5 mm h−1 from TRMM estimates for pixel 2 (RG001) and pixel 1 (RG010), respectively. Again, this reflects the deficiency of tipping-bucket gauges to capture frozen precipitation, and hail in particular. Conditions in the two pixels are classified as “certainly convective” because of the high horizontal reflectivity gradients. The TRMM PR demonstrates good capability to detect this hail-producing storm.
4.3 Local false alarms (IV)
Figure 12. Cross section of reflectivity (Z) and rain rate estimates (RR) from TRMM 2A25 for a selected case of incorrect false alarm determination at 19:54 EDT on 24 January 2010. The top row shows an overpass cross section. The bottom row shows the cross section between the two dashed vertical lines in the top row plots. Asterisks denote the position of RG302, and the color in the right panel is consistent with the measured rain rate. The black arrow identifies the PR profile used to make the error determination. Ground-clutter flags are shown in white. The black continuous line represents the topography.
tation. According to winter storm reports from the State Cli-mate Office of North Carolina (http://www.nc-cliCli-mate.ncsu. edu/climate/winter_wx/database.php), snow showers devel-oped across the mountains on 12 January 2010, resulting in ice and snow accumulation in the lower valleys. The sub-stantial increase in reflectivity at lower levels in the TRMM PR profiles likely results from frozen precipitation particles in cold clouds and/or the accumulated ice and snow in the valleys detected by TRMM.
5 Summary and conclusions
TRMM PR 2A25 QPE products were spatiotemporally matched and compared with ground gauges in the southern Appalachian Mountains over a 5-year period, 2008–2013, which provides a statistically large sample of comparisons performed at PR-pixel resolution. The quantitative compar-isons yield favorable agreement of the PR with raingauge observations, with clear advantage over remote ground-based operating radars, but errors can be significant depending on the underlying rainfall regimes.
First, V7 and V6 QPEs were inter-compared in order to assess the impact of retrieval algorithm changes such as rein-troducing the NUBF correction, recalibration of theZ–R re-lationship over land, and attenuation correction of the PR radar signal. Although a small improvement from V6 to V7 was identified at high to moderate rainfall rates, the results do not show significant differences in warm-season precipi-tation detection skill.
Based on the TRMM rain-type classification, character-istic features in the vertical structure of reflectivity and re-trieved rainfall profiles that can be associated with distinct
con-ditions associated with different types of error, which should be helpful in identifying opportunities for improving retrieval algorithms in regions of complex terrain, despite the chal-lenges, particularly at the current spatial resolution. Specifi-cally in the case of surface contamination, special precaution should be taken when strong echoes are observed near the surface, an indication of surface clutter artifacts that should be excluded from rain analysis. Because of the importance of persistent low-level clouds and light rainfall in mountain-ous regions, generally, there is a critical need to develop re-trieval strategies that can capture the vertical structure of low-level reflectivity and the associated rainfall in complex ter-rain. This can be accomplished for instance by integrating operational satellite retrieval algorithms with simple physi-cal models targeting lophysi-cal processes (e.g., Prat and Barros, 2009; Wilson and Barros, 2014).
Albeit of low frequency, heavy precipitating events have a significant hydrologic impact leading to extreme floods and landslides in the region. Six representative case studies with substantial discrepancies between TRMM and gauge refer-ences provide insight into the characteristics of PR rainfall retrieval errors that need to be taken into consideration for ap-plications in complex terrain. The results show that TRMM tends to underestimate small-scale winter storms and embed-ded convection in the summer, which can be attributed to the averaging effects of NUBF at TRMM PR coarse hori-zontal resolution as well as misclassification of convective systems as stratiform, especially at large incidence angles. Precipitation from warm season convective systems smaller than the PR footprint is either underestimated or overesti-mated depending on the size of the system footprint and the depth of active convection. In particular, TRMM tends to un-derestimate rainfall from embedded convection, and overes-timates rainfall from isolated small-scale shallow convection when and where it is detected. Cold-season mixed-phase pre-cipitation (e.g., hail, and ice falling through melting layers) is associated with a strong scattering signal from ice crys-tals and can be misclassified as “certain convective”. Mixed-phase precipitation cannot be estimated by the convectiveZ– R(reflectivity–rainfall) relationship in the algorithm, leading to the severe overestimation or false alarm errors in the win-ter and spring seasons.
Diagnostic analysis focusing on the characterization of the physical basis of the QPE error provides a framework for er-ror source attribution and, generally, subsequent correction or mitigation of satellite retrievals and can be applied else-where. Based on the results presented here, the observing strategy devised for IPHEx placed strong emphasis on doc-umenting the spatial and temporal heterogeneity of rainfall microphysics conditional on time of day, prevalent hydrome-teorological regime, and topographic and physiographic con-text (Barros et al., 2014). Special emphasis was placed on the vertical structure of precipitation in the lower troposphere. Analysis of IPHEx results is ongoing.
Acknowledgements. This research was funded in part by NASA
grant NNX13AH39G to the third author A. P. Barros.
Edited by: P. Molnar
References
Amitai, E., Llort, X., and Sempere-Torres, D.: Comparison of TRMM Radar Rainfall Estimates with NOAA Next-Generation QPE, J. Meteorol. Soc. Jpn., 87A, 109–118, doi:10.2151/jmsj.87A.109, 2009.
Amitai, E., Unkrich, C. L., Goodrich, D. C., Habib, E., and Thill, B.: Assessing Satellite-Based Rainfall Estimates in Semi-arid Watersheds Using the USDA-ARS Walnut Gulch Gauge Network and TRMM PR, J. Hydrometeorol., 13, 1579–1588, doi:10.1175/jhm-d-12-016.1, 2012.
Barros, A. P.: Orographic precipitation, freshwater resources, and climate vulnerabilities in mountainous regions, in: Climate Vul-nerability: Understanding and Addressing Threats to Essen-tial Resources, Elsevier Inc., Academic Press, Waltham, Mas-sachusetts, 57–78, 2013.
Barros, A. P. and Tao, K.: A Space-Filling Algorithm to Extrapolate Narrow-Swath Instantaneous TRMM Microwave Rain-Rate Es-timates Using Thermal IR Imagery, J. Atmos. Ocean. Tech., 25, 1901–1920, doi:10.1175/2008jtecha1019.1, 2008.
Barros, A. P., Joshi, M., Putkonen, J., and Burbank, D. W.: A study of the 1999 monsoon rainfall in a mountainous region in cen-tral Nepal using TRMM products and rain gauge observations, Geophys. Res. Lett., 27, 3683–3686, doi:10.1029/2000gl011827, 2000.
Barros, A. P., Petersen, W., Schwaller, M., Cifelli, R., Mahoney, K., Peters-Liddard, C., Shepherd, M., Nesbitt, S., Wolff, D., Heyms-field, G., Starr, D., Anognostou, E., Gourley, J. J., Kim, E., Kra-jewski, W., Lackman, G., Lang, T., Miller, D., Mace, G., Petters, M., Smith, J., Tao, W.-K., Tsay, S.-C., and Zipser, E.: NASA GPM-Ground Validation: Integrated Precipitation and Hydrol-ogy Experiment 2014 Science Plan, Duke University, Durham, NC, 64 pp., doi:10.7924/G8CC0XMR, 2014.
Bindlish, R. and Barros., A. P.: Multifrequency Soil Moisture In-version from SAR Measurements with the Use of IEM, Remote Sens. Environ., 71, 67–88, doi:10.1016/S0034-4257(99)00065-6, 2000.
Chen, Y., Ebert, E. E., Walsh, K. J. E., and Davidson, N. E.: Eval-uation of TRMM 3B42 precipitation estimates of tropical cy-clone rainfall using PACRAIN data, J. Geophys. Res.-Atmos., 118, 2184–2196, doi:10.1002/jgrd.50250, 2013.
Durden, S. L., Haddad, Z. S., Kitiyakara, A., and Li, F. K.: Effects of nonuniform beam filling on rainfall retrieval for the TRMM precipitation radar, J. Atmos. Ocean. Tech., 15, 635–646, 1998. Fisher, B. L.: Climatological Validation of TRMM TMI
and PR Monthly Rain Products over Oklahoma, J. Appl. Meteorol., 43, 519–535, doi:10.1175/1520-0450(2004)043<0519:CVOTTA>2.0.CO;2, 2004.
Heymsfield, G. M., Geerts, B., and Tian, L.: TRMM Pre-cipitation Radar Reflectivity Profiles as Compared with High-Resolution Airborne and Ground-Based Radar Measure-ments, J. Appl. Meteorol., 39, 2080–2102, doi:10.1175/1520-0450(2001)040<2080:TPRRPA>2.0.CO;2, 2000.
Iguchi, T., Kozu, T., Meneghini, R., Awaka, J., and Okamoto, K.: Rain-Profiling Algorithm for the TRMM Precipitation Radar, J. Appl. Meteorol., 39, 2038–2052, doi:10.1175/1520-0450(2001)040<2038:RPAFTT>2.0.CO;2, 2000.
Iguchi, T., Kozu, T., Kwiatkowski, J., Meneghini, R., Awaka, J., and Okamoto, K. i.: Uncertainties in the Rain Profiling Algorithm for the TRMM Precipitation Radar, J. Meteorol. Soc. Jpn., 87A, 1– 30, doi:10.2151/jmsj.87A.1, 2009.
Kirstetter, P.-E., Hong, Y., Gourley, J. J., Schwaller, M., Petersen, W., and Zhang, J.: Comparison of TRMM 2A25 Products, Version 6 and Version 7, with NOAA/NSSL Ground Radar-Based National Mosaic QPE, J. Hydrometeorol., 14, 661–669, doi:10.1175/jhm-d-12-030.1, 2013.
Kozu, T. and Iguchi, T.: Nonuniform Beamfilling Correc-tion for Spaceborne Radar Rainfall Measurement: Implica-tions from TOGA COARE Radar Data Analysis, J. At-mos. Ocean. Technol., 16, 1722–1735, doi:10.1175/1520-0426(1999)016<1722:NBCFSR>2.0.CO;2, 1999.
Kozu, T., Kawanishi, T., Kuroiwa, H., Kojima, M., Oikawa, K., Kumagai, H., Okamoto, K., Okumura, M., Nakatsuka, H., and Nishikawa, K.: Development of precipitation radar onboard the Tropical Rainfall Measuring Mission (TRMM) satellite, IEEE Trans., Geosci. Remote Sens., 39, 102–116, doi:10.1109/36.898669, 2001.
Lang, T. J. and Barros, A. P.: An investigation of the onsets of the 1999 and 2000 monsoons in central Nepal, Mon. Weather Rev., 130, 1299–1316, 2002.
Liao, L. and Meneghini, R.: Validation of TRMM Precipitation Radar through Comparison of Its Multiyear Measurements with Ground-Based Radar, J. Appl. Meteorol. Clim., 48, 804–817, doi:10.1175/2008jamc1974.1, 2009.
Meneghini, R., Iguchi, T., Kozu, T., Liao, L., Okamoto, K., Jones, J. A., and Kwiatkowski, J.: Use of the Surface Reference Technique for Path Attenuation Estimates from the TRMM Precipitation Radar, J. Appl. Meteorol., 39, 2053–2070, doi:10.1175/1520-0450(2001)040<2053:UOTSRT>2.0.CO;2, 2000.
Nakamura, K.: Biases of rain retrieval algorithms for spaceborne radar caused by nonuniformity of rain, J. Atmos. Ocean. Tech., 8, 363–373, 1991.
Nesbitt, S. W., Zipser, E. J., and Cecil, D. J.: A Census of Pre-cipitation Features in the Tropics Using TRMM: Radar, Ice Scattering, and Lightning Observations, J. Clim., 13, 4087–4106, doi:10.1175/1520-0442(2000)013<4087:ACOPFI>2.0.CO;2, 2000.
Okamoto, K., Meneghini, R., Iguchi, T., Awaka, J., and Shimizu, S.: TRMM PR algorithms version 6 status and plans for ver-sion 7, in: Asia-Pacific Remote Sensing of the Atmosphere and Clouds II, November 17, Noumea, New Caledonia, edited by: Stephens, G. L. and Nakajima, T. Y., Proc. SPIE 7152, 715208, doi:10.1117/12.804932, 2008.
Porcù, F., Milani, L., and Petracca, M.: On the uncertainties in validating satellite instantaneous rainfall estimates with raingauge operational network, Atmos. Res., 144, 73–81, doi:10.1016/j.atmosres.2013.12.007, 2014.
Prasetia, R., As-syakur, A. R., and Osawa, T.: Validation of TRMM Precipitation Radar satellite data over Indonesian region, Theor. Appl. Climatol., 112, 575–587, doi:10.1007/s00704-012-0756-1, 2012.
Prat, O. P. and Barros, A. P.: Exploring the Transient Be-havior of Z-R relationships: Implications for Radar Rain-fall Estimation, J. Appl. Meteorol. Clim., 48, 2127–2143, doi:10.1175/2009JAMC2165.1, 2009.
Prat, O. P. and Barros, A. P.: Assessing satellite-based precip-itation estimates in the Southern Appalachian mountains us-ing rain gauges and TRMM PR, Adv. Geosci., 25, 143–153, doi:10.5194/adgeo-25-143-2010, 2010a.
Prat, O. P. and Barros, A. P.: Ground observations to characterize the spatial gradients and vertical structure of orographic precipitation – Experiments in the inner region of the Great Smoky Mountains, J. Hydrol., 391, 141–156, doi:10.1016/j.jhydrol.2010.07.013, 2010b.
Rasmussen, K. L., Choi, S. L., Zuluaga, M. D., and Houze, R. A.: TRMM precipitation bias in extreme storms in South Amer-ica, Geophys. Res. Lett., 40, 3457–3461, doi:10.1002/grl.50651, 2013.
Seto, S., Iguchi, T., and Meneghini, R.: Comparison of TRMM PR V6 and V7 Focusing Heavy Rainfall, Geoscience and Remote Sensing Symposium (IGARSS), 2011 IEEE International, Van-couver, Canada, 24–29 July, 2582–2585, 2011.
Tao, K., and Barros, A. P.: Using Fractal Downscaling of Satellite Precipitation Products for Hydrometeorologi-cal Applications, J. Atmos. Ocean. Tech., 27, 409–427, doi:10.1175/2009jtecha1219.1, 2010.
Tao, J. and Barros, A. P.: Prospects for flash flood forecasting in mountainous regions – An investigation of Tropical Storm Fay in the Southern Appalachians, J. Hydrol., 506, 69–89, doi:10.1016/j.jhydrol.2013.02.052, 2013.
Tao, J. and Barros, A. P.: Coupled prediction of flood response and debris flow initiation during warm- and cold-season events in the Southern Appalachians, USA, Hydrol. Earth Syst. Sci., 18, 367– 388, doi:10.5194/hess-18-367-2014, 2014.
Viviroli, D., Archer, D. R., Buytaert, W., Fowler, H. J., Greenwood, G. B., Hamlet, A. F., Huang, Y., Koboltschnig, G., Litaor, M. I., López-Moreno, J. I., Lorentz, S., Schädler, B., Schreier, H., Schwaiger, K., Vuille, M., and Woods, R.: Climate change and mountain water resources: overview and recommendations for research, management and policy, Hydrol. Earth Syst. Sci., 15, 471–504, doi:10.5194/hess-15-471-2011, 2011.
Wang, J. and Wolff, D. B.: Evaluation of TRMM Ground-Validation Radar-Rain Errors Using Rain Gauge Measurements, J. Appl. Meteorol. Clim., 49, 310–324, doi:10.1175/2009jamc2264.1, 2010.
Wilson, A. M. and Barros, A. P.: An Investigation of Warm Rain-fall Microphysics in the Southern Appalachians: Orographic En-hancement via Low-Level Seeder–Feeder Interactions, J. Atmos. Sci., 71, 1783–1805, doi:10.1175/jas-d-13-0228.1, 2014. Wolff, D. B. and Fisher, B. L.: Comparisons of Instantaneous
TRMM Ground Validation and Satellite Rain-Rate Estimates at Different Spatial Scales, J. Appl. Meteorol. Clim., 47, 2215– 2237, doi:10.1175/2008jamc1875.1, 2008.