ScholarWorks @ Georgia State University
ScholarWorks @ Georgia State University
Public Health Theses School of Public Health
Spring 5-4-2010
The Association between Female Genital Mutilation (FGM) and
The Association between Female Genital Mutilation (FGM) and
the Risk of HIV/AIDS in Kenyan Girls and Women (15-49 Years)
the Risk of HIV/AIDS in Kenyan Girls and Women (15-49 Years)
Rosemary G. Kinuthia Georgia State University
Follow this and additional works at: https://scholarworks.gsu.edu/iph_theses
Part of the Public Health Commons
Recommended Citation Recommended Citation
Kinuthia, Rosemary G., "The Association between Female Genital Mutilation (FGM) and the Risk of HIV/ AIDS in Kenyan Girls and Women (15-49 Years)." Thesis, Georgia State University, 2010.
https://scholarworks.gsu.edu/iph_theses/98
Rosemary Kinuthia
The Association between Female Genital Mutilation (FGM) and the Risk of HIV/AIDS in Kenyan Girls and Women (15-49 Years)
(Under the direction of Dr. Ike S. Okosun, MS, MPH, PhD, FRSPH and Dr. Richard Rothenberg, MD, MPH, FACP).
INTRODUCTION: Kenya like the rest of Sub-Saharan Africa continues to be plagued with high rates of AIDS/HIV. Research has shown that cultural practices have serious implications
for the spread of HIV/AIDS, as well as other communicable diseases. One of the practices that have been speculated to have an impact on AIDS/HIV is female genital mutilation (FGM). Despite efforts to eradicate the practice, prevalence of FGM in Kenya remains relatively high. Researchers have postulated that various forms of FGM may be associated with the spread of
HIV/AIDS.
OBJECTIVE: The purpose of this study is to determine the relationship between FGM and HIV/AIDS using a representative sample of Kenyan girls and women.
METHODS: Data (n=3271) from the Kenya 2003 Demographic and Health Survey was used for this study. Chi-square test was used to examine the distribution of selected risk factors across HIV/AIDS status. Odds ratios from multivariate logistic regression analyses were used to determine association between FGM and HIV/AIDS.
RESULTS: This study shows an inverse association (OR=0.508; 95% CI: 0.376-0.687) between FGM and HIV/AIDS, after adjusting for confounding variables.
DISCUSSION: The inverse association between FGM and HIV/AIDS established in this study suggests a possible protective effect of female circumcision against HIV/AIDS. This finding suggests therefore the need to authenticate this inverse association in different populations and also to determine the mechanisms for the observed association.
The Association between Female Genital Mutilation (FGM) and the Risk of HIV/AIDS in Kenyan Girls and Women (15-49 Years)
By
Rosemary Kinuthia, RN
BSN, Saint Francis University, 2006
A Thesis Submitted to the Graduate Faculty of Georgia State University in Partial Fulfillment
of the Requirements for the Degree
MASTER OF PUBLIC HEALTH Atlanta, Georgia
The Association between Female Genital Mutilation (FGM) and the Risk of HIV/AIDS in Kenyan Girls and Women (15-49 Years)
By
Rosemary Kinuthia
Approved:
Dr. Ike S. Okosun, MS, MPH, PhD, FRIPH, FRSPH Committee Chair
Acknowledgements
I would like to thank the faculty and staff of Georgia State University’s Institute of Public Health. In particular I would like to my thesis committee, Dr Ike Okosun and Dr. Richard Rothenberg for their expertise and guidance and throughout this process.
AUTHOR’S STATEMENT
In presenting this thesis as a partial fulfillment of the requirements for an advanced degree from Georgia State University, I agree that the Library of the University shall make it available for inspection and circulation in accordance with its regulations governing materials of this type. I agree that permission to quote from, to copy from, or to publish this thesis may be granted by the author or, in his/her absence, by the professor under whose direction it was written, or in his/her absence, by the Associate Dean, College of Health and Human Sciences. Such quoting, copying, or publishing must be solely for scholarly purposes and will not involve potential financial gain. It is understood that any copying from or publication of this dissertation which involves potential financial gain will not be allowed without written permission of the author.
Notice to Borrowers Page
All theses deposited in the Georgia State University Library must be used in accordance with the stipulations prescribed by the author in the preceding statement.
The author of this thesis is: Rosemary Kinuthia
2479 Peachtree Rd NE, Unit #209 Atlanta, GA 30305
The Chair of the committee for this thesis is:
Dr. Ike S. Okosun, MS, MPH, PhD, FRIPH, FRSPH Institute of Public Health
Georgia State University P.O. Box 4018
Atlanta, GA 30302-4018
Users of this thesis who not regularly enrolled as students at Georgia State University are required to attest acceptance of the preceding stipulation by signing below. Libraries borrowing this thesis for the use of their patrons are required to see that each user records here the
information requested.
NAME OF USER ADDRESS DATE
CURRICULUM VITAE
Rosemary Kinuthia
2479 Peachtree Rd NE, Unit # 209 Atlanta, GA, 30350
Education
Saint Francis University, Loretto, PA Bachelor of Science in Nursing, 2005
Georgia State University, Atlanta, GA Master of Public Health, Prevention, 2009
Professional Experience
Centers for Disease Control and Prevention, Atlanta, GA October 2009- December 2009
Student Intern
CARE, Atlanta GA July 2009- October 2009
Student Intern
Georgia State University- (Institute of Public Health) Atlanta, GA January 2009- Present
Graduate Research Assistant
Georgia State University- (International Student & Scholar Services) Atlanta, GA May 2008- July 2008
Graduate Research Assistant
Georgia State University- (College of Education) Atlanta, GA January 2008- May 2008
Graduate Research Assistant
Piedmont Hospital- (Medical Admissions Unit) Atlanta, GA October 2007- December 2007
Registered Nurse
Emory Crawford Long Hospital- (Surgical Floor & Neuro ICU) Atlanta, GA July 2006- August 2007
Registered Nurse
Honors and Awards
National Collegiate Award Recipient, 2005
Table of Contents
Acknowlegement ... iv
List of Tables ... ix
List of figures ... x
Chapters I Introduction ... 1
II Review of the Literature ... 4
III Methods and Procedures ... 27
IV Results ... 32
V Discussion and Conclusion ... 49
List of Tables
Table 2.1 Regional HIV and AIDS statistics from 2001 and 2008 ... 6
Table 2.2 Prevalence of HIV+ Men and Women Age 15-59 ... 8
Table 2.3 Percentage of women circumcised and percentage of eldest daughters age 15 and older who have been circumcised, by background characteristics. ... 15
Table 4.1 Demographic and descriptive characteristics of subjects ... 35
Table 4.2 Percentage distribution of HIV- and HIV+ women (15-49) by selected background characteristics. ... 38
Table 4.3 Percentage distribution of HIV- and HIV+ women (15-49) by selected potential HIV risk factors (marriage & sexual activity, FGM & infection/symptoms of STD’s) ... 40
Table 4.4 Percentage distribution of FGM- and FGM+ women (15-49) by selected background characteristics. ... 42
Table 4.5 Percentage distribution of FGM- and FGM+ women (15-49) by selected potential HIV risk factors (marriage & sexual activity, FGM & infection/symptoms of STD’s) ... 43
Table 4.6 Multivariable analysis of the association between selected potential HIV risk factors (marriage & sexual activity, FGM & infection/symptoms of STD’s) and HIV serostatus ... 45
Table 4.7 Multivariable analysis of the association between selected background characteristics and HIV serostatus ... 46
Table 4.8 Classification table for logarithmic odds model ... 47
Table 4.9 Multivariable analysis of the association between selected independent variables and HIV serostatus (Statistically significant variables) ... 47
List of Figures
Figure 1 HIV prevalence by Age Group and Sex ... 10
Figure 2 Prevalence of FGM in Africa and Yemen among Young Girls and Women Aged 15-49 Years ... 11
Figure 3 Illustration of the different forms on FGM ... 14
Figure 4 Illustration showing direct and indirect pathways linking FGM with HIV infection. .. 23
Figure 5 Percentage of FGM among girls and women by age group in 26 countries where these date were available ... 26
CHAPTER 1
INTRODUCTION
1.1 Background
According to the 2009 joint epidemic update report from the United Nations Program on
AIDS (UNAIDS) and World Health Organization (WHO), the total number of people living
with HIV in 2008 was 33.4 million worldwide. This number is reportedly more than 20% higher
than the number in 2000, and the prevalence was roughly threefold higher than in 1990. Out of
the 33.4 million worldwide cases, there were 2.7 million people who were newly infected in
2008. There were also 2.0 million AIDS related deaths in the same year. With these staggering
numbers, it is evident that AIDS remains a global epidemic (UNAIDS/WHO, 2009).
Sub-Saharan Africa remains the hardest hit region, accounting for 71% ofall new HIV
infections in 2008. During the same year there were 22.4 million adults and children living with
HIV compared to 19.7 million in 2001 (UNAIDS/WHO, 2009). The available evidence suggests
that HIVprevalence in Sub-Saharan Africa has stabilized and insome settings may be declining;
however data from the 2007 Kenya AIDS Indicator Survey (KAIS) indicates that HIV
prevalence in the county has been on the rise. It has increased from 6.7% to 7.4% since 2003
hence reversing the decline reported inprevious studies.
In the sub-Saharan region, HIV prevalence among adultsaged 15–49 years in urban areas
decreased from10.0% in 2003 to 8.7% in 2007, while HIV prevalencein rural areas increased
from 5.6% to 7.0%. Women and girls continue to be affected disproportionately by HIV in
sub-Saharan Africa, the number of women infected and affected by HIV and AIDS has continued to
increase over the years (UNAIDS/WHO, 2009). For example, the 2003 Kenya Demographic
was under 5 %. It also revealed that HIV prevalence rate among young girls aged between 15-
24 was 5.8% compared to 1.2 % for young men in the same age range (KDHS, 2003).
The high levels of vulnerability of women to HIV/AIDS in Kenya are associated with to
considerable gaps/inequality in education, income, employment opportunities, health, and access
to power and decision-making (Gayanza & Seager, 2005). Differences in the prevalence of HIV
rates between men and women in Kenya may also be attributed to deep entrenchment in cultural
practices (Tiessen, 2004) which may have serious implications on the spread of HIV/AIDS, as
well as other communicable diseases. One of the cultural practices thought to promote HIV
transmission is female genital mutilation (FGM). It is believed that various forms of FGM have
enhanced, and continue to enhance, the spread of HIV/AIDS among the female population (Kun,
1997 & Brady, 1999).
1.2 Purpose of the Study
The purpose of this study is to establish whether there is an association between FGM
and the risk of transmission of HIV/AIDS in Kenyan girls and women (15-49 years). An
association between FGM and increased risk of HIV infection, if established, might prove a
valuable weapon in the campaign against FGM. Numerous mechanisms whereby FGM may
enhance the risk of HIV infection are plausible, but limited data appear in the literature testing
this hypothesis. Information obtained from this study may also be used in strategy-formulation to
combat the spread of HIV among Kenyans, as well as other communities that continue to
1.3 Research Question
The study aims to address the following question:
Is there an association between FGM and the risk of acquisition of HIV/AIDS in Kenyan
girls and women (15-49 years)?
1.4 Hypotheses
From the above research questions, the following hypotheses were formulated:
Ho: There is a decreased risk of HIV transmission among Kenyan girls and women (15-49 years)
who have undergone FGM
Ha: There is an increased risk of HIV transmission among Kenyan girls and women (15-49
CHAPTER 2
REVIEW OF THE LITERATURE
2.1 Global HIV Epidemiology
The 2009 UNAIDS Epidemic Update reported that the global prevalence rate of
HIV/AIDS has continue to rise with an estimated 33.4 million people living with HIV in 2008.
Adults accounted for 31.3 million of all cases, women accounted for 15.7 million and the number
of children living with HIV was 2.1 million. It is estimated that there were 2 million
AIDS-related deaths in 2008. Although the prevalence of HIV/AIDS is on the rise, the incidence of
HIV has declined; this can be attributed to the combined effects of continued high rates of new
HIV infections and to the beneficial impact of increased availability of antiretroviral therapy
(UNAIDS/WHO, 2009).
The epidemic appears to have stabilized in most regions, although increased prevalence
due to a high rate of new HIV infections has been noted in Eastern Europe and Central Asia and
in other parts of Asia due to a high rate of new HIV infections. Sub-Saharan Africa remains the
most affected region, accounting for 71% of all new HIV infections in 2008. The resurgence of
the epidemic among men who have sex with men in high-income countries is increasingly
well-documented. Differences are apparent in all regions, with some national epidemics continuing to
expand even as the overall regional HIV incidence stabilizes. (Relief Web, 2009).
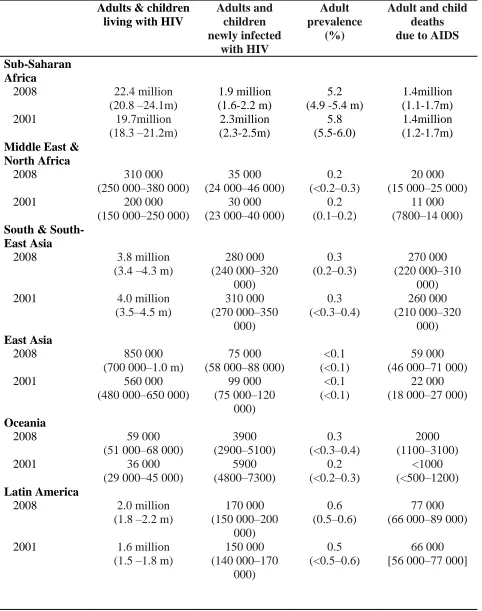
Table 2.1 Regional HIV and AIDS statistics from 2001 and 2008
Adults & children living with HIV
Adults and children newly infected with HIV Adult prevalence (%)
Adult and child deaths due to AIDS
Sub-Saharan Africa
2008 22.4 million
(20.8 –24.1m)
1.9 million (1.6-2.2 m)
5.2 (4.9 -5.4 m)
1.4million (1.1-1.7m)
2001 19.7million
(18.3 –21.2m) 2.3million (2.3-2.5m) 5.8 (5.5-6.0) 1.4million (1.2-1.7m)
Middle East & North Africa
2008 310 000
(250 000–380 000)
35 000 (24 000–46 000)
0.2 (<0.2–0.3)
20 000 (15 000–25 000)
2001 200 000
(150 000–250 000)
30 000 (23 000–40 000)
0.2 (0.1–0.2)
11 000 (7800–14 000)
South & South-East Asia
2008 3.8 million
(3.4 –4.3 m)
280 000 (240 000–320 000) 0.3 (0.2–0.3) 270 000 (220 000–310 000)
2001 4.0 million
(3.5–4.5 m) 310 000 (270 000–350 000) 0.3 (<0.3–0.4) 260 000 (210 000–320 000) East Asia
2008 850 000
(700 000–1.0 m)
75 000 (58 000–88 000)
<0.1 (<0.1)
59 000 (46 000–71 000)
2001 560 000
(480 000–650 000)
99 000 (75 000–120 000) <0.1 (<0.1) 22 000 (18 000–27 000)
Oceania
2008 59 000
(51 000–68 000)
3900 (2900–5100) 0.3 (<0.3–0.4) 2000 (1100–3100)
2001 36 000
(29 000–45 000)
5900 (4800–7300) 0.2 (<0.2–0.3) <1000 (<500–1200) Latin America
2008 2.0 million
(1.8 –2.2 m)
170 000 (150 000–200 000) 0.6 (0.5–0.6) 77 000 (66 000–89 000)
2001 1.6 million
(1.5 –1.8 m)
Table 2.1 (continued)
Adults & children living with HIV
Adults and children newly infected with HIV Adult prevalence (%)
Adult and child deaths due to AIDS
Caribbean
2008 240 000
(220 000–260 000)
20 000 (16 000–24 000)
1.0 (0.9–1.1)
12 000 (9300–14 000)
2001 220 000
(200 000–240 000)
21 000 (17 000–24 000)
1.1 (1.0–1.2)
20 000 (17 000–23 000)
Eastern Europe and Central Asia
2008 1.5 million
(1.4 –1.7 m)
110 000 (100 000–130 000) 0.7 (0.6–0.8) 87 000 (72 000–110 000)
2001 900 000
(800 000–1.1 m)
280 000 (240 000–320 000) 0.5 (0.4–0.5) 26 000 (22 000–30 000)
Western and Central Europe
2008 850 000
(710 000–970 000)
30 000 (23 000–35 000)
0.3 (0.2–0.3)
13 000 (10 000–15 000)
2001 660 000
(580 000–760 000)
40 000 (31 000–47 000)
0.2 (<0.2–0.3)
7900 (6500–9700)
North America
2008 1.4 million
(1.2 –1.6 m)
55 000 (36 000–61 000)
0.6 (0.5–0.7)
25 000 (20 000–31 000)
2001 1.2 million
(1.1–1.4 m)
52 000 (42 000–60 000)
0.6 (0.5–0.7)
19 000 (16 000–23 000)
Total
2008 33.4 million
(31.1 –35.8 m)
2.7 million (2.4 –3.0 m)
0.8 (<0.8–0.8)
2.0 million (1.7 m–2.4 m)
2001 29.0 million
(27.0–31.0 m)
3.2 million (2.9 –3.6 m)
0.8 (<0.8–0.8)
[image:17.612.68.547.84.579.2]2.1.1 Epidemiology of HIV in Sub-Saharan Africa
The Sub-Saharan region in Africa is the area that has been hardest-hit in the continent of
Africa. The UNAIDS and WHO AIDS Epidemic Update from 2009 reports that an estimated
1.9 million people were newly infected with HIV in the region in 2008 and that there a total of
over 22 million people are living with the virus in Sub-Saharan Africa. This number accounts for
71% of all new HIV/AIDS cases globally in 2008 (UNAIDS/ WHO, 2009).
Rates of the epidemic in Sub-Saharan Africa vary significantly from country to country.
The prevalence of HIV/AIDS in a growing number of countries appears to be on the decline
(UNAIDS/WHO, 2009). However, it has been noted that in the entire region of Sub-Saharan
Africa, females continue to be affected disproportionately compared to males, particularly
among the younger population. This difference is accounted for by women’s vulnerability which
arises from severe economic problems, increased biological and physiological susceptibility to
transmission of HIV/AIDS, as well as socio-cultural reasons that they are burdened by (Bradley
& Mishra, 2008).
2.1.2 Epidemiology of HIV in Kenya
Unlike the general pattern of decline observed in most other countries in the Sub-Saharan
region, there has been an increase in the prevalence of HIV/AIDS in Kenya. The KDHS results
from 2003 indicated that 7% of Kenyan adults are infected with HIV compared a previously
recorded 6.7%. Majority of HIV cases were acquired through the main mode of HIV
transmission, which is through heterosexual sex. A greater percentage of HIV cases are recorded
Table 2.2 below depicts the prevalence of HIV positive men and women age 15-59 by
[image:19.612.67.543.156.683.2]selected socioeconomic characteristics:
Table 2.2 Prevalence of HIV+ Men and Women Age 15-59
Socioeconomic characteristic % HIV positive %HIV negative %HIV positive %HIV negative %HIV
positive Number Residence
Urban 12.3 779 7.5 716 10.0 1495
Rural 7.5 2372 3.6 2135 5.6 4507
Province
Nairobi 11.9 332 18.6 835 7.9 100
Central 7.6 462 36.3 1181 12.8 244
Coast 6.6 236 20.2 667 15.4 115
Eastern 6.1 514 36.4 1325 13.6 260
Nyanza 18.3 432 35.1 1222 34.8 257
Rift Valley 6.9 747 42.8 1872 30.8 370
Western 5.8 368 4.1 927 2.0 200
North Eastern 0.0 60 98.8 168 98.8 31
Education
No education 4.4 396 58.2 1039 37.3 388
Primary incomplete 9.3 1052 32.8 2685 18.5 464
Primary complete 10.6 784 31.0 2069 17.4 373
Secondary + 8.2 918 21.0 2403 9.9 351
Employment
Currently working 9.6 1844 5.9 2007 7.6 3851
Not currently working 7.4 1307 1.5 844 5.1 2151
Wealth Quintile
Lowest 3.9 505 3.4 431 3.6 937
Second 8.5 580 4.2 501 6.5 1082
Middle 7.1 597 2.2 528 4.8 1125
Fourth 9.7 663 4.3 624 7.1 1287
Highest 12.2 806 7.3 765 9.8 1571
Ethnicity
Embu (2.8) 37 (3.7) 37 3.3 73
Kalenjin 4.9 346 2.0 366 3.4 712
Kamba 8.6 392 1.6 334 5.4 726
Table 2.2 (Continued) Socioeconomic characteristic % HIV positive %HIV negative %HIV positive %HIV negative %HIV
positive Number
Kisii 7.4 171 0.5 163 4.0 334
Luhya 7.9 481 5.1 438 6.6 919
Luo 25.8 361 17.5 341 21.8 702
Maasai 2.8 76 2.2 56 2.5 132
Meru 6.1 172 1.2 165 3.7 337
Mijikenda/ Swahili 3.8 137 3.0 116 3.5 254
Somali 0.9 100 1.8 77 1.3 177
Taita/ Taveta 11.7 41 7.1 30 9.7 71
Turkana 6.5 39 5.1 45 5.7 84
Kuria * 19 (5.2) 21 2.7 40
Other
Religion
6.7 38 5.6 41 6.1 79
Roman Catholic 8.9 800 4.9 756 6.9 1556
Protestant/ other Christian
9.2 2087 4.5 1729 7.0 3816
Muslim 2.7 204 3.1 175 2.9 378
No religion 11.1 52 5.5 185 6.7 237
Total 8.7 3151 4.6 2851 6.7 6001
Figures in parentheses are based on 25-39 unweighted cases. An asteric indicates that a figure is based on fewer than 25 unweighted cases and has been suppressed.
na = Not applicable
Note: From “Kenya Demographic and Health Survey 2003” 2004, CBS/MOH/ORC, p. 223
In Kenya, just like other Sub-Saharan countries, young girls and women account for a
greater proportion of those affected with HIV. Young women between the aged between 15-19
years have a threefold chance of being infected compared to their male counterparts while
women between the ages of 20-24 years are 5.5 times more likely to be living with HIV
[image:20.612.67.551.79.391.2]compared to men in their age cohort (UNAIDS/WHO, 2009).
Figure 1 below illustrates HIV/AIDS prevalence by age group and sex in Kenya. It is
evident from this chart that there is a great disproportion in the prevalence between males and
[image:20.612.72.544.84.390.2]Figure 1 HIV prevalence by Age Group and Sex
Note: From “Kenya Demographic and Health Survey 2003” 2004, CBS/MOH/ORC, p. 222
2.2 Female Genital Mutilation (FGM)
Female genital mutilation (FGM), also known as female genital cutting is described by
the World Health Organization as a procedure that totally or partially removes the external
female genitalia or causes other injury to the female genital organs for cultural or non-therapeutic
reasons. The practice is most prevalent in Africa especially in the northeast and on northern half
of the Sub-Saharan region.
The map below (figure 3) obtained from WHO depicts the prevalence of FGM in Africa
and Yemen among young girls and women aged 15-49 years. In the African region the highest
prevalence of FGM is observed to be in the northeast and northwest countries with rates of 75%
Figure 2 Prevalence of FGM in Africa and Yemen among Young Girls and Women Aged 15-49 Years
Note:From “Female Genital Mutilation” 2010, WHO Website:
http://www.who.int/mediacentre/factsheets/fs241/en/
2.2.1 FGM Global Statistics
It is estimated that between 100 and 140 million girls and women worldwide have been
subjected to female genital mutilation. Estimates based on the most recent prevalence data
indicate that 91.5 million girls and women above 9 years old in Africa are currently living with
the consequences of female genital mutilation. There are an estimated 3 million girls in Africa at
2.2.2 FGM History
The history and origin of FGM remains unclear. “It is believed to have originated in
Africa as far back as the fifth century B.C and has taken place in ancient Egypt, ancient Rome,
Arabia, and Tsarist Russia” (Little, 2003). The WHO reports that “currently, the practice remains
popular in western, eastern, and north-eastern regions of Africa, in some countries in Asia and
the Middle East, and among certain immigrant communities in North America and Europe”
(WHO, 2010)
2.2.3 FGM Today
In present times the practice continues to mostly be carried out by traditional
circumcisers, who often play other central roles in communities, such as attending childbirths.
Increasingly, however, FGM is being performed by medically trained personnel (WHO, 2010).
According to data from the 1998 KDHS, trained nurses are increasingly performing FGM.
During that survey 11% of girls aged 15-19 reported that they were circumcised by a trained
nurse under hygienic conditions and 27% of all reported cases of FGM were performed by
trained medical staff in hospitals (KDHS, 1998).
The World Health Organization reports that FGM is now “recognized internationally as a
violation of the human rights of girls and women. It reflects deep-rooted inequality between the
sexes, and constitutes an extreme form of discrimination against women”. The population most
affected is children and adolescents. However, in some countries infants under the age of one
year comprise a great proportion of the affected population (UNICEF). Nowadays, the practice is
integrity, the right to be free from torture and cruel, inhuman or degrading treatment, and the
right to life when the procedure results in death” (WHO, 2010).
2.2.4 Types of FGM
Toubia (1994) describes that there are four different forms of FGM, and the methods
used typically depend on the region.
Type I commonly known as clitoridectomy involves the removal of a part of the clitoris
of the whole organ.
Type II, which is classified as excision involves removal of the clitoris and part of the
labia minora.
Type III also known as intermediate infibulation involves removal of the clitoris and the
labia minora plus incision of the labia majora. It also includes the stitching of the anterior
two thirds of the labia majora.
Type IV is unclassified but is sometimes referred to as total infibulation. It involves
removal of the clitoris and the labia minora plus incision and stitching of the labia majora
to cover the urethra and entrance of the vagina, leaving a very small posterior opening for
the passage of urine and menstrual blood.
Figure 3 Illustration of the different forms on FGM
Note: From Wikimedia. Website: commons.wikimedia.org/wiki/File:FGC_Types.jpg
2.2.5 FGM Prevalence in Kenya
Kenya is home to more than 40 tribes (CIA World Factbook), and FGM is practiced in
more than 75% of the country, although the prevalence of the practice varies widely between the
various ethnic groups (GTZ, 2007). The 2003 Kenyan Demographic Health Survey (KDHS)
reported that 32% of all Kenyan women aged between 15 and 49 years are circumcised. This is
[image:25.612.145.505.72.368.2]noted to be a decline from the 1998 KDHS when it was recorded at 38%.
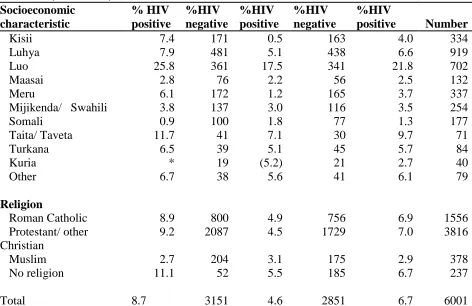
Table 2.3 below summarizes the percentage of women circumcised and percentage of
eldest daughters age 15 and older who have been circumcised, by background characteristics in
Table 2.3 Percentage of women circumcised and percentage of eldest daughters age 15 and older who have been circumcised, by background characteristics.
Background characteristic
% of women circumcised
Number of women
% of eldest daughter circumcised Number of eldest daughters Age
15-19 20.3 1856 * 0
20-24 24.8 1691 * 0
25-29 33.0 1382 * 6
30-34 38.1 1086 12.7 138
35-39 39.7 871 16.9 399
40-44 47.5 788 24.2 591
45-49 47.7 521 22.7 442
Residence
Urban 21.3 2,056 14.5 281
Rural 35.8 6,139 22.3 1296
Province
Nairobi 18.6 835 7.9 100
Central 36.3 1181 12.8 244
Coast 20.2 667 15.4 115
Eastern 36.4 1325 13.6 260
Nyanza 35.1 1222 34.8 257
Rift Valley 42.8 1872 30.8 370
Western 4.1 927 2.0 200
North Eastern 98.8 168 98.8 31
Education
No education 58.2 1039 37.3 388
Primary incomplete 32.8 2685 18.5 464
Primary complete 31.0 2069 17.4 373
Secondary + 21.0 2403 9.9 351
Religion
Roman Catholic 33.2 2067 22.8 420
Protestant/ other Christian
29.5 5322 17.7 1018
Muslim 49.6 619 44.4 105
No religion 39.6 156 (28.9) 28
Ethnicity
Embu 43.6 129 * 19
Table 2.3 (continued)
Background characteristic
% of women circumcised
Number of women
% of eldest daughter circumcised
Number of eldest daughters
Kamba 26.5 938 9.6 187
Kikuyu 34.0 1886 12.8 361
Kisii 95.9 466 95.8 91
Luhya 0.7 1230 1.1 256
Luo 0.7 984 0.9 185
Maasai 93.4 189 (93.8) 48
Meru 42.4 460 11.0 75
Mijikenda/ Swahili 5.8 407 0.7 75
Somali 97.0 298 97.5 47
Taita/ Taveta 62.1 101 * 18
Turkana 12.2 116 (14.6) 25
Kuria (95.9) 49 * 11
Other 17.6 111 * 33
Wealth Quintile
Lowest 40.0 1364 26.8 320
Second 40.4 1475 28.8 332
Middle 36.0 1503 20.9 312
Fourth 31.8 1711 13.7 342
Highest 19.1 2141 13.6 271
Total 32.2 8195 21.0 1577
Note: Total includes women with religion “other” or “missing.” Figures in parentheses are based on 25-49 unweighted cases. An asterisk indicates that a figure is based on fewer than 25 unweighted cases and has been suppressed.
Note: From “Kenya Demographic and Health Survey 2003” 2004, CBS/MOH/ORC, p. 251
Women in the rural areas represented a greater proportion (35.8%) of women who had
undergone FGM compared to 21.3% in the urban areas. North Eastern Province, which was
included for the first time in the 2003 KDHS sample, had 98.8% of females circumcised which
represented the largest proportion of women who were circumcised. Western Province, which is
mainly occupied by the Luhya ethnic group, had 4% of females circumcised; this was the lowest
[image:27.612.66.543.83.446.2]The KDHS (2003) also reported that a strong association between FGM status and level
of education was observed. Majority of women (58%) with no education reported that they had
undergone FGM, compared with only 21% of those with at least some secondary education. A
strong relationship between FGM status and religion was also noted. The survey results indicated
that one-half of Muslim women (50 percent) are circumcised compared with about one-third of
non-Muslim women.
Among the older age groups, a larger proportion of women had been subjected to FGM,
rising from 20% of women aged 15-19 to 48% of those aged between 45 and 49. This implied
that there had been a radical decline in the prevalence of the practice (by about half) over the last
two decades. A higher proportion of rural women (36%) than urban women (21%) had been
circumcised. North Eastern province included the largest proportion of circumcised women
(99%) (KDHS, 2003).
On average, women now aged between 15 and 19 were subjected to FGM at the age of
13, whereas women between 19 and 49 years were circumcised on average at the age of 15. The
age at circumcision varies between the various ethnic groups. For example, the Taita circumcise
their females as early as in infanthood while. Some ethnic groups circumcise their females as
early as infanthood, Female infants are also mutilated (among the Taita for instance), while
Somalis, Kisii and Borana conduct the practice on girls on girls under the age of 10 years. In all
2.2.6 Reasons Supporting the Practice of FGM
Cultural implications play a major role in the practice of FGM. There are many factors
that support this custom. One of the major reasons it is still practiced is religion. Muslims who
participate in FGM do so in the belief that it is part of their faith and “have pointed to traditions
of Mohammed as one source and justification for a form of FGM known as Sunnah
circumcision” (Broussard, 2008). Religion is a foundation for the beliefs of many; therefore, it is
not unusual for one to be firmly rooted in its teachings.
Another justification for the support of FGM is sociological reasons. In many cultures it
is the believed to be a rite of passage. Through undergoing female circumcision, a girl is
considered to become a woman in many of the cultures that still practice FGM. Therefore, young
girls opt to continue this custom in order not to feel left out and different from their peers.
Upholding tradition is important and breaking it is seen as taboo. Some of the cultures
that continue to have female circumcision do so because it is a tradition that has been passed on
through generations. Also, there are myths to support these traditions. For example, some
cultures believe that FGM enhances fertility and promotes child survival (Wuest et al, 2009) and
not adhering to these traditions would have adverse effects. Therefore, in order to avoid the
negative consequences, it is considered wise to embrace and maintain tradition.
Some groups continue to practice FGM for hygiene and aesthetic reasons: the external
female genitalia are considered dirty and unsightly and are removed to promote hygiene and
provide aesthetic appeal. Some cultures believe the removal prevents the accumulation of
vaginal discharge, vaginal parasites, and also prevents contamination of mother’s milk.
Removal of the clitoris or part of the clitoris by most societies that engage in FGM is a
way to insure virginity as well as prevent sexual promiscuity. Virginity is seen as a necessity for
a girl to be eligible for marriage. If discovered that a girl has been sexually active prior to
marriage it could bring shame and disappointment to the family. Hence, preserving virginity is
believed to have many benefits in the communities that continue to engage in female
circumcision (Broussard, 2008).
2.2.7 Complications of FGM
FGM is a custom that is shunned by many because of the numerous documented negative
health consequences. Serious medical complications do occur due to the nature and conditions by
which the procedure is done. Complications following FGM may be immediate or late. The
major immediate complications are, hemorrhage, shock and then infection, urinary retention and
tetanus, which can lead to death (WHO, 2010).
Some late and long-term complications seen are urinary incontinence, cysts, recurrent
urinary tract infections, pelvic inflammatory disease, infertility, and obstetrical problems such as
delayed or obstructed second stage labor, and trauma. Hemorrhage is also a late complication
especially in newly married girls who have been tightly infibulated and are subjected to forcible
sex by the husband or who the husband defibulated using various instruments such as scissors,
blades or knives (Brady, 1999).
Pelvic inflammatory disease (PID), a common complication of sexually transmitted
disease (STD) is accompanied by abdominal pain, infertility, and ectopic pregnancy. Research
indicates that PID is a major problem worldwide and in some African countries. The most
significant role in the development of PID. For the woman who has been infibulated there are
added risks of infection and resulting infertility (Brady 1999).
It has been reported that “chronic pelvic disease is three times more prevalent in
infibulated women…Chronic retention of urine, menstrual flow, and repeated urinary tract
infections with E. coli are the consequences of poor drainage, which results from a space formed
behind the vulva skin. This then becomes an excellent reservoir for the growth of pathogenic
organisms such as the E. coli” (Brady, 1999).
A research study from Brady’s 1999 paperreported a study in which a high incidence of
candiasis (yeast infections) in women who had undergone FGM and urine cultures showed the
presence of mixed organisms, specifically E. coli. It is suggested the three main causes of PID in
the infibulated woman, are: “(1) infection at the time of infibulation, (2) interference with
drainage and (3) infection from splitting the infibulation and resulting resuture after labor. The
infections then spread to the inner reproductive organs causing infertility” (Brady 1999).
Another long-term effect of FGM is infertility. Brady reports that after female
circumcision, sexual intercourse is generally difficult and the process of deinfibulation is painful
and can take 2-12 weeks to complete or even up to 2 years during which time the women seek
medical help for infertility. It is estimated that a fair percentage of the cases of infertility in
communities practicing FGM are due to infibulation, either as a result of chronic pelvic infection
or because of difficulty in having sexual intercourse and lack of penetration. In these societies
the psychological and social impact of being sterile must be profound because a woman's worth
is frequently measured by her fertility, and being sterile can be cause for a divorce (Brady,
There are many obstetrical complications associated with FGM, for the mother and
fetus/baby. Some of the main complications are “delayed second-stage labor, perineal tearing,
vesicovaginal fistula, and low birth weight babies…It has been reported that some pregnant
women reduce their dietary intake to avoid giving birth to large babies. The obstetrical
management for those patients is important and often difficult for those that have not had this
type of exposure” (Brady, 1999).
For the above reasons, female circumcision is one of the major public health issues that
needs to be addressed. It is therefore evident why the WHO reports that “FGM has no health
benefits, and it harms girls and women in many ways. It involves removing and damaging
healthy and normal female genital tissue, and interferes with the natural functions of girls' and
women's bodies”. Thus, efforts continue to be made in order to eradicate female circumcision.
The negative psychological effects could include feelings of terror, anxiety, humiliation,
and betrayal that may lead to long-term behavioral characteristics such as docility, feelings of
incompleteness and depression. It has also been frowned upon especially when assessed from the
“Western” perspective, which is typically viewed as the dominant culture. However, not all
effects of FGM are viewed as negative, particularly in places where the practice is part of the
ancient culture of the people. In fact, in such societies, women who have not undergone this
“essential” rite of initiation may suffer from psychological problems due to fear of rejection by
the society and feelings of inferiority. Those women who have undergone FGM experience
2.2.8. FGM & HIV
It has also been postulated that FGM may directly or indirectly play a role in the
transmission of HIV in Kenya. K.E.Kun proposed 4 hypothetical mechanisms by which female
circumcision could result in an elevated risk of HIV infection:
i. FGM may result in infection and scarring which causes introital narrowing ranging from
complete to partial occlusion of the vagina. Therefore, women are at greater risk of
inflammation/ bleeding during intercourse. Consequently, FGM may be contributing to
more efficient HIV transmission as disruption to the genital epithelium and exposure to
blood during sexual intercourse appear to enhance the risk of infection.
ii. Female circumcision reduces the vaginal opening therefore penetration is difficult and
painful, hence increased practice of anal intercourse, which has been shown to enhance
the efficiency of HIV transmission
iii. Mutilated women are reported to be at greater risk of hemorrhage in childbirth because of
obstructed labor and tearing of perineal scar tissue. This leads to higher risk of blood
transfusion with blood supply may not be optimally screened for HIV.
iv. The use of unsterilized instruments in the performance of FGM may also increase the risk
of HIV transmission. Knives and blades used may be contaminated with blood since
multiple females may be simultaneously mutilated with a single unsterilized instrument.
In addition, because FGM raises the social status of the parents, the dowry demands can be
high and therefore the young girls can be married off to older men who are already infected
(Brady, 1999).
Although little evidence exists, it has also been argued that female circumcision has a
decreased risk of HIV (Stallings et al, 2005 & Kanki et al, 1992). Yount and Abraham (2007) in
their article propose that women who participate in the practice of FGM are more likely to follow
the approved set of gender guidelines for the community and are thereby less likely to engage in
sex before marriage and extramarital affairs.
The nature of the procedure also has likelihood to increase discomfort for females during
sexual intercourse, (Campbell, 2004) therefore severely cut women may be less sexually active
due to pain associated with the act. Because FGM has the potential to decrease the frequency of
sexual intercourse, it can thereby be postulated that it could lead to a decreased risk of HIV
transmission because “coital frequency is positively associated with HIV infection” (Yount &
[image:34.612.169.465.401.610.2]Abraham 2007).
Figure 4 below summarizes the direct and indirect pathways linking FGM with HIV
infection.
H1- FGM directly enhances transmission H2- FGM indirectly enhances transmission H3-FGM indirectly “protects” against transmission
Figure 4 Illustration showing direct and indirect pathways linking FGM with HIV infection.
2.2.9 FGM International Response
The importance of religion, rite of passage, tradition, hygiene and health, insurance of
virginity and chastity, in the cultures that still practice FGM cannot be overlooked. In the minds
of the people who adhere to this belief, the benefits gained from this far outweigh any potential
danger, (Broussard, 2008) however these individuals lack proper understanding of the issue.
As an international response to this issue, in 1997 the World Health Organization (WHO)
issued a joint statement with the United Nations Children’s Fund (UNICEF) and the United
Nations Population Fund (UNFPA) against the practice of FGM stating:
"Even though cultural practices may appear senseless or destructive from the standpoint
of others, they have meaning and fulfill a function for those who practice them. However,
culture is not static; it is in constant flux, adapting and reforming. People will change
their behavior when they understand the hazards and indignity of harmful practices and
when they realize that it is possible to give up harmful practices without giving up
meaningful aspects of their culture”.
Since 1997 when the joint statement was issued, there have been great efforts to counteract
FGM, through research, work within communities, and changes in public policy. Progress at
both international and local levels includes:
Wider international involvement to stop FGM;
The development of international monitoring bodies and resolutions that condemn the
practice; revised legal frameworks and growing political support to end FGM; and
In some countries, decreasing practice of FGM, and an increasing number of women and
Research shows that, if practicing communities themselves decide to abandon FGM, the
practice can be eliminated very rapidly (WHO, 2010)
WHO efforts to eliminate female genital mutilation focus on:
Advocacy: developing publications and advocacy tools for international, regional and
local efforts to end FGM within a generation;
Research: generating knowledge about the causes and consequences of the practice, how
to eliminate it, and how to care for those who have experienced FGM;
Guidance for health systems: developing training materials and guidelines for health
professionals to help them treat and counsel women who have undergone procedures.
WHO is particularly concerned about the increasing trend for medically trained personnel
to perform FGM; it strongly urges health professionals not to perform such procedures.
Efforts to ban FGM are proving to be successful in some areas. According to UNICEF,
the prevalence of FGM has declined slowly but steadily during the past 15 years. As depicted in
figure 5 below, older girls and younger women are less likely to have experienced any form of
Figure 5 Percentage of FGM among girls and women by age group in 26 countries where these date were available
Note: From “Protecting against Abuse, Exploitation &Violence: Female Genital
Mutilation” UNICEF Website:
http://www.unicef.org/progressforchildren/2007n6/index_41847.htm
This lowered prevalence of FGM/C may reflect the impact of legislation, policy changes
at the national level and actions at the community level (UNICEF). 0
10 20 30 40 50 60
45-49 40-44 35-39 30-34 25-29 20-24 15-19 Age groups
CHAPTER III
METHODS AND PROCEDURES
3. 1 Source of Data
Data for this study was obtained from the 2003 Kenya Demographic Health Survey
(KDHS) which is the latest in a series of national level population and health surveys to be
carried out in Kenya in the last three decades. The 2003 KDHS information is intended to assist
policymakers and program implementers to monitor and evaluate existing programs and to
design new strategies for demographic, social, and health policies in Kenya. The survey collected
data on demographic and health issues from a sample of women in the reproductive ages (15-49)
and from men age 15-54 years in one-in-two sub-sample of households selected for the male
survey (KDHS, 2003). For purposes of this study only data collected from women was used.
3.2 Sample Design & Questionnaire
The 2003 KDHS included Kenya household residents. A representative probability of
close to 10,000 households participated in the survey. The selected sample was constructed to
provide separate estimates for key indicators for each of Kenya’s eight provinces as well as for
rural and urban areas separately.
A two-stage sample design was used for the 2003 KDHS. Stage 1 selected sample points
from a national master sample which was maintained by the fourth National Sample Survey and
Evaluation Program (NASSEP IV). The list included 400 clusters of which 129 were urban and
the remaining 271 were rural. Stage 2 selection involved the systematic sampling of households
50 selected clusters in the largest cities due to the high rate in structures and household
occupancy in urban areas (Measure DHS, 2003).
Only the Women’s Questionnaires from the 2003 KDHS was used for this study.
3.3 Variables
The dependent variable used for this study was HIV serostatus (whether HIV positive or
negative).
Potential Confounders included:
FGM
Circumcision status
Demographic characteristics
Age
Residence
Province
Education
Religion
Ethnicity
Wealth Quintile
Marriage and sexual activity
Marital Status
Number of wives of husband/partner
Age at sexual debut
Condom use at last sexual intercourse
Symptoms of infection or sexually transmitted diseases
Had STD in last 12 months
Genital sore or ulcer in last 12 months
Bad smelling abnormal discharge in last 12 months
3.4 Characteristics of Survey Respondents
3.4.1 Gender
Respondents’ gender was coded as male or female based on interviewer’s observation. Coding
choices included “male” or “female”. However dataset for this study included females only.
3.4.2 Age
Participants’ age in years were obtained from the questions “In what month and year were you
born?” and “how old were you at your last birthday?” After comparison of the answers,
inconsistencies were corrected. In this study, age was categorized into 15-19, 20-24, 25-29,
30-39, and 40-49 groupings based on previous studies among Kenyan population.
3.4.3 Region of Residence
Region of residence for the participants was coded as either “urban” or “rural”.
3.4.4 Province
The respondent’s area of residence included the 8 provinces of Kenya which include: Nairobi,
Figure 6 Illustration of the 8 Kenyan provinces and the distribution of ethnic groups within the country
Note: From Google Images. Website:
http://bp0.blogger.com/_FJfDH4ti8qg/R6AdQEymuyI/AAAAAAAAAp0/bJ4FoHs4GV8 /s1600-h/KenyaEthnicDistribution.gif
3.4.5 Educational Achievement
Education attainment was coded either as “no education”, “primary incomplete”, “primary
complete”, “secondary incomplete”, “secondary complete”, “more than secondary”.
3.4.6 Religion
Participants indicated which religion they identified with and responses were recorded as
3.4.7 Ethnicity
Participants were asked to select which of the 14 major ethnic groups they belong to. Choices
included: “Embu”, “Kalenjin”, “Kamba”, “Kikuyu”, “Kisii”, “Luhya”, “Luo”, “Maasai”,
“Meru”, Mijikenda/ Swahili”, “Somali”, “Taita/Taveta”, “Turkana”, “Kuria”, and if they did not
belong to any of the listed ethnic group there was a choice of “other” which was assigned to
participants from ethnic groups that represented small sample sizes.
3.4.8 Wealth Quintile
Wealth quintile was determined from the questions inquiring about employment status,
occupation, and earnings. Responses were categorized as “lowest”, “second”, “middle”, “fourth”
and “highest”.
3.4.9 Marital Status
Respondents were asked about their marital status using the questions: “Have you ever been
married or lived with a woman/man?” and “What is your marital status now: are you widowed,
divorced, or separated?” Answers were coded as “never married”, “married”, “living together”,
“divorced/separated” or “widowed”.
3.5.9 HIV Status
Participant’s human immunodeficiency virus (HIV) status was determined after
participants voluntarily consented to testing. The testing protocol was reviewed and approved by
Prior to collecting blood for HIV testing, informed consent was obtained from the
participants and the health worker explained the procedure, confidentiality of the data and the
fact that test results could not be traced back to or be made available to the subject; the health
worker also provided respondents with information on how they could obtain results of the HIV
test though VCT services.
Once consent was obtained, blood spots were collected from finger pricks onto filter
paper and transported to the CDC laboratory at KEMRI headquarters in Nairobi for testing.
Samples were tested with Enzygnost Anti-HIV-1/2 Plus enzyme-linked immunosorbent assay
(ELISA) test, and then retesting of all positive and 10 percent of negative tests with a
Vironostika HIV-1 MicroELISA system. 29 discrepant samples were then finally tested by the
INN-OLIA HIV Western blot kit for confirmation.
3.5 Statistical Analysis
All statistical analyses were performed using SPSS 17.0.
Chi-square test was used to examine the distribution of selected risk factors across HIV/AIDS
status and FGM status.
Odds ratios from multivariate logistic regression analysis were used to determine association
between FGM and HIV/AIDS.
A p-value and 95% confidence interval was used to establish statistical significance.
3.7 Human Subjects Consideration
The Georgia State University Institutional Review Board (IRB) approved exempt status for the
identifiers was used. The data used was from the 2003 KDHS and permission to use the data was
CHAPTER IV
RESULTS
4.1 Characteristics of the Study Population
After merging the women’s data set with the HIV dataset and deletion of respondents
who did not consent to HIV testing well as those participants whose HIV serostatus was
undetermined, the sample size for this study was 3,271.
As shown in table 4.1, all participants were females between the ages of 15 and 49.
Young girls and women between the ages 15-24 years represented almost half (43.3%) of the
sample. Over half of the respondents (60.7%) were married/living with a partner, 28.8% had
never been married, and the remaining respondents were widowed, separated, or divorced. 30%
of the respondents resided in an urban area while 70% resided in a rural area.
The proportion of respondents who had no education was 15.7% while a large majority
(53.2%) of the sample had received the primary level of education. 23.4% had completed
secondary school however, a small population of only 1.1% had been educated to the university
level.
The majority of study participants (87.1%) belonged to a Christian denomination group
including Roman Catholics, Protestants and other Christian groups. The remaining were either
Muslims (10.9%), belonged to another religion not mentioned above or belonged to no religion.
In terms of ethnic affiliation, Kikuyu respondents account for 23% of the study
population, and are followed approximately in order of size by the Luhya, Luo, Kamba, and
Provinces with the highest number of participants were Rift Valley, Central, Nyanza, and
Western with 17.3%, 16.0%, 14.2%, and 13.6%, respectively. The province with the least
amount of participants came from North Eastern (4.6%).
Over one fourths of respondents (46.8%) were categorized in the rich and richest
categories. 18.3 % were classified as middle class and the remaining 34.9% were either in the
[image:46.612.68.571.264.712.2]poor or poorest categories.
Table 4.1 Demographic and descriptive characteristics of subjects
Characteristics n (3271) Percentage (%)
Age
15-19 732 22.4
20-24 684 20.9
25-29 536 16.4
30-34 468 14.3
35-39 356 10.9
40-44 293 8.9
45-49 202 6.2
Marital status
Never married 941 28.8
Married 1802 55.1
Living together 182 5.6
Widowed 136 4.2
Divorced 45 1.4
Not living together 165 5.0
Residence
Urban 981 30
Rural 2290 70
Province
Nairobi 355 10.9
Central 522 16.0
Coast 384 11.7
Eastern 382 11.7
Nyanza 465 14.2
Rift Valley 567 17.3
Western 444 13.6
North Eastern 152 4.6
Education
No education/preschool/nursery 513 15.7
Primary 1741 53.2
Table 4.1 (continued)
Characteristics n (3271) Percentage (%)
Secondary 765 23.4
College 170 5.2
University 37 1.1
Religion
Roman Catholic 776 23.7
Protestant/ other Christian 2074 63.4
Muslim 357 10.9
No religion 54 1.7
Other 6 0.2
Ethnicity
Embu 28 0.9
Kalenjin 287 8.8
Kamba 314 9.6
Kikuyu 752 23.0
Kisii 208 6.4
Luhya 531 16.2
Luo 357 10.9
Maasai 67 2.0
Meru 143 4.4
Mijikenda/ Swahili 220 6.7
Somali 200 6.1
Taita/ Taveta 59 1.8
Turkana 42 1.3
Kuria 22 0.7
Other 41 1.3
Wealth Quintile
Poorest 557 17
Poorer 585 17.9
Middle 598 18.3
Rich 639 19.5
Richest 89.2 27.3
4.2 The Distribution of Selected Demographic Risk Factors across HIV/AIDS Status
Tables 4.2 shows the results of the chi square test which was conducted in this study to
examine the percentage distribution of selected risk factors across HIV/AIDS status. Out of the
total number of women used for this study 8.4% were HIV positive.
A comparison of HIV positive and HIV negative participants shows that majority of HIV
[image:47.612.73.570.86.531.2]within the age range of 20-34 years. The highest concentration of HIV positive individuals was
between the ages of 25-29 (22.9%) compared to 14.5% of HIV negative individuals in the same
age category.
Area of residence and region of origin were also statistically significant risk factors for
HIV status. HIV positive subjects were 42.2% more likely to reside in an urban area versus
28.9% of HIV negative participants. 29% HIV positive individuals were from Nyanza province
versus 12.9% who were HIV negative.
With regard to education, compared with HIV negative women, the HIV positive women
were more likely to be educated up to the primary school level (62.6% versus 52.4%). However,
HIV positive women were also less likely to have been educated at the university level compared
to their HIV negative counterparts (0.7% versus 1.2%).
Religion also played a role; HIV positive women were more frequently non-Roman
Catholic Christians (69.5% compared to 62.9%). The ethnic group with the greatest proportion of
HIV positive females was the Luo (34.2%) and the smallest proportion was among the Kuria
(0.0%). HIV positive study subjects were more likely to be categorized into the highest wealth
Table 4.2 Percentage distribution of HIV- and HIV+ women (15-49) by selected background characteristics.
Characteristics HIV- (%) HIV+ (%) p-value
Age <0.001
15-19 23.6 9.1
20-24 20.9 21.1
25-29 15.8 22.9
30-34 13.8 19.6
35-39 10.5 14.5
40-44 8.9 9.5
45-49 6.4 3.3
Residence <0.0001
Urban 28.9 42.2
Rural 71.1 57.8
Province <0.001
Nairobi 10.5 14.2
Central 16.1 14.2
Coast 11.9 9.5
Eastern 11.9 8.7
Nyanza 12.9 29.1
Rift Valley 17.7 13.1
Western 13.8 11.3
North Eastern 5.1 0.0
Education 0.002
No education/ preschool 16.5 7.3
Primary 52.4 62.6
Post-primary/ vocational 1.4 1.5
Secondary 23.4 22.9
College 5.2 5.1
University 1.2 0.7
Religion 0.001
Roman Catholic 23.6 25.8
Protestant/ other Christian 62.9 69.5
Muslim 11.6 3.3
No religion 1.7 1.5
Other 0.2 0.0
Ethnicity <0.001
Embu 0.9 0.4
Kalenjin 9.1 4.7
Kamba 9.6 9.8
Kikuyu 23.4 18.5
Kisii 6.5 5.1
Luhya 16.4 14.9
Table 4.2 (continued)
Characteristics HIV- (%) HIV+ (%) p-value
Maasai 2.1 1.1
Meru 4.5 2.9
Mijikenda/ Swahili 7.0 3.3
Somali 6.6 0.4
Taita/ Taveta 1.7 2.5
Turkana 1.3 0.7
Kuria 0.7 0.0
Other 1.2 1.5
Wealth Quintile <0.001
Poorest 18.0 6.9
Poorer 18.0 16.4
Middle 18.6 15.3
Rich 19.2 23.3
Richest 26.3 38.2
An analysis similar to the one above was also conducted however independent variables
examined included marital status, sexual activity and FGM status & signs/symptoms of STDs.
The results in table 4.3 show that HIV positive individuals were less likely to be married (48.7%)
compared to HIV negative individuals (55.7%), more likely to have a co-wife (23.3% versus
16.1%), more likely to be circumcised (74.7% versus 64.8%).
HIV positive females had a greater likelihood (5.5%) of having had genital sores or
ulcers in the last year, compared to 1.6% in HIV negative subjects, more likely (5.8%) to have
experience genital discharge in the past year compared to 2.5% and more likely to have been
diagnosed with an STD (2.5% versus 1.3%).
HIV positive women were less likely to have used a condom during their last sexual
encounter (92.2% versus 94.9%) and also more likely to have had more than one sexual partner
[image:50.612.71.534.80.311.2]Table 4.3 Percentage distribution of HIV- and HIV+ women (15-49) by selected potential HIV risk factors (marriage & sexual activity, FGM & infection/symptoms of STD’s)
Characteristics HIV- (%) HIV+ (%) p-value
Marital status <0.001
Never married 30.0 15.3
Married 55.7 48.7
Living together 5.4 7.3
Widowed 3.2 14.9
Divorced 1.3 2.2
Not living together 4.4 11.6
Number of co- wives 0.004
None 80.8 74.7
1 or more 17.5 23.3
Don’t know 1.8 1.9
Circumcision status <0.001
No 64.8 77.8
Yes 35.2 22.2
Genital sore/ ulcer in last 12 months <0.001
No 98.2 94.5
Yes 1.6 5.5
Don’t know 0.2 0.0
Genital discharge in last 12 months 0.004
No 97.3 94.2
Yes 2.5 5.8
Don’t know 0.2 0.0
Condom use during last intercourse 0.094
No 94.9 92.2
Yes 5.1 7.8
Had any STD in last 12 months 0.197
No 98.3 96.7
Yes 1.3 2.5
Don’t know 0.4 0.7
# of sex partners in last 12 months 0.001
0 30.0 20.4
1 68.5 75.9
2 1.4 3.3
4.3 The Distribution of Selected Demographic Risk Factors across FGM Status
Tables 4.4 and 4.5 show the results of the chi square test which was conducted in this
study to examine the percentage distribution of selected risk factors across FGM status. Out of
the total number of women used for this study 34% of the women reported that they had
undergone FGM.
In comparison to women who hadn’t undergone FGM, circumcised women were more
likely to be categorized as older and between the ages of 30-49, reside in rural areas (78.4%
compared to 65.7% in rural areas) and more likely to live in Rift Valley, Nyanza, and Central
provinces (23.0%, 17.3%, and 17.1% respectively).
Women who had undergone FGM were more likely to have received no form of
education (29.4% versus 8.5% in uncircumcised women) and more likely to be of Muslim
religion (19.2% versus 4.3%).
Majority of circumcised women were from the Somali, Kisii, Maasai and Meru ethnic
groups, they were also categorized in the poor and poorest grouping categories (23.1% and
22.9% versus 13.9% and 15.7% respectively) compared to uncircumcised females. The rich were
less likely to practice circumcision (33.5% versus 15.2%).
Compared to uncircumcised women, females who had undergone FGM were more likely
to be married (65.7% versus 49.5%), more likely to have a co-wife (19.7% versus 16.8%). They
are also less likely to have reported having a genital ulcer (1.1% versus 2.3%), less likely to have
reported having had genital discharge (1.8% versus 3.3%), slightly less likely to have been
diagnosed with a STD in the past 12 months (1.3% versus 1.5%), and more likely to be HIV
negative (94.5% versus 90.1%). In comparison to uncut women, circumcised females were less
are also more likely to have had more than one sex partner in the past 12 months (77.4% versus
[image:53.612.67.545.169.712.2]64.9%).
Table 4.4 Percentage distribution of FGM- and FGM+ women (15-49) by selected background characteristics.
Characteristics FGM- (%) FGM + (%) p-value
Age <0.001
15-19 26.6 14.3
20-24 22.9 17.0
25-29 16.3 16.3
30-34 12.8 17.2
35-39 9.5 13.5
40-44 6.7 13.3
45-49 5.0 8.4
Residence <0.001
Urban 34.3 21.6
Rural 65.7 78.4
Province <0.001
Nairobi 13.7 5.3
Central 15.4 17.1
Coast 13.9 7.4
Eastern 10.5 14.0
Nyanza 12.6 17.3
Rift Valley 14.4 23.0
Western 19.5 2.2
North Eastern 0.0 13.6
Education <0.001
No education/preschool 8.5 29.4
Primary 54.2 51.2
Post-primary/ vocational 1.4 1.3
Secondary 27.4 15.8
College 6.8 2.2
University 1.7 0.1
Religion <0.001
Roman Catholic 24.0 23.4
Protestant/ other Christian 67.8 55.2
Muslim 6.6 19.2
No religion 1.4 2.2
Other 0.2 0.1
Ethnicity <0.001
Embu 0.8 1.0
Kalenjin 6.5 13.3
Kamba 10.3 8.3