54
Chapter
7
Estimation of Ground Rod Depth for Effective Performance during Installation in
Different Soil Types in Ibadan, South
–
West Nigeria
Adegoke J.A1, Fakunle M.A2,a,Aseweje I F1
1
University of Ibadan
2
Osun State University
a
Abstract. Poor or high resistance connection to the ground is one of the leading cause of earthng system failure.
The resistivity of the soil and the depth to which an earthing electrode is driven directly affects the design and
performance of a grounding system and it’s a major factor that determines the Earth resistance of the grounding
electrode. To achieve a reasonably low resistance connection to the ground, it is pertinent to carried out geophysical investigation to determine the variation of resistivity of layers below the surface and the earth resistance of the grounding rod prior to earthing system installation for optimization of rod driving depth. The
survey areas cover Botany and Agricultural Departments University of Ibadan with coordinates N 7o 26ʹ58.4ʺ
E 3o 53ʹ 47.9ʺand N 7o 26ʹ54.6ʺ, E 3o 53ʹ44.1ʺrespectively and Nigeria Corporation Clay Mining Site, Omi
Adio with coordinate N 7o 25ʹ 48.1ʺE 3o 44ʹ 47.2ʺ. A total of nine (9) Schlumberger Vertical Electrical Sounding
(VES) (three VES for each location) was carried out using Geo pulse Tigre Resistivity meter. Earth resistance for grounding electrode was calculated for each geological layer of all the VES points within the survey sites, taking into account the resistivity and the depth of each lithological unit. The calculated results was compared with the
standard (10Ω) of a single rod to determine the depth of an earthing rod. Soil moisture content and particle size
was carried out. The VES results showed that the second lithological layers of VES 1,
2, and 3 of Botany and Agricultural department of University of Ibadan had resistivity and depth ranged from
14.5 to 25.1Ωm and 2.9 to 4.5 m; 19.8 to53.1 Ωm and 5.6 to 9.8m respectively while the resistivity and depth
of the second lithological layer for VES 1 and 2 of Omi Adio were 8.6Ωm, 7.7Ωm and 4.5 m, 6.9 m respectively
and that of the third lithological layer was 11.5Ω m. Moisture contents results of Omi Adio, Agricultural and
Botany Department ranged from 0.125 g/ g to 0.35 g/g, 0.020 g/g to 0.0869 g/g and 0.0465 g/g to 0.117 g/g respectively The particle size analyses results revealed that the topsoil of Omi Adio, Botany and Agricultural Departments as Clay, Sandy loam and Sand respectively. The recommended depth of Omi Adio, Botany and Agricultural Departments ranged from 2.3 to 6.9m, 2.9 to 4.5m and 5.6 to 9.8m respectively.
Keywords: Earth resistance, earthing systems, geophysical investigation, vertical electrical sounding.
I.
Introduction
Grounding is the control of abnormal voltages or currents through the proper application of Ohm’s law (John
55
The main objective of power system earthing is to provide a common voltage reference and low impedance fault current path to allow the protection system to reliably clear abnormal of fault conditions while limiting the grid voltage rise and transferring earth potentials to tolerable limits. To achieve this, a suitable low resistance connection to earth is crucial which often depends on factors such as soil resistivity, stratification, size and type of electrode used, depth to which the electrode is buried, moisture and chemical content of the soil. Grounding connection is accomplished by driving ground electrode into the earth. An earth electrode is a metal rod, metal pipe or metal conductors electrically connected to the Earth. The materials generally used for earth electrodes can be made of copper, aluminums, mild steel and galvanized iron. Out of all these materials copper is the most preferable material for earth electrodes because of its high conductivity and resistance to corrosion.
Dwarka et al., (2012) described the earth as a place of zero potential, a place where fault current can be directed to enable fuses to rupture. Buildings, Distribution transformers, lightning conductors that are found on tall buildings, etc. are all connected to the earth so that in the event of lightning strike, the current passes harmlessly to the ground and not into the structures or buildings, thus saving the buildings from damage. The magnitude of the fault current and its distribution in the soil and neutral conductors are of a prime importance to design safe grounding installation (Dawalibi, 1980). The ability of an earth electrode to conduct current effectively into the soil (earth) depends on the resistivity of the soil and the depth to which this electrode is buried (Gabriel et al.,
2011) Most National and International Lighting Protection codes require an earth resistance of 10 Ω to be
provided for a lighting protection installation (BSEN 2006, AS1991). According to ( ), soil resistivity
measurements have a threefold purposes. First, such data is used to make sub- surface geophysical surveys and as an aid in identifying ore locations, depth to bedrock and other geological phenomena. Secondly, resistivity has a direct impact on the degree of corrosion in underground pipelines (a decrease in resistivity relates to an increase in corrosion activity and therefore dictates the protective treatment to be used) and thirdly, soil resistivity is the key factor that determine what resistance of a grounding electrode will be and to what depth it must be driven to obtain low ground resistance. The resistivity of the soil varies widely throughout the world and changes seasonally. Soil resistivity is determined by its content of electrolytes, which consist of moisture minerals and dissolved salts, hence electrical resistivity method can be used to determine soil resistivity. A dry soil has high resistivity if it contains no soluble salts. Soil resistivity varies with moisture content, temperature and depth. Since soil resistivity directly relates to moisture content and temperature, it is reasonable to assume that the resistance of any grounding system will vary throughout the different seasons of the year.
Since both temperature and moisture content become more stable at greater distances below the surface of the earth, it follows that for a grounding to be most effective at all times, should be constructed with the ground rod driven down to a considerable distance below the surface of the earth. Best results are obtained if the ground rod reaches the water table. Hence, geophysical investigation of resistivity of subsurface soil layers combined with soil properties such as texture and water content at the intended site will also provide information of the soil conditions at the survey areas and for determination of the depth to which an earthing rod could be installed to achieved low resistance connection to the earth for effective dissipation of current via grounding electrode into the ground. This work aimed at estimating the depth to which an earthing rod could be buried in different soil types.
II.
The Study Areas
The study areas selected for this work were Botany and Agricultural Departments of the University of Ibadan with
coordinates N 7o 26ʹ58.4ʺE 3o 53ʹ47.9ʺand N 7o 26ʹ54.6ʺ, E 3o 53ʹ44.1ʺrespectively and Nigeria Corporation
Clay Mining Site, Omi Adio in Ido local government area with coordinate N 7o 25ʹ48.1ʺE 3o 44ʹ
47.2ʺ. Germin e – trex Geographic Positioning System (GPS) meter was used to determine the location and
56
Sokoto Ibom 20 20 L.G.A EAST WEST L.G.A. 4 BE NI N RE PU BL IC KA JO LA L.G .A ON AR A L.G .A SU RU LE RE L.G .A BE N IN RE PU BL IC BE NIN RE PU BL IC KA JO LA L.G. A ONAR A L.G. A SU RU LERE L. G.A N 8 10 402.1. Geology of The Study Area
For meaningful interpretation of resistivity data, the knowledge of the geology of the study area is essential. The parent rock underlying an area largely influences the subsurface properties of the soil within the area. Ibadan is on the Precambrian basement complex of Nigeria, it is underlain by igneous and metamorphic rocks with few intrusions of granite rock. The University of Ibadan campus is underlain mainly by migmatite gneiss which is a mixed rock comprising of banded gneiss, augen gneiss and quartzite/quartz schist. Apart from augen gneiss that is well exposed, others are not so conspicuous except in localized areas in which case, they have weathered considerably. Omi Adio in Ido local government Ibadan is underlain by migmatite gneiss. The survey site at Omi Adio is the Nigeria corporation clay mining site. The residual clay deposit is derived from intense weathering of the migmatite gneiss rich in feldspar mineral.
Kebbi Zamfara Katsina KanoJigawa Yobe Borno Oyo State Niger Kwara Ekiti Kogi Kaduna FCT Nassarawa BauchiGombe Adamawa Plateau Taraba
Map Of Oyo State Showing the Study Area Ogun
Osun
Ondo Borno
and Associated Local Government Areas. Lagos Edo Enugu
3°00'
25 3°30' 4°00' 4°30'
NIGER2I A0
7028’00” 30 Iddo
9°30' 9°30'
OYO STATE W E S
IREPO L.G.A
Delta Imo Abia Calabar
Bayelsa Rivers
Akwa-10 10 40 12 9°00'
ORELOPE SAKIL.G.A
1
9°020'
20 30 8°30'
EAST SAKI WEST L.G.AL.G.A
40
L250
L36OR5IRE 10 ATIBAL.G.A 8°30'
7026’00”30 60 L1 30 16
8°00' ATISBO L.G.A IWAJOWA L.G.A ITESIWAJU L.G.A L.G.A OYO
OGO 8°00' Legend
30 20
25 IBARAPA25
WEST ISEYIN L.G.A L.G.A AFIJIO OYO EAS T OLUWA
L.G. A Study Area
Iseyin L.G.A
25 NORTHSTUDY AREA
L.G.A. IDO
L.G.A
AKINYELE Ibarapa East L.G.A
IBARAPA
IBARAPAL. G.A
L.G.A
L.G.A Map Of Oyo State Showing the Study Area
CENTRAL L.G.A 2045’ 3000’ 3015’ 3030’ 30
45’ 40
00’ 40
1 5’ 40
30’
25 22 EGBEDA 25 and Associated Local Government Areas.
7024’00” 20 25
L.G.A O
L.G.A OLUYOL E
L.G.A Nigeria 9000’ 9°30' 3°00' 3°30' 4°00'
Irepo 4°30'
NIG ER I A
OY O STAT E N
9°30'
W E 9000’
7°00' 7°00'
50 S
OrelopeIREP O
9°00' 9°00'
40 Omi 70 3°00' 3°30' 4°00' 4°30' 8045’
Saki East OR EL OP E
SAK IL.G.AOlorunsogo 8045’
40 25
25
20 15 55
6 20 30
50 0 50 100 Kilometers
8030’ Saki East 8°30'
SAK I WE ST L .G.AL.G.A
ATI SB O L.G.A ITE SI WA JU L.G.A
I WA JO WA L.G.A OR IR E ATIB AL.G.A L.G.A
OY O Orire 8°30'
Legend 8030’
7022’00” Atisbo8°00' ISEY INAtibaOYO
OGO
OLUWA 8°00'
0 2km
IBAR APA ItesiNwORaTHju L.G.A
STUDY AREA L.G.AEASTL.G.A AFI JI O L.G.A AKINYELE
Ogbo Stu dy A rea Is ey in L.G.A8015’ Ibara pa Eas t
IBARAPAEASTIDOL.G.ALA GELU L.G.A
7°30' IB AR APAL.G.AL.G.A L.G.A N.7°30' Ibara pa N orth
8000’ Iwajowa Kajola CE NTR AL L.G.A OG UN STA TE
EGBE D A L.G.A
OLUY OL E Ogbo SSurulere
L.G.A State Bo und ary Nigeri a8000’
LEGEND 7°00'
Iseyin OyoL.G.A WestOyo East
Ogo Oluwa 7°00'
Bs Biotite-Garnet -Schist and Approximated Geological Boundary Railway Line 7045’ 50 0 50Afiji1o00 Kilometers
70 45’
Biotite-Garnet-Gneiss
GGh Hornblende-Biotite-Garnet-Gneiss Geological Boundary UncertainFaultline assumed RiverDam
3°00'
Ibarapa NorthIbarapaEast 3°30' 4°00'
Akinyele 4°30'OSUN
STATE
Q Quartzite and Quartz Schist
Su Undifferentiated Gneiss Complex
20 Plunge of minor fold and lineation
55 Strike and Dip Sampling Point
L1 Omi 7030’ LEGEND Ibarapa Central Ido Lagelu
5 132Ona AraEgbeda
LEGEND
1 Ibadan North LGA 2 Ibadan N.E. LGA
703 0
Probably mainly Schist
M Migmatite Gneiss Mylonite zoneRoad L2 Agric Farm
L3 Botany
7015’ International boundary State boundary LG boundary
Study area Kilomete rs Oluyole
3 Ibadan S.E. LGA 4 Ibadan S.W. LGA 5 Ibadan N.W. LGA
7015’
2045’ 3000’ 3015’ 3030’ 3045’ 400 0’ 401 5’ 4030’
Solovicool concept08034866052, 08061267143
57
2.2. Theoretical BackgroundVariation in the resistivity of Earth materials either vertically or laterally produces distortion to the applied current and potential distribution measured on the surface. The purpose of electrical resistivity surveys is to determine the resistivity distribution of the sounding soil volume. In electrical resistivity method artificially generated electric currents are supplied to the soil and the resulting potential differences are measured. Potential difference patterns provide information on the form of subsurface heterogeneities and their electrical properties (Kearey et al., 2002). The current flow line distributions depend on the soil medium under investigation, they are concentrated in conductive volumes.
In electrical resistivity prospecting, four electrodes are usually employed. Two of these electrodes are used to supply a controlled electrical current to the ground, the developed potential is then measured using the second pair of electrodes. Deviations from the pattern of potential difference expected from homogeneous ground provide information on the form and electrical properties of subsurface under probe. The arrangement of these electrodes is shown in Fig.2. Where A and B are the current electrodes which act as source and sink respectively. C and D measured the potential difference between A and B. The apparent resistivity of the soil
layer is calculated using
2 2
ρa = π V ( − ) (1)
58
Fig.2: General four electrode configuration for resistivity measurement, consisting of a pair of current
electrodes (A, B) and a pair of potential electrodes (C, D).
III.
Methodology
A total of nine Vertical Electrical Sounding (VES) points using Schlumberger electrode configuration was carried out to determine the variation of subsurface resistivity with depth in the study area. Data were acquired with a digital resistance meter (Geo pulse Tigre) using a maximum current electrode spacing (AB/2) of 32 m. The field data was processed by plotting the variation of resistivity with increasing current electrode spacing on a bi logarithmic paper. The layered model obtained serve as an input into the computer using WIN RESIST 1.0 software for an inversion algorithm and later subjected to repeated iterations until a satisfactory fit to the field data was obtained
A total of forty – five (45) undisturbed soil cylindrical core samples (15 cm long ×7cm in diameter) (five
samples from each VES point) were retrieved from the surface horizon of each VES points at 0–15, 15–30,
30-45, 45-60 and 60-75 cm depths to determine the moisture content in the three surveyed areas. Gravimetric water
content (θw) of the samples was determined as the ratio of the mass of water in the soil sample to the mass of
the oven dried soil (g/g).
The Earth resistance for a vertical rod of diameter 20mm and 25mm specification was calculated for each lithological unit of the VES points within the survey sites taking into account the resistivity and the depth of each lithological unit. The resistance to earth for a grounding rod driven into the soil was calculated for each lithological unit of the survey sites using the formulae for calculating the resistance to earth for a single vertical rod given by Chow et al. (1996) and Energy Networks Association (2003). The formula is given by:
8L
R
g
2
L
ln
d
1
(2)Where Rg is the earthing resistance of the vertical rod (Ω), ρis the resistivity of the soil or geological layer (Ωm),
L is the length of rod/strip (m), d is the diameter of the rod. The layer resistivity obtained from the soil model was substituted into equation 2, the depth of each geological layer represents the effective depth to which the electrode is to be buried, the obtained resistance to earth of an electrode for each lithological layer was
compared with standard to determine the layer suitable for earthing electrode and to what depth the electrode must
be driven to achieve the desired earthing resistance of 10Ωwhich is the standard or less with a single rod inserted
59
IV.
Results and Discussions
4.1. Supplier Selection
The percentage of sand silt and clay from the analysis of soil samples retrieved from the topsoil of survey areas is presented in table 4. The particle size analyses indicate the topsoil of Omi Adio, Botany and Agricultural department as clay, sandy loam and sand respectively.
The moisture content of soil samples retrieved from Omi Adio, Agricultural and Botany department ranges
from 0.125 g/g to 0.35 g/g, 0.020 g/g–0.0869 g/g, 0.0465 g/g–0.117 g/g, respectively.
4.2. Curve Characteristics
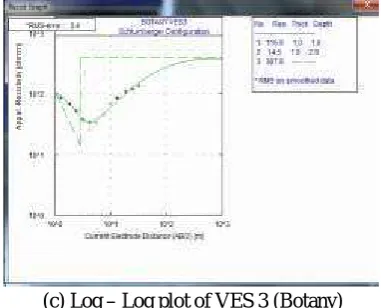
Fig. s 3, 4 and 5 show the typical geo electric curves corresponding to VES data from Botany and Agricultural Departments and Omi Adio study areas respectively. Curve types identified are H and K types. The H type is most predominant constituting 88.8 % of the curves observed from the survey areas, the signature of the curve indicates that the resistivity falls to a minimum then increases again, this is due to an intermediate layer that is a better conductor than the top and bottom layer (Lowrie, 2007). The type K curve constitutes 22.2% of the curves from the study areas. The signature of the curve indicates that the resistivity rises to a maximum then decreases again which implies that the intermediate layer is highly resistive than the top and bottom layer.
4.3. Geo electric and Lithological Characteristics
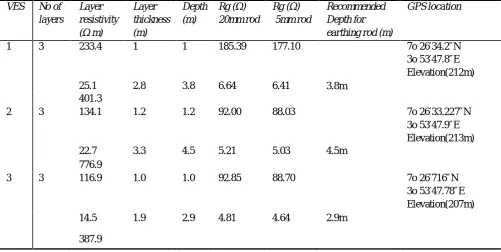
Table 1 shows the geo electric parameters and the calculated resistance to Earth of an electrode for each
lithological unit at Botany sampling site. The resistivity of the topsoil ranges from 134 Ω m to 233 Ω m, the
calculated resistance to Earth of an electrode ranges from 177Ω to 185 Ω for VES point 1, 88 Ωto 92 Ω for
VES point 2 and VES point 3 which is extremely higher than the required value of 10Ω, the moisture content
[image:6.595.50.552.486.738.2]obtained from the laboratory analysis of the soil samples retrieved from the topsoil is low implying low conductivity, this will also affect the effectiveness of an earthing system.
Table 1: Geoelectric parameters and electrode earth resistance Botany ves points
VES No of
layers
Layer resistivity (Ωm)
Layer thickness (m)
Depth (m)
Rg (Ω)
20mm rod
Rg (Ω)
5mm rod
Recommended Depth for earthing rod (m)
GPS location
1 3 233.4
25.1
1
2.8
1
3.8
185.39
6.64
177.10
6.41 3.8m
7o 26′34.2″N 3o 53′47.8″E Elevation(212m)
401.3
2 3 134.1 1.2 1.2 92.00 88.03 7o 26′33.227″N
22.7 3.3 4.5 5.21 5.03 4.5m
3o 53′47.9″E Elevation(213m)
776.9
3 3 116.9 1.0 1.0 92.85 88.70 7o 26′716″N
3o 53′47.78″E Elevation(207m)
14.5 1.9 2.9 4.81 4.64 2.9m
60
Based on this, the first layer is not proposed for earthing rod installation because it may not adequately
discharge current to the subsurface. The resistivity value of the second lithological layer ranges from 14.5Ωm
to 25 Ω m indicating a highly conductive medium, the corresponding value of the calculated resistance to the
Earth of an electrode ranges from6.4 Ωto 6.5 Ωfor VES point1, 5 Ωto 5.2 Ωfor VES point2 and 4.6 Ω to4.8
Ωfor VES point 3 which is within the required value implying that an earthing rod buried within the second layer
will dissipate charges effectively. Therefore an earthing rod should be driven to the second layer to a depth 3.8 m at VES 1, 4.5 m at VES point 2 and 2.9 m at VES point 3 of the survey area. Fig. 3a to 3c shows the geo electric section of Botany Department VES points, the geological sequence suggest that the subsurface is characterized sand, clay and partly weathered basement with varying resistivities and thicknesses.
(a) Log–Log plot of VES 1 (Botany). (b) Log–Log plot of VES 2 (Botany).
[image:7.595.77.297.211.384.2](c) Log–Log plot of VES 3 (Botany)
Fig 3.The geo electric section of Botany VES points
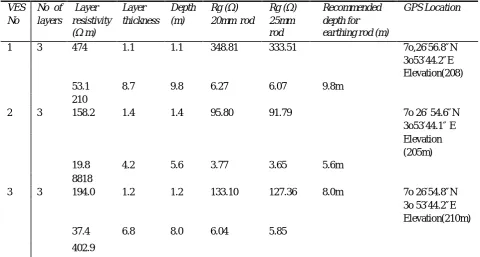
Table 2 shows the geo electric parameters and the calculated resistance to Earth of an electrode for each
lithological unit at Agricultural Department sampling site. The resistivity of the topsoil ranges from 158.2Ω m
to 474Ωm, the corresponding resistance to Earth of an electrode ranges from: 333Ωto 348Ωat VES point 1,
91Ωto 95 Ω atVES point 2 127Ωto 133Ωat VES point 3 which is extremely higher than the required value
[image:7.595.208.399.420.574.2]61
Table 2: Geoelectric parameters and electrode earth resistance for Agricultural ves points
VES No
No of layers
Layer resistivity
Layer thickness
Depth (m)
Rg (Ω)
20mm rod
Rg (Ω)
25mm
Recommended depth for
GPS Location
(Ωm) rod earthing rod (m)
1 3 474 1.1 1.1 348.81 333.51 7o,26′56.8″N
3o53′44.2″E
53.1 8.7 9.8 6.27 6.07 9.8m
Elevation(208)
210
2 3 158.2 1.4 1.4 95.80 91.79 7o 26′54.6″N
3o53′44.1″E
19.8 4.2 5.6 3.77 3.65 5.6m
Elevation (205m)
8818
3 3 194.0 1.2 1.2 133.10 127.36 8.0m 7o 26′54.8″N
37.4 6.8 8.0 6.04 5.85
3o 53′44.2″E Elevation(210m)
402.9
4a: Log - Log plot of VES 1 (Agricultural) Fig.4b: Log - Log plot of VES 2 (Agricultural)
4c: Log - Log plot of VES 3 (Agricultural)
Based on this, the first layer is not proposed for earthing rod installation because it may not adequately
discharge current to the subsurface. The resistivity value of the second lithological layer ranges from 19.8Ωm
to 53.1 Ωm indicating a conductive medium, the corresponding value of the calculated resistance to the Earth
[image:8.595.80.532.242.641.2]62
[image:9.595.319.523.164.289.2]VES point 3 which is within the required value implying that an earthing rod buried within the second layer will dissipate charges effectively to the subsurface via the rod. Therefore earthing rod should be driven to the second layer to a depth 9.8 m at VES point 1, 5.6 m at VES point 2 and 8.0 m at VES point 3 of the survey area.
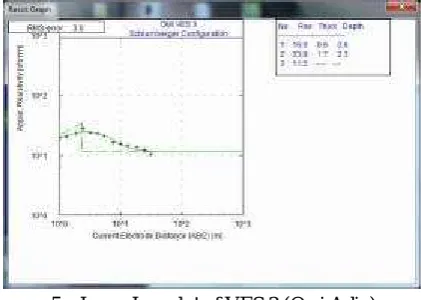
Fig. s 5a to 5c shows the geo electric section of Omi Adio VES points, which suggest that the subsurface is characterized by clayey medium with varying resistivities and thicknesses.
5a: Log–Log plot of VES 1 (Omi Adio) 5b: Log–Log plot of VES 2 (Omi Adio)
[image:9.595.200.411.322.472.2]5c: Log–Log plot of VES 3 (Omi Adio)
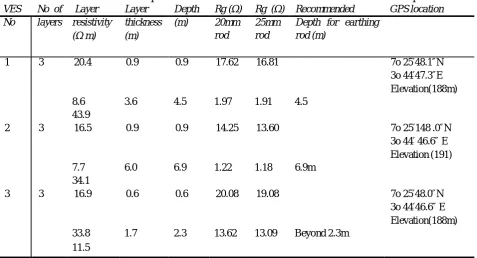
Table 3 shows the geo electric parameters and the calculated resistance to Earth of an electrode for each
lithological unit at Omi Adio sampling site, the resistivity of the topsoil ranges from 16Ωm to 20Ω m and the
calculated resistance to Earth for an electrode at the topsoil ranges from 16Ωto 17Ωat VES point 1, 13 Ωto
14Ωat VES point 2 and 19 Ω to 20Ωat VES point 3 of Omi Adio, which is above 10 Ω. Based on this, the
first layer may not enhance the performance of an earthing rod in dissipating current to the subsurface and hence not suggested for earthing rod installation. The second lithological layer at the survey site has resistivity
value ranging from 8Ω m to 33.8Ω m implying a highly conductive medium, the corresponding resistance to
Earth of an electrode is below 2Ωat VES point 1 and VES point 2 which indicates that an earthing rod buried
within the second layer will dissipate charges effectively to the subsurface via a grounding rod and therefore suggested for earthing rod installation. Hence an earthing rod should be driven to the second layer to a depth 4.5 m at VES point 1, and 6.9 m at VES point 2 of the survey area. It was observed that the moisture content obtained from the laboratory analysis of the soil samples retrieved from this sampling site is high which will also
enhance the performance of the earthing system. The resistivity (33.8Ωm) of layer 2 at VES point 3 is higher
than the resistivity (11.5 Ω m) of the third layer, the second layer may not be the most suitable for burying
63
Table 3: Geoelectric parameters and electrode earth resistance for Omi Adio ves points
VES No
No of layers
Layer resistivity (Ωm)
Layer thickness (m)
Depth (m)
Rg (Ω)
20mm rod
Rg (Ω)
25mm rod
Recommended Depth for earthing rod (m)
GPS location
1 3 20.4 0.9 0.9 17.62 16.81 7o 25′48.1″N
3o 44′47.3″E Elevation(188m)
8.6 3.6 4.5 1.97 1.91 4.5
43.9
2 3 16.5 0.9 0.9 14.25 13.60 7o 25′148 .0″N
3o 44′46.6″E Elevation (191)
7.7 6.0 6.9 1.22 1.18 6.9m
34.1
3 3 16.9 0.6 0.6 20.08 19.08 7o 25′48.0″N
3o 44′46.6″E Elevation(188m)
33.8 1.7 2.3 13.62 13.09 Beyond 2.3m
11.5
Table 4: Result of particle size analysis.
LOCATION APROXIMATED PERCENTAGE OF SOIL SEPARATE TEXTURAL CLASS
SAND %
SILT % CLAY %
OMI ADIO 22 14 64 CLAY
AGRIC 92 1.8 6.2 SAND
BOTANY 60 12 18 SANDY LOAM
V.
Conclusion
A three layer model of VES data yields significant result for earthing systems design at the survey area, the result of the geophysical investigation shows that the second lithological layer which comprises of a highly conductive medium will enhance dissipation of charge from an earthing electrode, and hence suggested for an earthing rod installation. Based on qualitative interpretation of VES data, it was deduced that the second
lithological layer with resistivity of 8.6Ωm and corresponding depth of 4.5 m (VES point 1), resistivity of 7.7
Ωm with depth of 6.9 m (VES point 2) at Omi Adio; resistivity of 25.1Ω m with depth of 3.8 m ( VES point
1), resistivity of 22.7Ωm with depth of 4.5m (VES point 2), resistivity of 14.5Ωm with depth of 2.9m ( VES
point 3 ) at Botany sampling site; resistivity of 53.1Ωm with depth of 9.8 m (VES point 1), resistivity of 19.8
Ωm with depth of 5.6 m (VES point 2), resistivity of 37.4Ωm with depth of 8.0 m ( VES point 3) at Agricultural
64
References
[1]. Australian lightening protection standards, NZS/AS1768-1991. 68 and 69
[2]. British standard EN62305 (2006)‘Protection against Lightening Parts 1-4
[3]. Chow Y. L., Elsherbiny M. M. and Salama M. M. A., (1996). Resistance formulas of grounding
systems IEEE Transactions on Power Delivery, 11 1330-1336
[4]. Dawalibi F. P. (1980). Ground Fault Current Distribution between Soil and Neutral conductors.
IEEE Transactions on Power Apparatus and Systems. 99 (2). 452-457.
[5]. Dwarka P. and Sharma H.C., (2012).Soil Resistivity and Earthing System. Inte rnational Journal Of
Management, IT And Engineering (2) (9), pp.369–380
[6]. Energy Networks Association, 2003. Engineering Recommendation S34 1986. A guide for
assessing the rise of earth potential at substation sites. (Engineering Directorate; Energy Net works Association; London).
[7]. Gabriel A.A and Kehinde, O.O. (2012). Assessment of soil resistivity on grounding of electrical
systems .Journal of Academic and Applied Studies Vol. 1(3) September 2011, 28 -38
[8]. Kearey, P., Brooks M., and Hill I., 2002. An introduction to geophysical exploration. Blackwell Scientific publication, Oxford. England.
[9]. Lowrie, W., (2007). Fundamentals of Geophysics 2nd Edition. Cambridge university press (4).252
–276
[10]. Reynolds, J.M., (1997). “An Introduction to Applied and Environmental Geophysics.”John Wiley
and Sons. New York. 796.
[11]. Scollar I. Tabbagh A., Hesse, A., Herzog, I., (1990). Archaeological Prospecting and Remote Sensing. 674 (10).