III. RESEARCH METHOD
This chapter describes the research design, population and sample, data collecting
techique, research procedure, reseach schedule, criteria of good test, level of
difficulty, descrimination power, scoring system, data analysis, and hypothesis
testing.
3.1 Research Design
This research was conducted in order to find out a difference of students’
vocabulary before and after being taught through picture sequence and to
investigate the students’ activities in teaching learning process using Picture
Sequence media . In conducting this research, the researcher used one group
pretest posttest design (Hatch and Farhady, 1982:20). Pretest and posttest was
administered to see whether Picture Sequence can be used to improve student’s
vocabulary.
This research used one class. The class had both pretest and posttest and three
time treatments. The design could be illustrated as follows:
T1 X T2
X : Treatment ( Picture )
T2 : posttest (Hatch and Farhady, 1982 : 20 )
3.2Population and Sample
The population of this research was the students at class VIII of SMPN 1 Abung
Tinggi Lampung Utara. There were four classes of class VIII. Each class consists
of 30 students.The researcher took two classes, VIII A as try out class and VIIID
as experimental class. In this research, the researcher used simple random
probability sampling, by using lottery (Setiyadi, 2006:39).
3.3Data Collecting Technique
In collecting the data, the researcher used the following technique :
3.1.1 Try – out
Try – out test was intended to assess the quality, i.e. the reliability and validity, of
the instument used for data collection. In constucting the tryout test was multiple
choice. The number of the test items were 40 with four options and of answer for
each (A, B, C, D ) and time alloction was 90 minutes.
3.1.2 Pre Test
The researcher gave the pre test to the students’. The purpose of the test was to
know how far students’ vocabulary mastery before given the treatment. The
researcher carried out aspects the sampling of data. The students which the pre
1.1.3 Treatment
In this occasion, the researcher applied the media. The reseracher gave three time
treatments to the experimental class through picture sequence.
3.1.4 Post Test
The researcher administrated the post test after giving the treatment to know the
result at the end of the research. Post test could be given after the students’ get
materials. Which accordance with material is to explained by their teacher. Post
test material was the same with pre test . With the post test, the students’ easier
than express the ideas.
In this research, ther researcher choose content word ( noun, verb, adjective )
because all which were the things that the students find in their daily life, so it was
very important to know the English of those things. The material was about daily
activities. The material was selected in English book for grade VIII students of
Junior High School.
3.1.5 Questionnaire
Questionnaire consists of a list of questions to gather data from the respondents.
In this case, the respondents are second grade students of SMPN 1 Abung Tinggi.
The respondents were asked to answer all the questions. Questionnaire was used
to find out the students’ problem in teaching vocabulary using picture sequence as
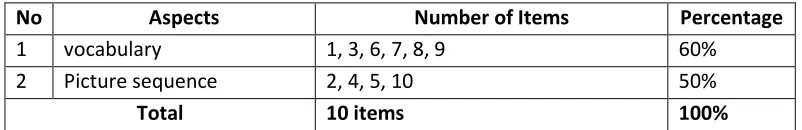
media. This questionnaire consists of 10 questions including questions about
vocabulary and picture sequence teaching media. It could be seen in this
Table 1. Specification of Questionnaire
No Aspects Number of Items Percentage
1 vocabulary 1, 3, 6, 7, 8, 9 60%
2 Picture sequence 2, 4, 5, 10 50%
Total 10 items 100%
3.4 Research Procedures
In collecting the data, the researcher carried out the following procedures which
can be described as follows:
1. Selecting and Determining The Materials
The materials were based on the School Based Curriculum (KTSP) 2006 for the
second year students. The materials were taken from the text book and internet.
The researcher used one type of vocabulary mastery through picture sequence.
2. Determining the Research Instrument
These instruments of this research were vocabulary test and questionnaire.
Vocabulary test consisted of 30 items with four alternative answers for each, they
are A, B, C or D which consist of one the correct answer and the rest were the
distracters.
3. Administering Questionnaire
Questionnaire was used to find out the students’ problem in teaching vocabulary
understanding the vocabulary especially in three aspects of vocabulary and what
is their respond in vocabulary teaching learning process.
4. Analyzing the result of the Test
Both of the pretest and posttest result of the class was analyzed using repeated
measured T-Test to compare the data average score (mean) of both pretest and
posttest in one sample (Hatch and Farhady, 1982:114). It was tested in order to
find out whether there is a difference in students’ vocabulary mastery after being
taught by picture sequence.
3.5 Research Schedules
In order to gain the regularity and avoid irregularity in doing all the research
procedures, the researcher made a time schedule for experimental class in one
[image:5.595.114.482.517.688.2]week
Table 2. The Schedule of The Research
NO Meeting Type of Action
1. September,16,2013 Administering Try Out
2. September,20,2013 Administering pre-test
3. September, 23,2013 Treatment 1
4. September,27,2013 Treatment 2
4. September,30,2013 Treatment 3
3.6 Criteria of Good Test
Whenever a test or other measuring device is used aspect of the data collection
process. There are four criteria of a good test, namely, validity, reliability, level
of difficulty, and discrimination power.
Validity
The data validity of very important to get the data and information that
responsible of the test. There are five validities of data, they are face validity,
content validity, predictive validity, construct validity and democratic validity.
The researcher used content validity for the related test was given. The researcher
analyzed each test. The test to measure the material presented, the test must be
suitable the indicator. The data validity is very needed to get the data and
information that can be responsible of the truth. There are five validities, they are
face validity, content validity, predicative validity ,construct validity and
democratic validity.
In this case, the researcher used vocabulary that suppossed to be comprehended
by the second year students based on the curriculum. To know the whether the test
has good validity ; the term of test was discussed with the expert and the
colleagues ( The researcher classmate and English teacher of SMPN 1 Abung
Table 3 of specification of the try – out test
No. Word classes
Number of Item Percentage
1. 2. 3. 1. Noun Verbs Adjectives
2,6,7,9,16, 18, 27,31, 33, 34, 37, 38, 39, 40
1,3,4,5,10,
11,12,13,14,17,19,20,21,22,23, 24, 25,26,28, 29, 30
8,15,32,35,36
30%
60%
10%
Jumlah 100%
Constuct validity examines whether the test actually in line with the theory, it
means that whether the test is in line with the school curriculum. In this research,
the researcher used the vocabulary that is supported to be comprehended by the
first year students Junior High School. The material was under topic of daily
activity which was representative of vocabulary material based on the curriculum
used in Junior High School.
Reliability
Based on the validity of data above the researcher determined reliability.
Reliability is a tool measure by different time for same subject, but gave the same
result. Stability reliability is relation with consistent of product the test given.
Knowing reliability is given minimum twice for subject in different time. So,
correlative both of result, it is named test retest. Reliability can be means can be
Hatch and Farhady ( 1982 : 243) say that reliability of a testa can be difined as a
extent to which a test produced consistent result when administer under similar
conditions. In order to estimate the reliability of the test, the research will used
splithalf technique and to measure the coeficient of the reliability between odd
and even group, this research used “ The Person Product Moment Formula “ as
follows :
rI = ∑
∑ ∑
Where :
rI : Coeficient of reliability between old and even number items
x : Odd number
y : Even number
∑ : Total score of odd number item
∑ : Total score of even number items
∑XY : Total number of odd and even number
( Lado : 1961 in Hughes, 1991 : 32 )
The criteria of reliability are :
0.80 – 1. 00 : Very high
0.50 – 0.79 : Moderate
0.00 – 0.49 : Low
The research used “ Spearmen Brown Formula “ to know the coeficient
correlation of whole items.
The formula is as follows :
rk = 2rI
1 + r1
Where :
rk : Reliability of a full test
rI : Reliability of half test
The criteria of the reliability are :
0.90 – 1.00 : High
0.50 – 0.89 : Moderate
0.00 – 0.49 : Low
( Hatch and Farhady, 1985 :247 )
A try out test was carried out before conducting the pre test and post test. This test
was administered in order to detremine the quality of the test that consisted of 40
items. After analyzing the data, the researcher got that 30 items meet the criteria
of good test, 4 items should be revised, and 10 were bed and should be drooped.
The result of the reliability was 0.97 ( appendix 12 ) . by referring to the criteria
of the reliability proposed by Hatch and Farhady ( 1982 : 268), the test has high
reliability in the range 0.9000 – 1.00. It indicated that this instrument would
produce consistent result when administered under similar condition to the same
3.7Level of Difficulty
To see the level of difficulty, the researcher used the following formula:
LD =
Where :
LD : level of diffficulty
R : number of students who answer correctly
N : the total number of students following the test
The criteria are :
<0.30 : difficult
0.30 – 0.70 : average
.0.70 : easy
[image:10.595.107.485.481.623.2]( Shohamy, 1989:79)
Table 4. The Difficulty Level Of The Try Out Test
No Number of item Computation Criteria Decision
1 <0.30 Difficult Dropped
2 1,2,4,5,7,8,10,12,13,14, 15,17,18,19,20,21,22,2 3,25,26,27,29,31,32,33, 35,37,38,39,40
0.30-0.70 Average Administered
3. 3,6,9,11,16,24,28,30,34 ,36
>0.70 Easy Dropped
Based on the result of the try out test related to the criteria, it could be inferred
that there were ten items had the result more than 0.70 ( see table ). It means that
0.30 ( see table ). So, there was no difficult item. Mean while, 30 average items
were administered to be reference for the pre test and post test ( see table ) . the
result of the difficulty level of the try out test shown on appendix.
From the computation of level difficulty (see appendix 9), the researcher found
that there were 4 item which are less than 0.30. It means those items were
difficult. There were 6 items which are higher than 0.70. It means that the items
were easy and 30 items were average (030- 0.70 )
3.8Descrimination Power
To see the discrimination power, the researcher used the following formula:
DP =
½ !
(shohamy, 1985:81)
The criteria are:
1. If the value is positive, it has discrimination because a large number of more
knowledgeable students than poor students get the item correct if the value is
zero. It means no discrimination.
2. If the value is negative, it has negative discrimination because more low-level
students than high level students get the item correct.
3. In general, the higher discrimination index, the better, in the classroom
situation most items should be higher than 0.20 indexes
From the computation of discrimination power (see appendix 10) the researcher
found that there were 1 bad items ( has negative value discrimination ), 9 items
were poor ( has less than 2.00 index ) and 30 items were satisfactory ( has higher
than 2.00 index). In general, it could be concluded that all items tested had good
discrimination power and positive value since a larger knowledgeable student than
poor students got the item correct.
From the result of try out test, 30 items which met the criteria of a good test were
administered in pre test and post test. The researcher changed the numbers of
arragement of the items in pre test, reaarranged the texts also put the choices
randomly in order to use the items in post test. This was an attempt to made sure
that the increase of students’ vocabulary mastery or not because they got the same
test in pre test but because of the treatments
3.9 Scoring System
In scoring students result of the test, this research used Arikunto’s formula. The
idea higher score was 100. The score of pretest and posttest were calculating by
using
formula as follow ;
S = R
N
Where :
S : The score of the test
R : The total of the right answers
3.10 Data Analysis
After conducting pretest and posttest, the researcher analyzed the data. It was used
to know whether the students use the media for vocabulary mastery of the second
year at SMPN 1 Abung Tinggi through picture sequence
The researcher examined the student’s score using the following steps :
1. Scoring the pretest and posttest
2. Tabulating the score of the student’s vocabulary test result using repeated
measures T- test. The formula manually was as follows :
"#$$$ – "2$$$$ In which &' = &'
SD √)
Where :
"#
$$$ : Mean of the pretest
"2
$$$$ : Mean of the posttest
&' : Standard error of differences between two means ( denominator)
SD : Standard deviation
N : number of students
( Hatch and Farhady, 1982 : 116 )
In this research, the researcher used statistical computerization
3. Drawing conclusion from the tabulated result of the pretest and posttest
administering, that is statistically analyzed using SPSS ( Statistical
Program for Social Sciences ) in order to test whether increase of the
3.11 Hypothesis Testing
In the line with data analysis above, the researcher formulated the hypothesis as