An Accurate and Cost Effective Approach to Blood Cell
Count
Sanaullah Khan
Department of Electrical Engineering, Comsats Institute of Information Technology Wah Campus, WahCantt. Pakistan.Aamir Khan
Department of Electrical Engineering, Comsats Institute of Information Technology Wah Campus, WahCantt. Pakistan.Faisal
Saleh Khattak,
Arslan Naseem
Department of Electrical Engineering, Comsats Institute of Information Technology Wah Campus, WahCantt. Pakistan.ABSTRACT
Medical imaging brings up the methods and technique which enable us to take and analyse images of different disease and human body parts for diagnosing purposes. The old conventional methods used in hospital laboratories to detect and diagnose the problem were very slow and they had greater chances of error in it but medical imaging through different image processing techniques opened new, fast and cost-effective ways to detect and recognize different diseases and make it easy to examine and diagnose the actual problem. Now a day's researchers are working on different computer vision applications for health industry. Such as segmentation of kidney from ultrasound images, Cancer Detection Using Pattern Recognition Technique, segmentation of brain images, etc.
Fast and cost-effective blood cell counting has major importance in the medical world. The old conventional methods of blood cell counting under the microscope render unreliable and unacceptable results and put an unendurable amount of strain on the Clinical laboratory technicians. Even so there are latest hardware solutions such as the Heska'sHema'true hematology analyzer, but they are widely unavailable and very expensive machines and so the under developed countries like Pakistan are not resourceful to provide such an expensive solution of blood cell counting in every hospital laboratory in the country. As a solution regarding this problem, this research based paper proposed a fast and cost effective software-based alternative method to count accurate blood cells.
1.
INTRODUCTION
Here in this research based project we proposed a software base solution related health industry which will assist the medical laboratory technician (MLT) to detect and find a blood cell count and produce an accurate cell count report. This would be very helpful to a physician in identifying the cause of his patient’s diseases. To count the blood cells in a clinical laboratory different two methods and techniques are used. One is the old conventional method of cell counting under the microscope and the other is to produce cell counting report by latest but very expensive haematology analyzer. But both these methods haveits own different drawbacks and limitations.
1.1
Limitations withExisting Methods
The main problem with the method of counting manually under the microscope is accuracy, this method needs a real experienced laboratory technician who is trained enough to produce an accurate cell counting report, and even if the laboratory technician if well trained and experienced still weone cant neglect the chance of error in the report due to error caused by apparatus, personal errors, statistical errors etc.
While on the other hand latest haematology analyzer somehow error free and fast but it is widely unavailable and very expensive machine and the countries like Pakistan are resource less to provide it in every hospital laboratory in country. So as a result of the problem this research based project proposed a new method of cell counting which is easy to use, don't need fully experienced men to handle, much more accurate then the manually counting method and is very economical way of cell counting for the countries like Pakistan.
1.2
Importance of the Project
The Dengue and malaria fever is very common now days in south Asia and specially in Pakistan. In Pakistan the dengue virus infected over 30,000 peoples (only in Punjab) in summer 2011. Blood related viruses are very common in south Asia the most highlighted among them are Dengue and malaria, dengue fever is also known as break bone fever, when a dengue virus infected mosquito bites a human the virus along the mosquito saliva enter the skin of the person. This deadly virus then enters into the white blood cell of the patient and infected the cells, it damages the cell and its functionality and spread in the whole. Initially this virus can be detected in the laboratory by investigating low white blood cell count, which then leads to very low platelets (PLT) count ratio [1], and so blood test was the most common test to be diagnosed in the clinical laboratories
2.
LITERATE REVIEW
An analysis of blood was exercised from far back to ancient times. All three blood cell types performs its own role in healthy men's life and so count of different cell type of blood can identify different diseases that's the reason that complete blood cell count is the most common test carried out in all clinical laboratories. Different techniques were practiced since the discovery of blood cells in 1658. Before going into details of modern blood cell counting methods we should know the history of cell counting and the developments in the technology of cell counting which was finally implemented to quantification of the ingredients of blood
2.1
Hematology
2.2
History of Cell counting
Leeuwenhoek was the first person who attempted to count blood cells using a glass capillary tube with graduation marks of measured dimension and microscope to count. He selected chicken to count red blood cells [3]. Afterwards, different techniques were introduced for diluting the blood which resulted in more accurate and easier counting using a shallow rectangular chamber which had a thin cover glass and diluted blood was injected into this glass. In the early 20th century a technique using photoelectric device to count cells was invented by Moldovan [4]. However, this attempt for cell counting did not develop at that time because of the unreliability of the photoelectric device. An automated blood-cell counter technique was invented by Waiter H. Coulter [5] in the mid 1950's for blood cell counting. The research was based on the technique known as “Coulter’s Principle” or the Aperture Impedance technique. This technique uses the resistivity of the blood cells because thee impedance of the cells suspended in the diluting fluid is much more higher than that of fluid was based on the fact that the resistivity of blood cells is much higher than that of the diluting fluid. Most modern cell counters serves on the basis of this extensively developed since 1950’s.
2.3
Cellular Elements of Blood
Different blood cell types are the main elements of the blood; they are white blood cells (WBC), Red blood cells (RBC), and the platelets (PLT).
2.3.1
Red Blood cell: Erythmytes
Erythrocytes are the most important and major elements of blood. There are normally 4-6 million in number in a normal human body. Hemoglobin a major part of RBCs, carry oxygen from the lungs to the tissues and carbon dioxide from the tissues back to the lungs. If any variation in RBCs count is found, it can result in many symptoms and diseases can attack on an individual. So RBCs play an important role in identifying a variety of disease.
2.3.2
White Blood Cells : Leukocytes
WBCs are the minor part of blood cells as their count is 9,000 – 30,000 / mm3 for a newly born and after few weeks it decreases to 6,000 – 11,000 / mm3. An adult has only 4,000 – 11, 000 / mm3 of leukocytes. WBCs consist of neutrophils, basophiles, eosinophiles, monocytes and lymphocytes. The lymphocytes control the immune system of human body and fight against the harmful germs in the body. Lymphocytes produce antibodies. Lymphocytes increase their number when a viral infection takes place. Neutrophils play a defensive role in attacking germs and harmful bodies. They also increase when bacterial infection is found in the body. The WBCs have a variety of life spans, some live few days and the others last for several of months. Leukocytes live in tissues and other parts of body but just use blood as a mean of transportation.
2.3.3
Platelets :Thembocytes
Platelets are fragments of cytoplasm that are fired out in the blood from large cells in the bone narrow. So some physicians don’t consider them complete blood cells. Platelets work importantly in blood clotting known as haemostasis. Vessel walls are surrounded by platelets to stop bleeding when injured. They also help in infections from enzymatic reactions.
2.4
Blood Cells sizes
As mention in the table below that platelets are much smaller than RBCs and WBCs in size. A normal human body has a platelets count of 150,000. Decrement in platelets count can result in body disorders and can cause disability of blood as a result can lead to death.
2-1: Size of blood cell types[6]
2.5
Challenges for Modern cell Counters
Counting of cells one at a time is the objective of cell counter. It may appear easy but it is more technically challenging then it seems. There arefew reasons which act as a challenge for modern cells counter. The nature of the blood cells come first, secondly the difficulty in accounting for the volume of liquid due to dilutions and finally the need to obtain a cell count separately for each cell type. In the following few sections we will briefly describe the impact of these general problems.
2.5.1
The Nature of Blood Cells
Small size and very concentration of the blood cells are the main technical challenges for it. For the separation of signals from the cells, the counter must be able and it is also able for checking of arising false signal from the cells and the removal of background noise. The sensing area of the device must be small so that the particles cross it one at a time and large enough to allow the cell particles. Since blood cells are so many in number so it may happens that more than one cell can pass through the sensing area at a single time and this is called coincidence count and the error given by this type of counting is called coincidence error. Dilution of sample and proper control at the parameters in sensor will minimize the coincidence error and will be the cause for reducing of coincidence. When cells dilution is done then cells passed one by one from sensor which is very sensitive to detect traversal of cells.
2.5.2
Sample Dilution
After a cell counting is completed, the volume came out after concentration is same as the whole blood volume. Therefore the volume of all diluted solution must be kept so that it can be refer back to the initial volume. One problem came in counting the volume that blood is in liquid form and it contains many particles of different densities so similarity of solution must be given a special attention since the cells can settle to a surface. One other problem is the flexibility of red blood cells so that it makes the similarity in cells under many flow conditions. Goldsmith proved it that after the deformation of red blood cells, cells try to mass in the direction of cylindrical tube centre and make similarity in solution. So by using pipette one of the laboratory techniques distort concentrated cells when it is a homogenous solution.
In the commercial cell counter, the loosing track of the relationship among the cells and original volume of the sample must not be done for the required dilution. The
Type of blood Size[u m]
white blood ce11 10-20
Red blood cell 6-10
problem will be overcome by carefully analyzing the sample and fluid.
2.6
Haemocytometer:
[image:3.595.330.530.141.275.2]Haemocytometeris also known as new-bar counting chamber. It can also be used in counting other type of microscopic elements e.g. sperms, bacteria, fungus etc. Think glass microscopic slide with a slip over to dispense the solution equally in the chamber is specially design for counter chamber. The chamber is fixed with a laser etched grid of perpendicular lines, and blood cells are counter per unit volume and the blood is in micro liter. Chamber is sensibly crafted so area which is under the microscopic grids is easily known and the depth of the chamber is also recognize by the user so that he can easily find the solution’s volume for cells counting.
Figure 2-1: Haemocytometer
2.6.1
Representation of Haemocytomoter.
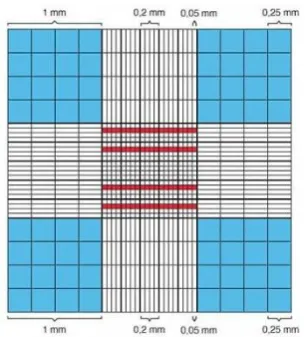
[image:3.595.105.232.264.364.2]The formal internal representation of the grid’s numbering represents in figure 2-4. The counting grid is composed of 9 big squares, measuring 1 x 1 mm. In these squares, the centered square comprises twenty-five moderate size squares for each one appraising 0.2 x 0.2 mm. This is additionally separated into sixteen minute squares for each one measuring out 0.05 x 0.05 mm. The big centurial square is known as the “erythrocyte” grid. The squares marked in red equate into eighty microscopic squares, and are applied to count the PLT and RBC. The large squares highlighted in blue are accustomed to count the white blood cells in it
Figure 2-2: Schematic representation of the Haemocytometer
2.7
Components involved in counting
[image:3.595.94.247.524.693.2]Complete system according to proposed method of blood cell counting has a microscopic camera over a microscope, Haemocytometer and a PC as shown below in the fig.
Figure 2-5: Complete system for cell counting
3.
METHODOLOGY
An adaptive automatic thresh holding technique based on Otsu method has been proposed as a counting algorithm and to enhance the accuracy of the microcell counting in microscopic images the proposed algorithm is the famous water shade algorithm. Following states the proposed algorithm for counting. An image captured by CCD camera setup at microscope is fully transformed and then divided into cropped images of mxn blocks with known size. This image is then converteded into binary image the images which are microbial and below pre-specified pixels are considered noise in the binary image and are removed in the binary image. Morphological filters and the area opening are used for smoothing procedure.
3.1
Manual methods for cell counting
In Clinical Laboratory technicians prepare the slide by mixing related reign with known quantity of blood to examine it under the microscope for blood cell counting. Count is obtained by putting contented cells as inputs in different equations.
3.1.1
Manual White Blood Cell (WBC) Counting
To manually count the WBC, 50 μl amount of blood is mixed with dilution solution of amount 950 μl. The dilution result is 1:20. This counting causes lysis of RBC (i.e. cells are destroyed by bursting), and staines the nucleus of the WBC. After mixing the counting chamber is filled immediately. The counting of the WBCs is started by the MLT after 2 mins in the 4 large squares.Using these parameters a formula has been derived for the calculation of the WBCs:
i. In the big squares how much WBCs have been counted
ii. The cell solution has been diluted up to how much extent
iii. Total number of squares that are counted.
iv. Volume of one big square
(𝑖)# 𝑜𝑓 𝑐𝑜𝑢𝑛𝑡𝑒𝑑 𝑊𝐵𝐶 𝑋 (𝑖𝑖) 𝑑𝑖𝑙𝑢𝑡𝑖𝑜𝑛
3.1.2
Manually counted platelet (PLT) counting
The manual counting of PLT is very similar to that of the RBC counting. However contrary to the RBC counting the RBCs arecompletely destroyed before analysis, the mixture of dilution is 1:20.counting chamber is filled with suspension after thorough mixing. To settle the platelets without the chamber getting dried it is left for about 20-30 minutes in the room temperature. The counting is just like red blood cells, total 80 squares are counted that are small in size.Using these parameters a formula has been derived for the calculation of the PLTs:
i. . in the small squares how much PLTs have been counted
ii. The cell solution has been diluted up to how much extent
iii. total number of squares that are counted.
iv. volume of one small square
(𝑖)# 𝑜𝑓 𝑐𝑜𝑢𝑛𝑡𝑒𝑑 𝑊𝐵𝐶 𝑋 (𝑖𝑖) 𝑑𝑖𝑙𝑢𝑡𝑖𝑜𝑛
𝑖𝑖𝑖 # 𝑜𝑓 𝑐𝑜𝑢𝑛𝑡𝑒𝑑 𝑠𝑞𝑢𝑎𝑟𝑒 𝑋 (𝑖𝑣) 𝑣𝑜𝑙𝑢𝑚𝑒 𝑜𝑓 𝑜𝑛𝑒 𝑏𝑖𝑔 𝑠𝑞𝑢𝑎𝑟𝑒
3.1.3
Manually counted Red (RBC) count
To count RBC manaully, 10 μl amount of blood is diluted in dilution solution of amount 1990 μl. The result of dilution is 1:200. The counting chamber is then immediately filled with suspension after the suspension has been thoroughly mixed. The RBCs take about approximately 3 minutes to get settled,after that RBC counting is started by the MLT in 80 small squares.
Using these parameters a formula has been derived for the calculation of the RBCs:
i. . in the small squares how much PLTs have been counted
ii. The cell solution has been diluted up to how much extent
iii. total number of squares that are counted.
iv. volume of one small square
(𝑖)# 𝑜𝑓 𝑐𝑜𝑢𝑛𝑡𝑒𝑑 𝑊𝐵𝐶 𝑋 (𝑖𝑖) 𝑑𝑖𝑙𝑢𝑡𝑖𝑜𝑛
𝑖𝑖𝑖 # 𝑜𝑓 𝑐𝑜𝑢𝑛𝑡𝑒𝑑 𝑠𝑞𝑢𝑎𝑟𝑒 𝑋 (𝑖𝑣) 𝑣𝑜𝑙𝑢𝑚𝑒 𝑜𝑓 𝑜𝑛𝑒 𝑏𝑖𝑔 𝑠𝑞𝑢𝑎𝑟𝑒
3.2
Draw Backs of manual count method
Manual inspection of images taken from microscope consumes a lot of time and is tiring. If the process of counting is disturbed, the MLT has to start the counting from beginning
An experienced MLT carries out the cell analysis by the comparison of images of cell types she sees and is familiar with. On the other hand less experienced MLT in order to confirm on the cell types would have to check with medical manuals repeatedly to make sure that the counting of given sample is accurate. Thus manual counting methods are vulnerable to human mistakes that can easily result in errors.
After analysis of slides of blood cell, they are taken away and kept. The method of retrieving and analyzing the sample for future usage is not possible with manual count.
3.3
Hematology AnalyzersLimitations
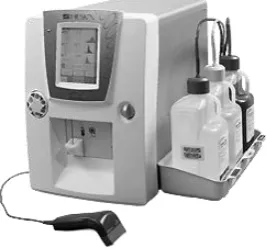
[image:4.595.354.488.136.261.2]This automatic cell counting machine is widely unavailable. The cost of latest automatic Hematology analyzer is very high for clinical laboratories in the countries like Pakistan.
Figure 3-1Hematologyanlyzers
3.4
Cell counting by proposed method
Proposed method in this paper a software that can be used for counting all three types of blood cells accurately to diagnose the patients actual problem. Proposed method can perform all standard cells counting which includes RBC, WBC and PLT counts. The functioning in the proposed method is totally based on computer vision technologies via image processing techniques. The input the software is an image of carefully prepared slide of blood solution as described in above chapters, the input image is taken from a special type of microscope camera attached to a very common compound microscope found in every clinical laboratory. The proposed method is not about the preparation of slides having blood solution that are to be viewed under the microscope. It still needs a laboratory technician who takes blood from the patient and prepares a slide as described in the above chapter. The input images that are taken through a microscope camera are similar to what the laboratory technician observes under the microscope. Like hematology analyzer machine proposed method also need a laboratory technicians to take blood but additional work in the method is to prepare the slide like they do for manual counting method. The main purpose of the proposed way of counting is to provide a cost effective method which is accurate and trustable as well as suitable for underdeveloped countries like Pakistan. The proposed method is designed for the common men and is easy to use for the end-user.
3.4.1
Functionality of proposed method
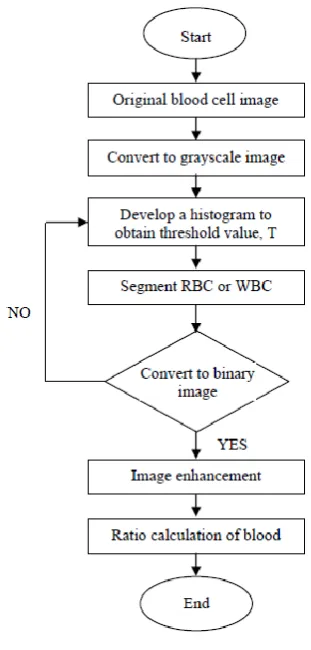
The overall Methodology of image processing techniques in the proposed method is described in the figure bellow.
Figure 3-2:over all methodology of image processing
[image:4.595.319.531.634.689.2]where we need to count the blood cells are cropped from the image and by labelling algorithm of connected pixels blood cells can be count to put in different equations to abstained cell count report.
3.4.2
Image Acquisition
A total of 45 images of all three types of cell in it were collected from Kohat University of science and technology (KUST) zoology and microbiology department. The images of blood are taken from microscope camera as described above. The images taken were verified by the microbiologist and homology experts to make sure that we have taken correct snap shots input to put methods. The images includes three imagesof each blood test three for each and 45 images in total.
3.4.3
Developing the Image Processing
algorithms
Matlab R2010a is used in this method of blood cells counting. The main reason of using Matlab R2010 for the method is to make a software based solution which is cost effective and suitable for countries like Pakistan to be implemented on large-scale in the medical world. The development of proposed method has different phases. This enrolled the pre-processing techniques of image which has to be followed before the blood cell counting in the input image.Example of pre-processing applied techniques on the image is contrast enhancement for better result to convert it to greyscale image, and then finally to binary image for easy and accurate counting for the filtered blood cells in the input image for this method the technique applied is shown in the figure 9 bellow. Considering the bellow flow chart the input image will be converted to the gray scale in very first step. Then relying on the grayscale values of the image, the new threshold values through the well known otsu method will be determined for different blood cell counts that is RBC and WBC. These values obtained from the auto threshold method will be used to remove noise from the input image and filter up the remaining noiseless blood cells .then the resulted image after these filtering processes it is then converted to the binary image to calculate the blood cells. But If still these images has noise ratio in it then above thresholding and segmentation techniques will be applied again and again until we get and noise free clear binary image having cells in it. Flow diagram of the image is as under.
3.4.4
Pre-processing of input image
Grayscale image, contrast enhancement in the image and to convert that refined image into binary image are the pre-processing image techniques used in the making of this image processing system.
3.4.5
Gray-scale Image
Initial input image that is taken from the microscope camera is a color image. to make the image processing easy for the proposed method development , the original coloredinput images will be converted into grayscale images from the range starting form 0 (black pixel) to 255 (pure white pixel) . Pixel intensity in the gray scale image can be represented In Matlab R2010a, and this conversion can be done by using a
[image:5.595.337.493.91.417.2]built-in image processing tool of matlabR2010 RGB2GRAY function. The RGB2GRAY converts the coloured RGB image into grayscale pixel intensities starting from 0-255.
Figure 3-3: Flow chart of image processing
3.4.6
Histogram and Thresholding
When the original coloured (RGB) image of blood is converted into grayscale intensity values of pixels, the gray level histogram can represent the distribution of pixel intensities of that image. We can easily see the frequencies of all intensity, and on bases of gray level values in the histogram the image can be analysed. The histogram study of gray level intensities is important to make a line between blood cells and the background. Between the two peaks of the histogram the threshold value lies some where. In Matlab R2010a software, IMHIST function can be used to develop the histogram of an image. Fig. 10 is a histogram example of blood cell image. The obtained histogram is divided into three different sections one section for RBC, the other is for WBC in the blood and third the background of these blood cells indicated by (a), (b) and (c) separately. And so the threshold value lies between the area (a) and (b) that is between the peaks of WBC and the RBC. To segment the region of interest this threshold value is used. Basically the method of converting gray scale image into the easily handled binary image is called thresholding of the image. The advantage of thisthresholding is to separate the blood cells from the back ground. The thresh Threshold value obtained from the histogram is applied on every filtered image to get the refined blood cells for counting., we placed the threshold values into following limits;
b) Pixel intensity value in the gray area of 90 to 170 are converted to pure white 255 pixel value this area represents the Red blood cells
c) Pixel intensity value in the blackish area of 171 to 255 are converted to pure black 0 pixel value this area represents the background
Figure 3-4: histogram of binary image
3.4.7
Conversion to Binary Image
Binary images are those images having only two pixel intensity values, zero (pure black) and 1 (white). By thresholding the unwanted area in color images or images with gray level pixel intensity binary images can to formed. In this proposed method development with the help of threshold value obtained from the histogram peaks the binary images is formed to separate white and red blood cells. if the result is satisfied the pre-processing phase completes here. but if more filtration id needed the image has to passes from all above processes again until we obtained our required image.
3.4.8
Image Enhancement
In the first method, image enhancement technique will be applied after the blood cell image has been converted into binary image. Normally, the original binary image consists of small spots within the image. These small spots are assumed as noise and need to be removed from the image. Hence, we proposed two image enhancement methods to remove the noise; i) removing pixels technique and ii) Gaussian filter. By using the removing pixels technique, every object in an image which contains less than 100 pixels will be eliminated. This is the best value that can be used because it does eliminate only the unwanted noise in the image. In Matlab Ra2010a, this can be done by using BWAREAOPEN function. Besides that, Gaussian filter was also applied on the binary image of the blood cell. Gaussian filter removes noise by smoothing but also blurs the image. Gaussian provides gentler smoothing and preserves edges better than a similarly sized mean filter. In the second method of image processing, the image enhancement technique was applied on the original image. For this method, only Gaussian filter was implemented on the original image.
4.
RESULTS AND DISCUSSION
This system has implemented the segmentation part and after testing this system it is concluded that, it is more timely efficient than the existing systems. It is reliable and cost effective than automated method. The aim of this system is to provide CBC i.e. completeblood Cell Count, which has been achieved by using the Powerful Image processing technique.
This system is more efficient in reducing the valuable time than manual system. The system is user friendly so that the pathologist can observe the blood cell sample image in
different views. Also pathologist can get the result of blood cell test within 20 seconds to 1 min. as tested.
4.1
Obtained Results
We have collected more than 15 blood samples for experiments and finally tested these samples by all methods of cell counting including our proposed method and we have found that our results are 95 plus % accurate.
4.1.1
Sample number 1
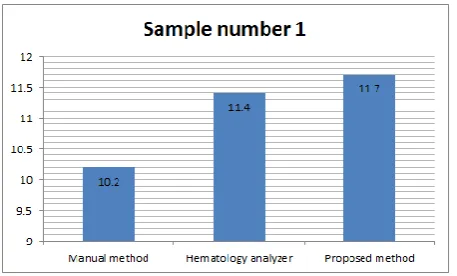
Results comparison table of the 1st tested sample for White blood cells is as under.
Manual method
Hematology analyzer
[image:6.595.73.275.72.264.2]Proposed method 10.2 11.4 11.7
Table 4-1: Results of first sample
Results of WBC of first blood sample is
Manual counting = 10.2K per micro liter
Hematology analyzer = 11.4K per micro liter
[image:6.595.323.540.350.466.2] counting by proposed method = 11.7K per micro liter
Table 4-2: Print of results by both methods
[image:6.595.316.545.550.688.2]From these results we have seen that the proposed method is working and results very close to the counting results by hematology analyzer.
Figure 4-1: Graph of 1st sample
4.1.2
Sample number 2
Table 4-3: Results of second sample
Results of WBC of first blood sample is
Manual counting = 9.8K per micro liter
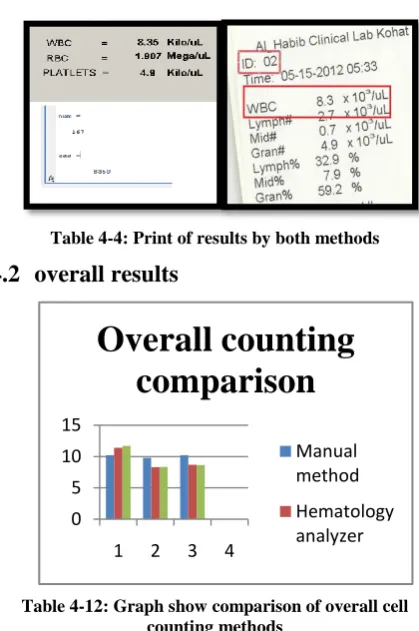
Hematology analyzer = 8.3K per micro liter
[image:7.595.51.281.116.710.2] counting by proposed method = 8.35K per micro liter
Figure 4-2: Graph of 2nd sample
from these results we have seen that the proposed method is working and results very close to the counting results by hematology analyzer.
Table 4-4: Print of results by both methods
4.2
overall results
Table 4-12: Graph show comparison of overall cell counting methods
above graph shows that manual way of blood cell counting has greater chance of error in it while our proposed method of cell counting and counting on hematology analyzer are totally or almost similar.
5.
CONCLUSION AND FUTURE
RECOMMNDATION
In this paper we have developed a software based solution for blood cell count for underdeveloped countries like Pakistan which are resource less to produce and provide expensive hematology analyzer in every hospital laboratory of the country.
Proposed method of cell counting is fast, cost effective and accurate to produce blood cell report. it gives 95-100% accurate results for white blood cell count which an important test carried out to diagnose diseases like dengue at initial stages. but due to limited resources we were unable to find some good images of platelets and red blood cells but the idea and procedure for these tests are also same like it is for white blood cell counting.
5.1
Future recommendation
Proposed method for cell counting white blood cells in the paper is similar for counting remaining two types of cell counting. and through the same procedure we can develop an other algorithm for detecting malaria parasite in the blood, malaria parasite also found in blood and the current method of detecting malaria parasite is to prepare the slide and study is under microscope to recognize malaria parasite in the blood, by improving our proposed algorithm we can also detect malaria parasite through computer vision technologies and techniques of image processing techniques. but this procedure would need a little advance microscope then the ordinary used in the clinical labs to achieve 100% accurate results.
6.
REFERENCES
[1] Graham Ramsay, Commercial biosensors, John Wiley & Sons, Inc, New York, 1998. 1-Stat Corporation official web page, http://www. i-stat.com/ , 1999.
[2] Graham Ramsay, Commercial biosensors, John Wiley & Sons, Inc, New York, 1998. 1-Stat Corporation official web page, http://www. i-stat.com/ , 1999.
[3] Hajdu, SI. The discovery of Trichomonasvaginalis. Act Cytologica 1998;42:1075.
[4] Bennett, JH. The Employment of the Microscope inMedical Studies. Stewart, Edinburgh, 1841.
[5] Hajdu, SI. The discovery of Trichomonasvaginalis.
[6] JH. The Employment of the Microscope in Medical Studies. Stewart, Edinburgh, 1841.
[7] Bennett, JH. Case of hypertrophy of the spleen and liver, in which death took place from suppuration of the blood.
Manual method
Hematology analyzer
Proposed method
9.8 8.3 8.35
0 5 10 15
1 2 3 4
Overall counting
comparison
Manual method
[image:7.595.59.269.397.713.2] [image:7.595.69.272.407.505.2]