Analytical Study of Position based Routing Protocols in
VANET
Monika
ME-CSE Student
PEC University of Technology
Chandigarh
Sanjay Batish
Head of Computer Centre
PEC University of Technology
Chandigarh
Amardeep Dhiman
Assistant Professor
Punjabi University
Patiala
ABSTRACT
Vehicular Ad-hoc Network is one of the emerging technologies which will make the life easy. Most of the people are dying because of road accidents. VANETs will reduce it to larger extent by providing important knowledge to drivers. This knowledge is provided by one vehicle to other using inter vehicle communication. To make VANETs successful routing of such message should be given greater attention. Position-based routing protocols are considered best for high dynamic network like VANET. In this paper we are going to compare the position-based routing protocols which work even in high traffic density very accurately.
Keywords
VANETs, IVC, Position-based Routing Protocol, GPSR, BMFR, AMAR, BMAR
1.
INTRODUCTION
Automotive industry and many governments recognized the traffic safety as a major challenge. According to [1], in 1999 alone 450,000 road accidents were reported in Germany. During the same year, Europe reported three times this number of accidents with fatalities of 42,000. Similar situations exist in other parts of the world like United States [2]. To improve safety and traffic efficiency in vehicles, there has been significant research efforts [3] made by government, academia and industry to integrate computing and communication technologies into vehicles, which has resulted in the development of Intelligent Transportation Systems (ITS) [4]. Vehicular communication is a major part of ITS which forms a network called VANET. Vehicular ad hoc networks (VANETs) [5] are a special class of mobile ad hoc wireless networks (MANETs) where the nodes are vehicles and roadside units. It is currently attracting the extensive attention of research in the field of wireless networking as well as automotive industries. In VANETs each vehicle takes on the role of sender, receiver, and router [6] to broadcast information to the vehicular network ortransportation agency, which then uses the information to ensure safe and free flow of traffic. For communication to occur between vehicles and Road Side Units (RSUs) vehicles must be equipped with some sort of radio interface or On Board Unit (OBU) that enables short-range wireless ad hoc networks to be formed [2]. Vehicles must also be equipped with hardware that permits detailed position information such as Global Positioning System (GPS). VANETs [7] provide safer and well organized road by communicating information in timely manner to drivers and concerned authorities. The communication between nodes in a VANET faces many unique challenges [8].
2.
FEATURES OF VANETS
Though VANETs is a subgroup of MANETs and a component of ITS systems, still it is a distinct research field with some unique features. The unique characteristics of VANETs include [9] high mobility with the constraint of road topology as the node motion is constrained by the road topology and layout, rapidly changing network topology due to high node mobility, initially low market penetration ratio, potentially unbounded network size with the vehicles in one city, several cities, or even a country, anonymous addressee, time-sensitive data exchange as most safety related applications requires data packet transmission in a timely manner, potential support from infrastructure, abundant resources like abundant energy, computation resources, etc. and better physical protection.
3.
COMMUNICATION IN VANETS
VANET is mainly helpful in safety related applications like accident alert in which vehicle involved in accident broadcast its position, emergency brake warning, road features like road curve, sudden downhill, etc. For all these applications data must be transmitted accurately in no time. Two types of communication are possible in VANETs: Inter-Vehicle Communication (IVC) and Roadside-Vehicle Communication (RVC). In IVC, communication takes place between vehicles only. IVC systems are completely infrastructure-free; only onboard units (OBUs) sometimes also called in-vehicle equipment (IVE) are needed. RVC systems assume that all communications take place between roadside infrastructure (including roadside units [RSUs]) and vehicles or OBUs. IVC systems are of great concern as most of the safety applications require communication between vehicles within no time. For IVC so many routing protocols are developed in which position-based routing protocols suits most. In next section we’ll describe position-based routing protocols.
4.
POSITION-BASED
ROUTING
PROTOCOLS
which keeps the position information of all the nodes or vehicles in the network. Here are some of the position-based protocols which we are going to compare in this paper.
4.1
Greedy Perimeter Stateless Routing
Protocol (GPSR)
GPSR [10] is the first position-based routing protocol. As a position-based routing protocol, it uses the geographic location of nodes to forward the packets. It works in two modes. First it requires that each node in the network is able to find its current position by using GPS receiver which provides current location, speed, current time and direction of the vehicles. By using all this information, source node or current forwarding node looks for the neighbor node which is closest to the destination and then forwards the packet to that node by considering it the next forwarding node. This operating mode is known as Greedy Forwarding in which the neighbor which is closest to the destination is selected as the next-hop node.
Sometimes due to the transmission error of beacon messages or problem in GPS system in some situations like when node is in tunnel where GPS does not work or some other error, vehicles fail to find its neighboring nodes. Due to this lack of knowledge of neighbor nodes and due to the absence of neighbor node closest to destination than the forwarding node itself, a problem called local maxima may occur. In this situation GPSR uses its second mode called perimeter mode which is a most advance recovery strategy. It uses an algorithm of planer graph traversal to find a way out of the local maximum region. Although this advancement, considering only position information may lead packets to be forwarded in a wrong direction and loses good candidates that ensures its delivery.
4.2
Border-node based Most Forward
within Radius Routing Protocol
(BMFR)
Finding the next forwarding node to deliver the packet to the destination node using greedy approach does not support well in highly mobile ad hoc network such as VANET. Therefore, other position based protocols such as MFR, GEDIR, Compass routing, etc. have been used for VANET to improve its performance for high vehicular density environment. These protocols can be made better by utilizing farthest next-hop node in a dense and highly mobile network. Border-node based Most Forward within Radius (BMFR) [11] is a position based routing protocol that uses border-nodes with maximum progress towards destination node. This progress is observed by projecting the position of neighbor node on the line segment joining the source to estination. The BMFR utilizes the border-node to avoid the use of interior nodes within the transmission range for further transmitting the packet. This method selects the border-node as a next-hop node for forwarding packet from source to destination. Similarly that selected next-hop node follows the same procedure for selecting next forwarding node towards destination. The procedure continues till the destination node is in the transmission range of the current forwarding node.
4.3
Adaptive Movement Aware Routing
Protocol (AMAR)
In the greedy approach, the neighbor node of current forwarding node which is closest to the destination node is selected as the next forwarding node. In this method a sender node finds the position information of neighbor nodes and
decides the next forwarding based on it. AMAR [12] is a Movement Aware Greedy Forwarding (MAGF) based on the greedy forwarding scheme to select next-hop node towards the destination. AMAR scheme makes use of additional information other than the position about vehicle movement to select an appropriate packet’s next-hop that ensures the data delivery successfully. This scheme is suitable for highly mobile vehicular ad hoc network and it performs better even when pure greedy forwarding fails. In AMAR every vehicle calculates its position, speed and direction by using the GPS or any other navigation system. After this, its significant role is to assign priority based on calculated attributes between neighbors while selecting a next-hop node for forwarding a packet. The basic idea of this approach is to compute a weighted score Wi which depends on three factors: the position, the speed, and the direction of vehicle nodes. This weighted score Wi can be computed by current packet forwarder for neighbor node i as follows:
where α, β, and γ are the weight of the three used metrics Pm, Dm, and Sm representing respectively the position, the direction and the speed factors with:
The AMAR movement aware greedy forwarding exploits other attributes of nodes like speed and direction other than the position information and improves the data delivery.
4.4
Border-node based Movement Aware
Routing Protocol (BMAR)
BMFR uses border node as the next hop node to reduce the hop count as border node is closest neighbor to the destination. But in city scenario or in situations where traffic density is very high, probability of two or more border nodes which are equidistant from the destination increases. BMAR [13] uses the features of AMAR to resolve the conflict between two border nodes. It calculates speed and direction parameters and determines the weighted score of candidate border nodes. Now the border node which is moving with high speed and in the direction of destination will be chosen as a next hop node. Since the traffic density is high, again a conflict may occur. BMAR resolves it using the probability factor. Probability of changing the direction at intersection is high so BMAR discards the nodes with intersection in their route. If it does not suit in the situation then the node with highest successful transmissions is selected as next hop node.
5.
RESULTS
Table 1 Scenario-1 with nodes variation
Parameter Value
Simulation time Simulation area No. of Vehicles Vehicle’s Speed Transmission Range Packet Size
Vehicle Hello Interval Application
MAC Protocol
100s
1652*1652 m2 24,48,72,96,120 40-60 km/h 300-1000 m 1024 bytes 0.25s CBR IEEE 802.11
[image:3.595.307.520.84.214.2]Using above defined parameters we simulate the network. Our mobility model used for simulation can be observed from fig1.
Fig 1: Mobility Model used in Simulation
We simulate four routing protocols: GPSR, AMAR, BMFR and BMAR (proposed) using this scenario. We evaluate three metrics: Packet Delivery Ratio (PDR), Average End-to-End Delay and Throughput.
Packet Delivery Ratio metric gives the ratio of the data packets successfully received at the destination and total number of data packets generated at source. The following equation is used to calculate the PDR,
DataR = Data packets received by the CBR agent at destination node
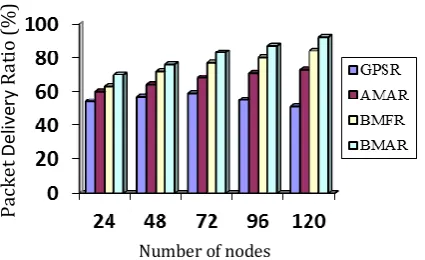
DataS = Data packets sent by the CBR agent at source node We analyzed the packet delivery ratio of GPSR, AMAR, BMFR and BMAR using NS2 and awk script. Below is the graph, Graph 1 showing the packet delivery ratio with the increase in the number of nodes.
Graph 1: Packet Delivery Ratio change with Number of Nodes
In Graph 1, we compared the packet delivery ratio (PDR) of BMAR (proposed) protocol with existing position based protocols. It can be clearly observed that the PDR of BMAR is highest as compare to existing protocols. Also we can analyze that as the number of nodes increase, PDR of BMAR increases. For AMAR and BMFR also, PDR increases with the increase in number of nodes but with small fraction. In case of GPSR, PDR increases initially but later on it starts decreasing.
Average End-to-End Delay gives the overall average delay of all data packet, from the packet transmission by the application agent at the source node till packet reception by the application agent at the destination node. Below is the graph, Graph 2 showing the average delay with the increase in the number of nodes.
Graph 2: Average End-to-End Delay change with Number of Nodes
In Graph 2, we compared the average end-to-end delay of BMAR protocol with existing position based protocols. It can be clearly observed that the delay of BMAR is lowest as compare to existing protocols. Also we can analyze that as the number of nodes increase, delay of BMAR decreases. For AMAR and BMFR also, delay decreases with the increase in number of nodes but with small fraction. In case of GPSR, delay decreases initially but later on it starts increasing. Throughput is the number of bits sent in one second. We can define it in Kbps. We simulated the network and analyzed the variation in throughput by increasing the number of nodes. Graph 3 shows the performance of protocols in terms of throughput.
P
ac
ke
t
D
el
ive
ry
Ra
ti
o
(%
)
Number of nodes
E
n
d
-to
-E
n
d
D
el
ay
(ms)
[image:3.595.55.269.279.476.2]Graph 3: Throughput change with Number of Nodes
We can see in above graph that BMAR protocol outperforms other existing protocols in terms of throughput. GPSR has almost negligible throughput which increases with increase in number of nodes. AMAR and BMFR also perform well in terms of throughput but the graph shows improvement by using BMAR as the routing protocol.
5.2
Simulation with variation of Simulation
Time
[image:4.595.318.534.83.221.2]In this scenario, we have fixed the number of vehicles as 24. We simulate the network by varying the simulation time from 20 to 100 seconds. The area is same i.e. 1652*1652 m2 as in earlier setup for the movement of nodes. Following is the table, Table-2 showing the parameters with its value used in the simulated scenario with time variation.
Table 2 Scenario-2 with simulation time variation
Parameter Value
Simulation time Simulation area No. of Vehicles Vehicle’s Speed Transmission Range Packet Size
Vehicle Hello Interval Application
20,40,60,80,100s 1652*1652 m2 24
40-60 km/h 300-1000 m 1024 bytes 0.25s CBR
Using this scenario, again we simulate the same four routing protocols: GPSR, AMAR, BMFR and BMAR. We evaluate three metrics: Packet Delivery Ratio (PDR), Average End-to-End Delay and Throughput and compare for all the four simulated protocols.
Packet Delivery Ratio is analyzed first using the above defined simulation setup with the use of NS2 and awk script. Below is the graph, Graph 4 showing the packet delivery ratio with the increase in the simulation time.
Graph 4: Packet Delivery Ratio change with Simulation Time
In Graph 4, we compared the packet delivery ratio (PDR) of BMAR protocol with existing position based protocols. It can be clearly observed that the PDR of BMAR is highest as compare to existing protocols. Also we can analyze that as the simulation time increases, PDR of BMAR increases. For GPSR, AMAR and BMFR also, PDR increases with the increase in simulation time but very slowly.
Average End-to-End Delay is evaluated with the change in simulation time for all the four routing protocols. Graph 5 shows the performance in terms of delay.
Graph 5: Average End-to-End Delay change with Simulation Time
From Graph 5, we can analyze that the packet take less time to reach its destination in case of BMAR protocol as compare to other protocols. In case of GPSR, delay first decreases with increase in simulation time but after some time it starts increasing with time.
Throughput of all the protocols is calculated with the change in simulation time. Graph 6 shows the performance of all the routing protocols.
Thr
o
u
gh
p
u
t
(kbp
s)
P
ac
ke
t
D
el
iv
er
y
Ra
ti
o
(%
)
Number of nodes
Simulation Time (sec)
Simulation Time (sec)
A
ve
ra
ge
E
n
d
-to
-E
n
d
D
el
ay
[image:4.595.46.279.90.229.2]Graph 6: Throughput change with Simulation Time
From Graph 6, we can analyze that more packets or data is reached in a given time period in case of BMAR routing protocols as compare to other existing routing protocols. Graph 6 shows the highest peak for BMAR and lowest for GPSR. For GPSR, the throughput is almost negligible in comparison to other protocols. AMAR and BMFR perform well in terms of throughput but BMAR outperforms all protocols.
6.
CONCLUSION
We simulated routing protocols like GPSR, AMAR, BMFR and BMAR on NS2 and compared their performances. For comparison, we selected three metrics: packet delivery ratio, average end-to-end delay and throughput. We have considered two parameters i.e. number of nodes and the simulation time for changing the simulation set up. For both set ups, we simulated and compared all the routing protocols and found that BMAR outperforms all the compared routing protocols. Its packet delivery ratio is highest and delay is lowest. It delivers the maximum packets accurately to the destination node within no time. Throughput of BMAR protocol is also highest in both the simulation scenarios which shows that maximum data is transmitted by BMAR in a given time period. We need to develop some more efficient routing protocol as VANET has main usage in safety related applications so message should reach the destination without any delay.
7.
REFERENCES
[1] Andreas Festag, Holger Fubler, Hannes Hartenstein, Amardeo Sarma, and Ralf Schmitz FleetNet: Bringing Car-to-Car Communication into the Real World. In Proceedings of 11th World Congress on ITS, Nagoya, Japan, Oct 2004.
[2] A. Stampoulis, Z. Chai “Survey of Security in Vehicular Networks” Technical report, 2007 Project CPSC 534. [3] Panos Papadimitratos and Jean-Pierre Hubaux Report on
the "Secure Vehicular Communications: Results and Challenges Ahead" Workshop. ACM SIGMOBILE Mobile Computing and Communications Review (MC2R), 12(2):53–64, 2008.
[4] Y. Qian and N. Moayeri “Design of Secure and Application-Oriented VANETs” in Vehicular Technology Conference, VTC Spring 2008, IEEE, 2008 [5] H. Moustafa, Zhang Yan, “Vehicular networks:
Techniques, Standards, and Applications,” CRC Press, 2009.
[6] Jinyuan, S., Chi, Z., Yuguang, F., “An ID-based framework achieving privacy and non-repudiation”, In Proceedings of IEEE vehicular ad hoc networks, military communications conference (MILCOM 2007) (pp. 1–7), October 2007.
[7] S. S. MANVI and M S KAKKASAGERI, “Issue in Mobile Ad hoc Networks for Vehicular Communication”, IETE Technical Review, Vol. 25, No. 2, March-April 2008.
[8] Elmar Schoch, Frank Kargl, Michael Weber, Tim Leinmuller “Communication Patterns in VANETs”, IEEE Communications Magazine, 46:119–125, Nov 2008.
[9] Z. Li, Z. Wang, and C. Chigan, “Security of Vehicular Ad Hoc Networks in Intelligent Transportation Systems,” in Wireless Technologies for Intelligent Transportation Systems, Nova Science Publishers, 2009
[10] B. Karp and H. T. Kung, “GPSR: Greedy Perimeter Stateless Routing for Wireless Networks,” Proc. of ACM/IEEE International Conference on Mobile Computing and Networking 2000
[11] Raw R.S., Lobiyal D.K., “B-MFR Routing Protocol for Vehicular Ad hoc Networks”, IEEE, ICNIT 2010, Manila, Philippines 2010.
[12] Brahmi N., Boussedjra M., Mouzna J., Bayart M, “Adaptive Movement Aware Routing for Vehicular Ad Hoc Networks”, Leipzig. Germany 2009.
[13] Monika, Sanjay Batish, Amardeep Singh, “Border-node based Movement Aware Routing Protocol”, In Proceedings of International Conference on Computer Science and Engineering (ICCSE), page No. 164 -167, Feb. 2012.