Tracking the Trends of Financial Applications Using
Genetic Algorithm
B. Manjula
Department of Informatics,
Kakatiya University,
Warangal, A.P, India
R. Lakshman Naik
Department of CSE,
BITS, Warangal, A.P, India
S.S.V.N. Sarma
Department of CSE,
Vaagdevi College of Engineering,
Warangal, A.P, India
ABSTRACT
The generation of profitable trading rules for stock market investments is a difficult task but admired problem. First stage is classifying the prone direction of the price for India cements stock price index (ICSPI) futures with several technical indicators using artificial intelligence techniques. And second stage is mining the trading rules to determined conflict among the outputs of the first stage using the evolve learning. We have found trading rule which would have yield the highest return over a certain time period using historical data. These groundwork results suggest that genetic algorithms are promising model yields highest profit than other comparable models and buy-and-sell strategy. Experimental results of buying and selling of trading rules were outstanding.
Key Words
Data mining, Trading rule, Genetic algorithm, ICSPI prediction
1.
INTRODUCTION
For a long time, stock market prediction is long esteemed desire of investors, speculators, and industries. Although several studies investigated to predict price movements in stock market, financial time series too complex and noisy to forecast. Many researchers predicted the price movements in stock market using artificial intelligence (AI) techniques during past decades
Recent research tends to include novel factors and to hybridize several AI techniques. In [4] proposed fuzzy expert systems to predict stock market returns. He suggested that ANNs and fuzzy logic could capture the complexities of the functional mapping because they do not require the functional specification of the function to approximate. A more recent study of [5] incorporated prior knowledge to improve the performance of stock market prediction. In [8] integrated the rule-based technique and the ANNs to predict the direction of the S&P 500 stock index futures on a daily basis.
Previous research using AI techniques almost predicted the price of every trading day, week, and month. It is more important, however, to determine stock market timing, when to buy and sell stocks, than to predict the price movement for everyday because investors in stock market generally do not trade everyday. If investors trade their stocks everyday, they are charged to tremendous amount of fee for trade. Market timing is an investment strategy which is used for the purpose of obtaining the excess return. Traditionally excess return is achieved by switching between asset classes in anticipation of major turning points in stock market [9].
While rule-based technologies improved dramatically, many of stock market applications were less than successful. For this reason, the trend toward automatic learning systems is particularly evident in the financial services sector. Advances in chaos theory provide the theoretical justification for constructing nonlinear models, which is typically the goal in machine learning. Previous studies on this issue suggest that artificial intelligence techniques such as artificial neural networks (ANN) have more frequent chances to detect nonlinear patterns in stock market [2], [6], [7]. ANN, however, has a drawback that the users of the model can not readily comprehend the final rules.
We propose data mining approach using genetic algorithms (GA) to solve the knowledge acquisition problems that are inherent in constructing and maintaining rule-based applications for stock market. Although there are an infinite number of possible rules by which we could trade, but only a few of them would have made us a profit if we had been following them. This study intends to find good sets of rules which would have made the most money over a certain historical period. This paper tends to mine reasonable trading rules using genetic algorithms for India Cements stock price index (ICSPI) future. We have found trading rule which would have yield the highest return over a certain time period using historical data. Experimental results of buying and selling of trading rules were outstanding.
2.
RELATED WORK
In refer. [7] Used several learning algorithm and prediction method for the Tokyo stock exchange prices index (TOPIX) prediction system. This system used modular neural network that learned the relationships between various factors. The output of this system was the best timing for when to buy and sell stocks. They executed simulation of buy and sell stocks to evaluate the effect of system. In this study, vector curve, turn-over ratio, foreign exchange rate and interest rate were used as input variables. Trading profit using this system revealed more than that of “Buy and hold strategy”.
In refer. [6] Classified the changing pattern of TOPIX to triangle pattern by use of candlestick chart. They have learned these patterns using the recurrent neural network. The test set of triangle was accurately classified in 15 out of 16 experiments. [2] Tried to test the „Arbitrage pricing theory (APT)‟ by ANN. This study used backpropagation neural network with generalized delta rule to learn relationship between the return of individual stocks and market factors.
two-week period to the trading day, open, high, low, close price, open price and the price fifteen minutes after the market opening of the current trading day. The output variable was long or short recommendation. They performed composite rule generation procedure to generate rules for combining outputs of networks. They reported prediction accuracy was 45.3% - 52.8%.
In refer. [11] Also executed daily prediction of German Government Bond Futures using feed-forward backpropagation neural network. In this study, they used opening range (obtained from the highest and lowest bids at the open), highest, lowest price, closing price, volume of traders, open Interest, industrial production, consumer prices, current account balance, unemployment rates, short and long term interest rates, wholesale price index, M3 combined supply and benchmark bond yield as input variables. The following day's closing price was output. A result of the network's predictions as compared to the actual movement was 53.94%.
In refer. [12] Have presented a work which also attempts to optimize the timing of an automated trader. They use GA to develop trading rules for short time periods, using Technical Indexes, such as RSI, as GA‟s chromosome. They proposed the use of the developed rules on stocks of Spanish company. However, the description in that work was too preliminary to allow for a comparison with our system to be made.
And also, in refer. [13] Have presented a work which attempts to generate the buying and selling signals against 30 companies‟ stocks in Germany (DAX30). They use combination of Technical Indexes applied to GA as well as [12], and then rank the stocks according with the strength of signals to restructure the portfolio. However, they don‟t devise any criterion of profit cashing and loss cutting.
3.
GENETIC
ALGORITHM
(GA):
PROPOSED MODEL
Application of GA in the context of data mining is generally for the task of hypothesis testing and refinement, where the user poses some hypothesis and the system first evaluate the hypothesis and seek to refine it. Hypothesis refinement, where the user poses some hypothesis and the system first evaluates the hypothesis and then seeks to refine it. Hypothesis refinement is achieved by “seeding” the system with the hypothesis and then allowing some or all parts of it to vary. One can use a variety of evaluation functions to determine the fitness of a candidate refinement. The important aspect of the GA application is the encoding of the hypothesis and evaluation function for fitness. Another way to use data mining is to design a hybrid techniques by blending one of the know techniques with GA [1].
GA is search algorithm based on the mechanics of natural selection and genetics and they combine survival of the fittest among string structures to form a search algorithm [3]. GA is particularly suitable for multi-parameter optimization problems with an objective function subject to numerous hard and soft constraints. The main idea of GA is to start with a population of solutions to a problem, and attempt to produce new generations of solutions which are better than the previous ones. GA operates through a simple cycle consisting of the following four stages: initialization, selection, crossover, and mutation. Figure 1 shows the basic steps of proposed genetic algorithms model.
In the initialization stage, a population of genetic structures (called chromosomes) that are randomly distributed in the solution space is selected as the starting point of the search. These chromosomes can be encoded using a variety of schemes including binary strings, real numbers or rules. After the initialization stage, each chromosome is evaluated using a user-defined fitness function. The goal of the fitness function is to numerically encode the performance of the chromosome. For real- world applications of optimization methods such as GA, the choice of the fitness function is the most critical step.
The mating convention for reproduction is such that only the high scoring members will preserve and propagate their worthy characteristics from generations to generation and thereby help in continuing the search for an optimal solution. The chromosomes with high performance may be chosen for replication several times whereas poor-performing structures may not be chosen at all. Such a selective process causes the best-performing chromosomes in the population to occupy an increasingly larger proportion of the population over time.
Crossover causes to form a new offspring between two randomly selected 'good parents'. Crossover operates by swapping corresponding segments of a string representation of the parents and extends the search for new solution in far-reaching direction. The crossover occurs only with some probability (the crossover rate). There are many different types of crossover that can be performed: the one-point, the two-point, and the uniform type.
Mutation is a GA mechanism where we randomly choose a member of the population and change one randomly chosen bit in its bit string representation. Although the reproduction and crossover produce many new strings, they do not introduce any new information into the population at the bit level. If the mutant member is feasible, it replaces the member which was mutated in the population. The presence of mutation ensures that the probability of reaching any point in the search space is never zero.
4.
TRADING RULE
Although there are an infinite number of possible rules by which we could trade, it seems that only a few of them would have made a profit. To find the rule that would have yielded the most profit had it been used to trade stocks on a given set of historical data, firstly, we develop trading rules of this general form is as shown below.
4.1.
General form of trading rules
If today’s value of the indicator 1 is greater than or equal to (less than) A1,
And change since the last day’s value of the indicator 2 is Greater than or equal to (less than) A2,
And last day’s value of the indicator 3 is greater than or equal to (less than) A3,
And last day’s value of the indicator 4 is greater than or equal to (less than) A4,
And last day’s value of the indicator 5 is greater than or equal to (less than) A5,
And today’s value of the indicator 6 is greater than or equal to (less than) A6,
Then buy, else sell
Fig.1. Basic steps of proposed model
There are five conditions that are evaluated for each trading day. If the all of five conditions are satisfied, then the model will produce „buy‟ signal on that day, otherwise it will suggest „sell.‟ A1 to A6 denotes the cutoff values. The cutoff values
range from 0 to 1, and represent the percentage of the data source's range. For example, if RSI (relative strength index) ranges from 0 to 100, then a cutoff value of 0.0 would match a RSI of 0, a cutoff value of 1.0 would match a RSI of 100, and a cutoff value of 0.5 would match a RSI of 50. This allows the rules to refer to any data source, regardless of the values it takes on. We consider additional flexibility regarding the indicator component of the rule structure such as „today‟s value,‟ „last day‟s value,‟ and „change since the last day‟s value.‟ Translating this in its full form, for example, would yield the following statement:
4.2.
Trading rules
If today’s value of ROC is greater than or equal to 30.0, And change since the last day’s value of RSI is less than 60.0, And last day’s value of stochastic %D is less than 51.0, And last day’s value of A/D oscillator is less than 12.5, And last day’s value of MACD is less than 14.9, And today’s value of stochastic %K is less than 75.9, Then buy else sell
Above rule structure is summarized in Table 1. In Table 1, „which data‟ means data source the rule refers to, and „modifier‟ means a modifier value that determines if the value itself should be examined, or if the last day's value or the change since the last day should be examined. There has been much debate regarding the development of trading system using historical data. We agree that the future is never exactly like the past; however, a common investment approach is to employ systems that would probably have worked well in the past and that seem to have a reasonable chance of doing well in the future. So, we define a goal of the system as finding a
rule which would have yielded the highest return over a certain time period.
In setting up the genetic optimization problem, we need the parameters that have to be coded for the problem and an objective or fitness function to evaluate the performance of each string. The parameters that are coded are the cell values of Table 1. The varying parameters generate a number of combinations of our general rules. The task of defining a fitness function is always application specific. In this case, the objective of the system is to find a trading rule which would have yielded the highest return over a certain time period. We apply the trading profit to the fitness function for this study.
Table 1: Trading rules
Rule number
Which data
Less than/ greater than or equal to
Cutoff value
Modifier
1
INTi1 1 or 2 A1 1,2 or 32
INTi2 1 or 2 A2 1,2 or 33
INTi3 1 or 2 A3 1,2 or 34
INTi4 1 or 2 A4 1,2 or 35
INTi5 1 or 2 A5 1,2 or 36
INTi6 1 or 2 A6 1,2 or 3Description: INTij (i=1,2,..n, j=condition number)
1=Less than/ 2= greater than or equal to Cutoff Aj (j=condition number)
1=today‟s value, 2=last day‟s, 3=change since the last day
Calculate
Fitness
Initialize
Population
Problem
Represent
Selection
Check
Convergence
Apply
Mutation
Apply
Crossover
Data for
Training
Calculate
Indicators
Apply
Trading rules
Results
Yes
[image:3.595.309.551.517.719.2]Table 2: Technical indicators
Name of feature Formula
Stochastic %K
100
L H L CL
H
L
C
Stochastic %Dn
K
i nn i
1%
0
ROC (rate of change)
100
n i iC
C
A/D Oscillator i i i iL
H
C
H
1OSCP (price oscillator)
10 20 10
SMA
SMA
SMA
RSI (relative strength
index): 1 )
100 ( 100 RS
Stochastic slow %D
n
D
i n n i
1%
0
Momentum
4
C
iC
iDisparity 10 days
100
10
SMA
C
iDisparity 20 days
100
20
SMA
C
iCCI (commodity channel index) i
D
ofTP
SMA
TP
015
.
0
20MACD (Moving
Average Convergence Divergence )
26
12
EMA
EMA
Note: - C: close; L: low; H: high; LL: lowest low in the last n days; HH: highest high price in the last n days; SMA: simple moving average; RS: Average Gain / Average Loss; TP: Typical Price = (High + Low + Close)/3; Di: Mean Deviation; EMA: Exponential Moving Average;
4.3.
Data and Variables
The research data used in this study is India cements stock price index (ICSPI) from September, 2011 through April, 2012. Futures are the standard forms that decide the quantity and price in the certified market (trading place) at certain future point of time (delivery date). General functions of futures market are supplying information about future price of commodities, function of speculation and hedging. Being different from the spot market, futures market does not have continuity of price data. That is because futures market has
price data by contract. So, in futures market analysis, nearest contract data method is mainly used and incorporated in this research. We collected a sample of 160 trading days. Data has been collected from Yahoo finance and Money control web site.
Many previous stock market analyses have used technical or fundamental indicator. In general, fundamental indicators are mostly used for long-term trend analysis while technical indicators are used for short-term pattern analysis. In this research, we use the technical indicators as input variables. We choose 12 technical indicators to narrow the set of variables. The total available indicators used to search trading rules are technical indicators such as Stochastic %K, Stochastic %D, Stochastic slow %D Momentum, ROC (rate of change), A/D Oscillator (accumulation / distribution oscillator), Disparity 10 days, Disparity 20 days CCI (commodity channel index), OSCP (price oscillator) MACD (Moving Average Convergence Divergence) and RSI (relative strength index). The formulas of technical indicators are as shown in table 2.
5.
EXPERIMENTAL RESULT
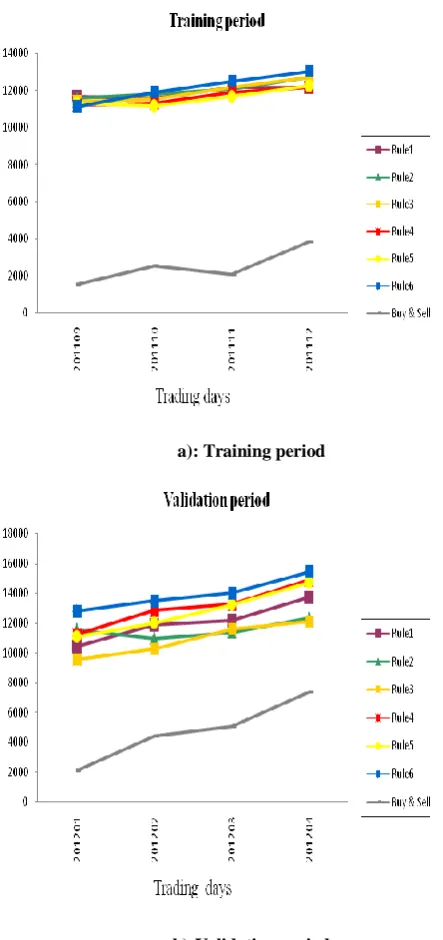
[image:4.595.308.551.463.759.2]To find the profitable trading rules, in this paper GA model was proposed in the previous section. We use 100 chromosomes in the population for this study. The crossover and mutation rates are changed to prevent the output from falling into the local optima. The crossover rate ranges 0.5 - 0.7 and the mutation rate ranges 0.05 - 0.12 for this experiment. We extract six trading rules by genetic search process. The derived rules are alternatively good trading rules although there is minor difference in simulated performance. Each of rules consists of conditions referring input factors. These processes and simulation are done by the genetic algorithms software package (evolver). Trading profit earned from simulation results are summarized in Table 3 and Fig. 2.
Table 3: Summarized Results
Trading rules
Accumulated amount ( Assume initial investment of 10,000)
Training
(Sep 2011 – Dec 2011)
Profit (%)
Validation
(Jan 2012 – April 2012)
Profit (%)
Buy-Sell 3856 -61.44 7364 -26.36
Rule 1 12178 21.17 13740 37.4
Rule 2 12716 27.16 12357 23.57
Rule 3 12730 27.3 12100 21.00
Rule 4 12176 21.76 14893 48.93
Rule 5 12273 22.73 14753 47.53
a): Training period
[image:5.595.59.281.75.546.2]b):Validation period Fig.2 :- performance of simulation results
While the underlying index decreased more than 61% during the training period, we could find rules that would have yielded the high level of profit had it been used to trade stocks on a given set of historical data. The rules derived by learning training data using GA are applied validation (holdout) samples to verify the effectiveness of the proposed approach. While the underlying index decreased about 26% during the validation period, the trading strategies followed by the derived rules earn 21% to 54% of trading profit during the period. These preliminary results shows that GA is promising model yields highest profit than other comparable models and buy-and-sell strategy. However, trading rules generated by GA produce predictions only when the rules are fired. Each of the rules extracted produces predictions less than 18% of time.
6.
CONCLUSION
In this paper we mine reasonable trading rules using GA for India Cements Stock Price Index (ICSPI). We have found six alternative good rules which would have yielded the high return over a certain time period. Simulated results of buying and selling of trading rules were outstanding. These preliminary results suggest that GA is promising methods for extracting profitable trading rules. Although the trading systems that have worked well in the past seem to have a reasonable chance of doing well in the future, we need a more extensive validation process.
We need a more extensive validation process because the future is never exactly as the past. We are working towards verifying and enhancing the trading rules using current data.
7.
REFERENCE
[1] Arun K Punjari “Data mining techniques” universities press (India) Pvt. Ltd. 2001
[2] Ahmadi, H., “Testability of the arbitrage pricing theory by neural networks,” Proceedings of the IEEE International Conference on Neural Networks, 1990, pp.1385-1393.
[3] Davis, L., Handbook of genetic algorithms, Van Nostrand Reinhold, NY, 1991.
[4] Hiemstra, Y., “Modeling structured nonlinear knowledge to predict stock market returns”, In Trippi, R. R. (Eds.), Chaos & Nonlinear Dynamics in the financial Markets: Theory, Evidence and Applications, Irwin, 1995, pp. 163-175.
[5] Kohara, K., Ishikawa, T., Fukuhara, Y. and Nakamura, Y., “Stock price prediction using prior knowledge and neural networks”, International Journal of Intelligent Systems in Accounting, Finance and Management, vol. 6, 1997, pp. 11-22.
[6] Kamijo, K. and Tanigawa, T., “Stock price pattern recognition: A recurrent neural network approach‟” Proceedings of the IEEE International Joint Conference on Neural Networks, 1990, pp. 1215-1221.
[7] Kimoto, T., Asakawa, K., Yoda, M. and Takeoka, M., “Stock market prediction system with modular neural networks,” Proceedings of the IEEE International Joint Conference on Neural Networks, 1990, pp. 11-16. [8] Tsaih, R., Hsu, Y. and Lai, C. C., “ Forecasting S&P 500
Stock index futures with a hybrid AI system”, Decision support Systems, 1998, pp. 161-174.
[9] Waksman, G., Sandler, M., Ward, M. and Firer, C., “Market timing on the Johannesburg Stock Exchange using derivative instruments”, Omega, International Journal of Management Science, Vol.25, No. 1, 1997, pp. 81-91.
[10]Trippi, R. R. and DeSieno D., “Trading equity index futures with a neural network,” The Journal of Portfolio Management, 1992.
[11]Duke, L.S. and Long, J., “Neural network futures trading - A feasibility study,” Adaptive Intelligent Systems, Elsevier Science Publishers, 1993.
[12]David de la Fuente, Alejandro Garrido, Jaime Laviada, Alberto Gomez, “Genetic Algorithms to Optimize the Time to Make Stock Market Investment”. GECCO 2006, Vol.2, pp.1857- 1858, 2006