Developing a LabVIEW and MATLAB-based Test
Bed for Data Acquisition, Analysis and Calibration
of Frequency Generators over GPIB
Shehryar Humayun
Institute of Space Technology,Islamabad
Maria Mehmood
Institute of Space Technology,Islamabad
Faran Mahmood
Institute of Space Technology,Islamabad
ABSTRACT
This paper focuses on methods of interfacingLabVIEW with MATLAB package for applicationswhichneed extensive computation as well as automation and control. It aims to integrate MATLAB and LabVIEW together,and develop a calibration software for frequency generators supporting the IEEE-488 bus standard. Different approaches have been explored that can be used to combine the data acquisition features of LabVIEWand computational power of MATLABin presenting the results.
General Terms
GPIB bus protocol, calibration
Keywords
LabVIEW, MATLAB, GPIB
1.
INTRODUCTION
LabVIEW (Laboratory Virtual Instrumentation Engineering Workbench) is based on a dataflow programming language while MATLAB (Matrix Laboratory) isa fourth-generation programming language for performing numerical and computational tasks.
LabVIEW‟s dataflow programming is graphical in nature and is often referred as „G‟. The routines made with this G language are called VIs (Virtual Instruments). The programming interface is based on a “Front Panel”, the part which serves as user interface and “Block Diagram”, the part where various components are joined in a graphical manner to form astructure. Front Panel takes input and gives output. There is also another important feature called as “Connector Panel”. It is used for calling one VI in block diagram of another VI.
The initial focus of LabVIEW was towards measurement, automation and control but with time it incorporated more features, transforming it into a full-fledged software developing environment. The key advantage of using G is its capability of parallel execution [1].
MATLAB is often referred as 4GL (fourth generation Language) as it was developed for a specific purpose, which was obviously matrix operations involving rigorous numerical tasks, which if performed by simple languages like C, C++ etc. can be exhaustive for both the programmer and the computer. The MATLAB was intended originally for complex matrix computations. It also kept on integrating different features toease various engineering disciplines. For example, addition of Simulink was a major step towards graphical modeling in MATLAB.
Using LabVIEW or MATLAB for any specific function depends on the programmer‟s comfort with the software. But
environment to be employed in the other. Such as, a code written in MATLAB can exploit inherit parallel execution of Genvironment. This paper deals with one such case where the calibration of a signal generator is analyzed by combing the two packages via three different approaches.
2.
LITERATURE SURVEY
In [2], [3], [4], the author has demonstrated the use of Mathscript RT module to deploy MATLAB source files on NI platforms. In [5], the author proposed solutions of using LabView for real-time control with MATLAB engine running at the back end. GPIB is discussed in detail in [6], where the author advocates the use of GPIB interface as a preferred choice for instrumentation control.
3.
IMPLEMENTATION
A wide variety of protocols are availableto connect and communicate with different laboratory instruments present. These protocols range from simple serial communication to GPIB, USB, and Ethernet etc. LabVIEW provides the simplest solutionfor communicating with any of these protocols. MATLAB has been traditionally used as anaccepted platform for mathematical manipulation of data. In this paper we are discussing one of the possible options for using LabVIEW for communication purposes. Data is acquired through GPIB protocol. Once data is acquired, we will use the powerful mathematical features of MATLAB for handling that data.
The procedure followedin the paperis that first the data is acquired from the instrument under test and then it is correlatedwith software generated waveforms to find offset errors. LabVIEW interface is used for acquisition of data from the Agilent Oscilloscope via GPIB interface. Due to the high computation power available, the waveform is generated internally with the help of MATLAB at a high sampling rate. This waveform is importedin LabVIEW with the help of three different techniques. These techniques are implemented to be used for the same purpose and then compared to conclude which approach is the best.
4.
THE SYSTEM
4.1
Signal Generator
2. Instek GFG-8210 Function Generator: The Instek generator has a range of 0-10MHz. It can produce ramp, sine and square waveforms.
4.2
Oscilloscope
The signal generated isthen retrievedbyan oscilloscope. The reason for using oscilloscope was the lack of any GPIB/serial port with the available signal generators. Otherwise the signal could have been directly acquired fromsignal generator. Infiniium 54855A oscilloscope by Agilent was used for this purpose. This particular model provided an added advantage of selecting a variable sampling rate.
4.3
Communication Interface
Both serial and GPIB interfaces areavailable to use in the above mentioned oscilloscope. We, however, chose GPIB, also known as IEEE-488 standard. This standard provides 1.8MB/s which well-suited for the data acquisition rate needed. Also the amount of latency in GPIB is quite less as compared to serial.
4.4
Data Acquisition
Once the GPIB connection was established through LabVIEW, the data was acquired and stored in a text file. For acquisition and storage of data, a small code was developed in LabVIEW.
4.5
Processing in MATLAB
After receivingthe sampled data, we processed them on MATLAB. MATLAB was used for data processing because of its ease at mathematical and numerical operations.
5.
CATERING FOR OTHER FACTORS
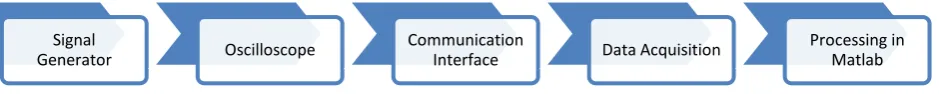
[image:2.595.79.549.320.367.2]To make sure that the error obtained was not due to any source other than calibration difference, the sampling rate, frequency and phase offset of both the oscilloscope and MATLAB was kept same. This is also the main reason to apply correlation algorithm, i.e. to make sure that the error being obtained is not due to some other factor. The error handling is also employed with the help of error handling VIs of LabVIEWwhich would have otherwise been difficult to develop in MATLAB.
Figure 1 : The complete System
6.
SOFTWARE GUIDE
This section is focused on the description of the software that was developed.
6.1
LabVIEW
LabVIEWwas basically used for data acquisition because it has been developed for the purpose of automation, control and acquisition.
6.1.1
The Front Panel
The front panel mainly consists of a display for the acquired waveform. The dial and gauge show the value of the calculated mean square error, whereas, the numeric display depicts the value of the correlation coefficient.
Out of the many signal fidelity methods used for comparison e.g. baseline electric noise comparison, SINAD (signal to noise and distortion) and ENOB (effective number of bits), the method of mean squared error was employed to compare the waveforms because of its simplicity, reliability, convexity and statistic nature.
The correlation has been used to prove the similarity between the two waves i.e. the linear relationship between the two data.
6.1.2
The block diagram
The block diagram consists of three major parts:
6.1.2.1
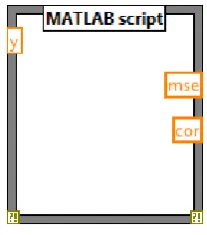
MATLAB Script
This is discussed is section 7.2.6.1.2.2
Data Acquisition sub VI
The subVI for data acquisition has been developed by mainly using the data acquisition VIs provided by Agilent technology. This sub VI initializes the oscilloscope, acquires data and then closes it.
6.1.2.3
Data Storage
For data logging, the samples are saved to a file in standard text format. The code for this has also been developed in LabVIEW. Saving the data allows the user to further analyze and use it for other purposes. It also provides a backup for the data if the program crashes due to unforeseen reasons.
6.2
MATLAB
The MATLAB processors have been used to carry out the extensive numerical computations required to compare the two waveforms.
6.2.1
Mean Square Error
The code of mean square error takes the data of the two waveforms as arrays and applies the formula of mean square error upon them. It then displays the result back in LabVIEW. So, the script function allows easy implementation of the algorithm along with easy import/export of the data.
Mathematically it can be computed with the following formula
𝑀𝑆𝐸 =
(𝑦−𝑦𝑛∗)2:Signal
Generator Oscilloscope
Communication
Interface Data Acquisition
Figure 2: The front panel
6.2.2
Correlation Coefficient
The code of the correlation coefficient employs the command of
R = corrcoef(X)
This command correlates the two arrays obtained by the acquired data and the internally generated data to provide an output correlation coefficient.
Statistically the correlation coefficient can be described by the following formula:
𝑟 = 1
𝑛 − 1 (
𝑥 − 𝑥 𝑠𝑥 ) ∗ (
𝑦 − 𝑦 𝑠𝑦 )
6.2.3
Generation of Reference Signal
The reference signal which is used as abase for comparing he acquired data is generated in MATLAB. This is because we can have a higher sampling rate with MATLAB and signal manipulation is easy. It also avoids the hassle of importing the reference signal to MATLAB script.
7.
THE THREE METHODS
7.1
First Method
To implement the first method, the researchers developed a code in Labview that acquires the waveform from the oscilloscope and generates a waveform in Labview internally using the analog waveform generate VIs.This data was then saved in a text file to be used in MATLAB. The data was imported to MATLAB where the arrays were compared and used to calculate the mean square error and correlation coefficient. The results were then plotted using very simple algorithms.
7.2
Second Method
The second alternative is to use the LabVIEW softwarefor acquiring data only. The internal data is generated using MATLAB script. The mean square error and correlation coefficient are calculated in MATLAB script by using the internal data along with external one.The results were plotted in MATLAB to have a better comparison and analyses.
7.3
Third Method
[image:3.595.367.471.447.565.2]The third method implemented was with the help of the MathScript module. The procedure was the same as with the MATLAB Script.
[image:3.595.362.487.650.770.2]8.
RESULTS AND DISCUSSIONS
The results of the calibration error are not important because they are the same in all cases with only negligible differences. The focus is to obtain the feasibility and comparison between the three methods and conclude that which method is the convenient one.
8.1
Importing Data as text file
This method involved a very time consuming cycle. The data was first obtained using LabVIEW and saved in a text file.This was then imported to MATLAB as a spreadsheet. This is very hectic because the user needs to open one software application after another to complete the process.
From the developers‟ point of view, this method might be easy or less complicated. However it is the least feasible one. Apart from being time consuming it requires a complete understanding of both software and thus requires more time to be spent in the literature survey.
This method involves the use of two software packagesboth of whichplaceextensive load on the processor unit. This means that if the user has a slow processor it might be impractical. The cost factor is also a constraint because both LabVIEW and MATLAB will have to be purchased.
Moreover it does not provide a complete and compact package because it is not very flexible and compatible.
8.2
Using MATLAB script node
This method was found to be better than the one described in section 5.1. This is because the user does not have to open two separate applications to execute the program.This makes it easier for the user and more feasible for the developer as well.
However, it does require licensed MATLAB software to be installed in the computer so that it can be called via the ActiveX node. This makes it a very slow procedure because the user will have to wait a considerable time for a single iteration to execute. Also the user as well as the developer still
has to buy both software packages. As a result, the cost factor is the same as that of the method of importing data as text file.
The main problem that occurs apart from those operations described above is that it cannot be used for real time. The data needs to be saved in some array and then used in MATLAB script node for further processing. This not only makes it slow but requires the use of extra algorithm to store the data temporarily.
8.3
Using Math Script RT
This method uses the in-built Math Script module to utilize the advantages of both Lab VIEW and MATLAB. It is a completely independent module integrated in Lab VIEW and requires no other software. So, it does not invoke the MATLAB processors through ActiveX controlsbecause it can understand around 800 commands. This means that there is no requirement of installing MATLAB.
As a result this method is not only fast but also less costly since it only involves the cost of only one software. The major advantage lies in the fact that it can be used for real time processing. Hence it does not involve the temporary storage of data or any hassle of lossof real time information. Besides the feature of real time processing has also made it much faster.
9.
CONCLUSION
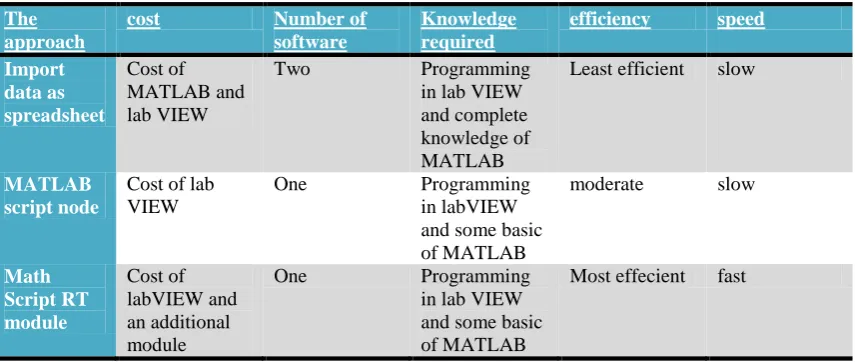
In an attempt to maximize performance, the paper advocates the use of the „right software for the right purpose‟. The use of Lab VIEW for data acquisition and MATLAB for computing in a same program is one of the requirements of many projects and software developers. This paper discussed the development of calibration software by combining the advantageous features of both Lab VIEW and MATLAB using three different methods: importing data to MATLAB via a file, using the MATLAB script node and using the Math Script RT module. The results were discussed on the basis of speed, cost and feasibility. It was found that the use of Math Script RT module is the best option when one needs to integrate the function of MATLAB and Lab VIEW.
The approach
cost Number of
software
Knowledge required
efficiency speed
Import data as spreadsheet
Cost of MATLAB and lab VIEW
Two Programming
in lab VIEW and complete knowledge of MATLAB
Least efficient slow
MATLAB script node
Cost of lab VIEW
One Programming
in labVIEW and some basic of MATLAB
moderate slow
Math Script RT module
Cost of labVIEW and an additional module
One Programming
in lab VIEW and some basic of MATLAB
[image:4.595.86.514.507.688.2]Most effecient fast
10.
ACKNOWLEDGMENTS
We acknowledge the contribution of the professors in our faculty in helping us to write this paper and encouraging us.
11.
REFERENCES
[1] Hans-PetterHalvorsen, 2012. OPC and Real-Time Systems in Lab VIEW.Tutorial.Telemark University College, Norway.
[2] Gary Parente, 2011. Reducing the cost, Simplifying the process. National Instruments.
[3] Robert Berger, 2010. What‟s New in LabVIEW2010.Labview User Group Meeting, Long Island Chapter, National Instruments.
[4] Hans-PetterHalvorsen, 2011. LabVIEWMathScript. Tutorial.Telemark University College, Norway.
[5] Ch. Salzmann, D. Gillet, and P. Huguenin, 1999. Introduction to Real-time Controlusing LabVIEWwith an Applicationto Distance Learning, Swiss Federal Institute of Technology Lausanne, Switzerland.