http://dx.doi.org/10.4236/aces.2015.53037
Adsorption of Benzene in Batch System in
Natural Clay and Sandy Soil
EbuwaI Osagie, Chiedu N. Owabor
School of Energy, Environment and Agri-Food, Cranfield University, Bedfordshire, UK Email: e.i.osagie@cranfield.ac.uk
Received 14 June 2015; accepted 17 July 2015; published 20 July 2015
Copyright © 2015 by authors and Scientific Research Publishing Inc.
This work is licensed under the Creative Commons Attribution International License (CC BY).
http://creativecommons.org/licenses/by/4.0/
Abstract
The adsorption potential of clay and sandy soil to remove benzene from liquid-phase system was examined. A series of batch adsorption tests were carried out for various concentrations of ben-zene (50 - 250 mg/l) in tightly corked 1000 ml flasks for clay and sandy soil, respectively. Equili-brium and kinetics data were obtained from the batch experiments. Adsorption increased with increasing initial benzene concentration. The equilibrium data obtained from the adsorption of benzene were well fitted to the Freundlich isotherm model. The adsorption kinetics process showed that the kinetic model of pseudo second-order was the best fit to the experimental data. The results showed that clay and sandy soil had good potential for the removal of aromatic hy-drocarbon, benzene from aqueous solution.
Keywords
Adsorption, Benzene, Natural Clay, Sandy Soil, Sorption Isotherms
1. Introduction
persis-tent nature of the PAHs, they are also known to be toxic in nature and the toxicity has a structural dependence. The increased risk of lung cancer in cigarette smokers is attributed by the majority of toxicologists and epidemi-ologists to the inhalation of combustion-derived PAHs, at least in part [3]. Statistical analyses of the incidence of cancer by country and other supportive studies suggest a relationship between cancer mortality rates and the production of organic chemicals [4]. Many organic chemicals are known carcinogens and have been ranked by importance: factors such as production, release and volatility [5]. Benzene was ranked by that group as the number one chemical of concern.
PAHs enter the environment mostly as releases to air from volcanoes, forest fires, residential wood burning, and exhaust from automobiles and trucks. They enter surface water through wet and dry atmospheric deposition, hydrocarbon spillages, and industrial effluent discharge, especially from hydrocarbon processing industries (for example coal gasification sites, coking plants, and bitumen and asphalt production plants). Some PAHs depo-sited in soils are also leached into the underground aquifer. The toxicity of PAHs together with their ability to bio-accumulate in aquatic organisms makes it imperative to reduce the level of PAHs in industrial effluents into water bodies. In general, adsorption treatment provides a simple but effective approach for the removal of or-ganic pollutants from the aquatic environment, with activated carbons shown in a number of research works as being a very viable option [6] [7].
In recent times, there has been an increasing interest in utilizing natural clay minerals for the removal of toxic metals, colours and some aromatic organic pollutants from aqueous solutions [8]-[10]. The abundance of natural clay in most continents of the world and its low cost make it a strong candidate as an adsorbent for the removal of many pollutants from wastewaters.
The aim of this study was to explore the possibility of using clay and sandy soil for removing polycyclic aro-matic hydrocarbon (benzene) from aqueous solution. The Langmuir, Freundlich and Tempkin Isotherms were used to analyze the adsorption equilibrium. The sorption rates of adsorbent dosage and adsorbate concentration with time were tested using pseudo first and second order kinetics, respectively. The study hopes to develop a cheap, readily available adsorbent and a viable technology for the removal of recalcitrant PAHs pollutants from the environment. The purpose of this study is to determine the extent of the bioavailability of benzene in clay and sandy soils; this is because benzene poses a potential hazard by ingestion in humans and animals.
1.1. Adsorption Isotherms
An isotherm describes the equilibrium relationship between the adsorbate concentration in the liquid phase and that on the adsorbent’s surface at a given condition. It gives the most appropriate equilibrium correlation [11]. They are also important for comparing biosorption performance, optimization, design and prediction purposes
[12]. The biosorption of benzene on clay and sandy soil was optimized by analyzing equilibrium curve of the following three isotherm models.
a) Langmuir Isotherm: The Langmuir Isotherm [13] developed by Irving Langmuir (1916) was originally used to describe the gas-solid phase and adsorption onto activated carbon but is now extended and generally ap-plied to liquid-solid interaction. The equation is:
1 o e e e Q bC q bC =
+ (1)
where qe (mg/g) and Ce (mg/L) are the solid phase concentration and liquid phase concentration of benzene at equilibrium, respectively. Qo (mg/g) is the maximum sorption capacity and b (L/mg) is the Langmuir constant related to the affinity of the adsorbate for the adsorbent. The linearized form of Equation (1) is given as:
1
e e e o
o
C q C Q
bQ
= + (2)
b) Freundlich Isotherm: The Freundlich Isotherm, [14] relates the solute concentration on the adsorbent sur-face to the solute concentration in the liquid phase. The isotherm assumes that adsorption occurs on a heteroge-neous adsorbent surface (i.e. multilayer adsorption). Freundlich model is represented by the equation;
1 n e f e
Equation (3) can be linearized in logarithmic form, Equation (4) and the Freundlich constants can be deter-mined,
1 lnqe lnkf lnCe
n
= + (4)
where kf and n are the Freundlich constants characteristic of the system. kf and n are indicators of adsorption ca-pacity and adsorption intensity, respectively.
c) Tempkin Isotherm: The Tempkin Isotherm [15] takes into account the interaction between adsorbate and adsorbent and assumes a linear decrease in the heat of adsorption instead of a logarithmic decrease. Tempkin Isotherm is expressed as;
(
)
ln
e T T e
q =RT b A C (5)
which on linearization gives
ln ln
e T e
T T
RT RT
q k C
b b
= +
(6)
Various parameters obtained from Langmuir, Freundlich and Tempkin Isotherms are shown inTable 1.
1.2. Adsorption Kinetics
A kinetic model is a mathematical representation of the rate at which a chemical reaction or process takes place. The rate at which chemical reactions occur varies from very rapid to very slow [16].
Adsorption kinetics is one of the most important parameters for determining the adsorption mechanism and also to investigate the efficacy of adsorbent for the removal of pollutants. Pseudo-first order model [17] and pseudo second order model [18] were used to analyze the kinetic data
The pseudo first order kinetics is given in its linearized form as:
(
)
2 2 2 max
2 R t R r
ρ
σ = ω − (7)
where qe and qt are the amounts of benzene sorbed per unit weight of sorbent at equilibrium and at time t (min), respectively. k1 is the rate constant of the pseudo first order sorption (min−1). The rate constant k1 is obtained from the linear plot of the graph.
[image:3.595.91.545.513.720.2]The pseudo second order rate equation can also be expressed as
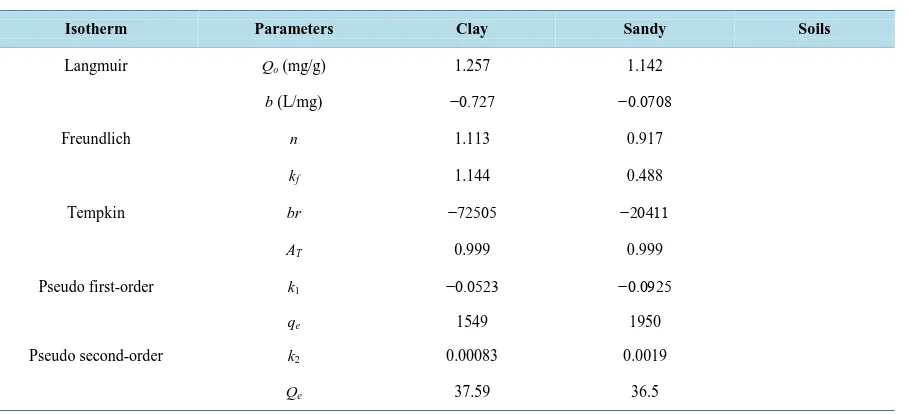
Table 1. Isotherm parameters for the sorption of benzene by clay and sandy soil.
Isotherm Parameters Clay Sandy Soils
Langmuir Qo (mg/g) 1.257 1.142
b (L/mg) −0.727 −0.0708
Freundlich n 1.113 0.917
kf 1.144 0.488
Tempkin br −72505 −20411
AT 0.999 0.999
Pseudo first-order k1 −0.0523 −0.0925
qe 1549 1950
Pseudo second-order k2 0.00083 0.0019
(
)
2 2 2 max2 R t R r
ρ
σ = ω − (8)
the linear plot of this graph gives the slope 1/qe and intercept 1
( )
k q2 e22. Materials and Methods
2.1. Sample Collection and Preparation
Clay and Sandy soil samples used in this study were obtained from Ikpoba River, Benin City, Edo State, Nigeria. On collection, the clay and sandy soil samples were kept separately in double plastic bags to ensure the preva-lence of anaerobic conditions. The samples were stored in a refrigerator for some days and were subsequently analyzed for their PAHs content [19].
Ten gram (10 g) of the clay soil sample was measured and added to a beaker containing 40 ml of a solvent made up of 50% acetone and 50% dichloromethane. The clay soil-solvent mixture was then placed in a sonicator for about 20 minutes to heat it to 70˚C. To the soil-solvent mixture, 10 g of anhydrous sodium sulphate was added and then shaken gently to obtain a clear extract. The content of the beaker was separated leaving only soil in the beaker. The extracted solvent was poured into a conical flask and then put into a rotary evaporator. After evaporation for some minutes, the conical flask was withdrawn from the evaporator and 2 ml of solvent was measured with a pipette and put into vial bottle for analysis using a capillary column Gas Chromatogram equipped with a flame ionization detector (US, EPA, 2004).
For the sandy soil sample, the same procedure as outlined above was repeated. The clay and sand soil samples were washed with distilled water by a process involving agitation and dissolution. The soil samples were soaked in distilled water for two days while continuously stirring using a manual stirrer so as to remove all contami-nants. The mixture was drained using a micro sieve and continuously flushed with distilled water several times. The mixture was then allowed to drain completely and put into a furnace to get heated up at a high temperature to dry the sample. It was subsequently allowed to cool naturally in open air. The sample was then analyzed using a Gas Chromatogram equipped with a flame ionization detector.
The clay and sandy soil samples were analyzed for their physico-chemical properties as shown inTable 2.
2.2. Adsorption Procedure
[image:4.595.95.539.577.720.2]The analyzed clay sandy soil samples were used to carry out adsorption studies using benzene as adsorbate and the Iodine adsorption method was used to determine the surface area of the soil samples. These soil samples were hydrophilic in nature; this can be seen with the amount of moisture content present in them. The adsorption of benzene on clay and sandy soil was determined by carrying out the adsorption studies in tightly corked 1000 ml flasks. For each experiment, 100 ml of benzene solution with different initial concentrations (50 - 250 mg/l) was placed in a flask. The adsorbent capacity for the uptake of benzene at time t, qt (mg/g), was calculated. This was achieved by testing the kinetics to determine the adsorption mechanism using pseudo-first order and pseudo second order adsorption models.
Table 2. Characterization of natural clay and sandy soil (physico-chemical analysis).
Clay soil Sandy soil
pH 5.5 9.0
Moisture content (%) 52 27
Bulk density (g/cm3) 1.624 1.192
Surface area (mg/g) 4.102 3.077
Porosity (%) 14 9
2.3. Effect of Initial Concentration
To determine the effect of adsorbate concentration, the concentration of benzene was varied between 50 to 250 mg/l for 1 g of clay and sandy soil particles, respectively with particle size of 220 μm, added to each flask and kept in a shaker at 120 rpm at room temperature for predetermined equilibrium times of 32 hrs, 26 hrs, 34 hrs, and 22 hrs, 20 hrs, 30 hrs, respectively. Then the samples were filtered and the residual concentration of benzene in the filtrate was analysed using UV-Visible spectrophotometer at maximum wave length of 229 nm for ben-zene.
2.4. Variation of Agitation Time
To determine the effect of agitation time, 250 mg/l concentration was prepared. 100 mls from the 250 mg/l centration was measured and placed in a container. 1 g of soil sample was measured and was added to the con-tainer. The sample was placed in a mechanical shaker for agitation. After 2 hrs the sample was removed, and it was immediately filtered to remove the adsorbent. The equilibrium concentration of the effluent solution ben-zene was measured using the UV spectrophotometer.
2.5. Sorption Isotherms
Effect of varying concentration on the adsorption of benzene.
The effect of the variation of concentration of benzene in an effluent solution is described by using the Langmuir, Freundlich and Tempkin Isotherm models. These isotherms are shown graphically below.
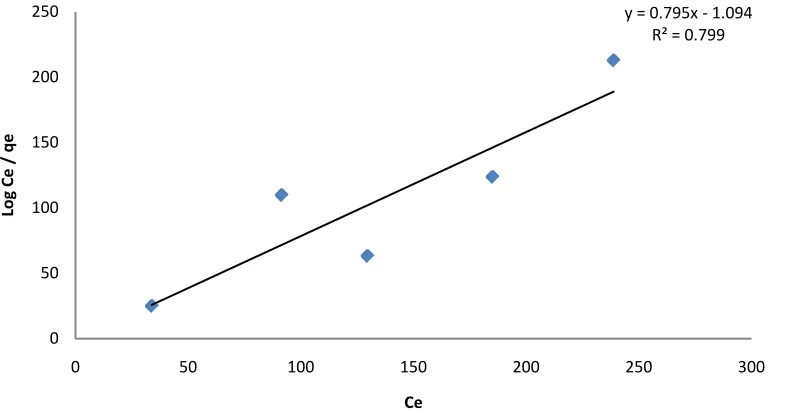
The above graphs show that the equilibrium concentration and the amount of benzene adsorbed increases as the initial effluent concentration increases. The Langmuir, Freundlich and Tempkin Isotherm constants were calculated from the slope and intercepts of the graphs. The linear coefficient of determination, R2 was used as an error function to evaluate the fitness of each isotherm equation to the experimental data obtained from the opti-mization process employed. For the adsorbent clay in Figures 1-3, the Freundlich Isotherm in Figure 5gave the highest correlation coefficient (R2 = 0.8108) followed by the Langmuir isotherm (R2 = 0.7999). The linear coef-ficient of determination for the Tempkin Isotherm was not very high (R2 = 0.014). The graphs show that both the Freundlich and Langmuir Isotherms models can sufficiently describe the adsorption data well for benzene. The fact that the sorption process showed a good fit to the Langmuir Isotherm suggests a finite adsorption capacity and energetically equivalent sites [20].
[image:5.595.121.514.498.705.2]With regards to the adsorbent sandy soil, the graphs inFigures 4-6 show that the Freundlich Isotherm gave the highest correlation coefficient (R2 = 0.9468) followed by the Langmuir isotherm (R2 = 0.9152). The linear coefficient of determination for the Tempkin Isotherm (R2 = 0.1169) was not high. Both the Freundlich and
Figure 1. Langmuir plot for the variation of the concentration of benzene sorption on clay. y = 0.795x - 1.094
R² = 0.799
0 50 100 150 200 250
0 50 100 150 200 250 300
Lo
g
Ce
/
q
e
Figure 2. Freundlich plot for the variation of concentration of benzene sorption with clay.
Figure 3. Tempkin plot of the variation of the concentration of benzene sorption with clay.
Figure 4. Langmuir plot for the variation of concentration of benzene sorption with sandy soil. y = 0.898x + 0.058
R² = 0.801
0 0.5 1 1.5 2 2.5
0 0.5 1 1.5 2 2.5
Lo
g C
e/
q
e
Log Ce
y = -0.034x + 1.530 R² = 0.014
0 0.5 1 1.5 2 2.5
0 1 2 3 4 5 6
qe
Ln Ce
y = 0.875x - 12.37 R² = 0.915
0 50 100 150 200 250
0 50 100 150 200 250 300
Ce
/
qe
[image:6.595.139.500.523.707.2]Figure 5. Freundlich plot for the variation of concentration of benzene sorption with sandy soil.
Figure 6. Tempkin plot for the variation of the concentration of benzene sorption with sandy soil.
Langmuir Isotherms models can sufficiently describe the adsorption data well for benzene in sandy soil. A comparison of the adsorbents clay and sandy soil for the adsorption of benzene indicates from this study that sandy soil sorbed less than clay.
This experimental data for this study best fits the Freundlich model. This is consistent with the work of [21] in which clay adsorbent was best used. The adsorption capacity Qo (mg/g) and energy of adsorption n (mg−1) for benzene are 0.286 (mg/g) and 0.0107 (mg−1), respectively.
2.6. Adsorption Kinetics
Benzene adsorption kinetics onto clay and sandy soil with their respective fits are shown inFigure 7. The graph shows that the variation of concentration with time for benzene sorption in clay and sandy soils took 32 hrs and 22 hrs for equilibrium to be reached for clay and sandy soils, respectively. The graph illustrates that the variation of benzene concentration with time for clay and sandy soils shows a difference of about 10 hrs. Furthermore, the graph shows that there was a steady adsorption of benzene by the two different adsorbents.
The data obtained were analyzed with the Lagergren pseudo first order kinetic model. A plot of ln(qe − qt) against time t (hrs) is shown in Figure 8with the linear equations from clay and sandy soils. It shows that k1 for the pseudo-first order adsorption is −0.256 for sandy soil and 0.0735 for clay. qe which was also obtained from the graph is15.49 mg/g and 19.50 mg/g for clay and sandy soil, respectively. The correlation coefficient (R2) is 0.9273 for sandy soil and 0.7632 for clay, respectively.
The results obtained when the data was subjected to the pseudo-second order equation are shown in Figure 9. y = 1.091x - 0.311
R² = 0.946
0 0.5 1 1.5 2 2.5
0 0.5 1 1.5 2 2.5
Lo
g
Ce
/
q
e
Log Ce
y = -0.122x + 1.931 R² = 0.116
0 0.2 0.4 0.6 0.8 1 1.2 1.4 1.6 1.8
0 1 2 3 4 5 6
qe
Figure 7. Variation of concentration with time for benzene sorption in clay and sandy soil.
Figure 8. Pseudo-first order kinetic data plot for benzene sorption with clay and sandy soil.
[image:8.595.151.481.525.700.2]From the graph in Figure 9, qe is from the slope and k2 is from the intercept. qe values are 37.59 (mg/g) for clay and 36.50 (mg/g) for sandy soil. k2 values are 0.00083 and 0.00190 for clay and sandy soil samples, respectively. Also the correlation coefficients (R2) for this model are 0.5962 for clay and 0.6732 for sandy soil, respectively. The kinetic model that best fitted the experimental data obtained for both clay and sandy soil was the pseudo second order model.
3. Conclusion
The results of the present study indicate that clay and sandy soil have good potential as adsorbents for the re-moval of polycyclic aromatic hydrocarbon, benzene from aqueous solution. The amount of benzene uptake (mg/g) was found to increase with increase in benzene concentration and adsorption time. The results obtained from the plots show that the process of adsorption follows Freundlich Isotherm model for adsorbents, clay and sandy soil. Thus, it can be used to estimate the model parameters. This confirms the fact that Freundlich Iso-therm best explains the adsorption process of benzene from aqueous solution. The maximum loading capacity estimated was 37.59 (mg/g) for clay and 36.50 (mg/g) for sandy soil, respectively. Thus, sandy soil absorbed less than the clay sample. The kinetic model of pseudo second order was the best fit to the data obtained for both clay and sandy soil.
Acknowledgements
Ebuwa I. Osagie thanks the Vice-Chancellor, University of Benin and the Federal Government scholarship pro-gram for the financial support.
References
[1] Fetzer, J.C. (2007) The Chemistry and Analysis of Large PAHs. Polycyclic Aromatic Compounds, 27, 143-162.
http://dx.doi.org/10.1080/10406630701268255
[2] Ritter, L., Solomon, K., Forget, J., Stemeroff, M. and O’leary, C. (1995) A Review of Selected Persistent Organic Pol-lutants. International Programme on Chemical Safety (IPCS). PCS/95.39. World Health Organization, Geneva, Vol. 65, 66.
[3] Band, P.R., Le, N.D., Fang, R. and Deschamps, M. (2002) Carcinogenic and Endocrine Disrupting Effects of Cigarette Smoke and Risk of Breast Cancer. The Lancet, 360, 1044-1049. http://dx.doi.org/10.1016/S0140-6736(02)11140-8
[4] Cross, A.J. and Wiersma, G.B. (1979) Preliminary Analysis of Cancer Rates in Organic Chemical-Producing Counties, Environmental Monitoring and Support Laboratory, Office of Research and Development, US Environmental Protec-tion Agency.
[5] Rogers, R.D., McFarlane, J.C. and Cross, A.J. (1980) Adsorption and Desorption of Benzene in Two Soils and Mont-morillonite Clay. Environmental Science & Technology, 14, 457-460. http://dx.doi.org/10.1021/es60164a005
[6] Cabal, B., Budinova, T., Ania, C.O., Tsyntsarski, B., Parra, J. B. and Petrova, B. (2009) Adsorption of Naphthalene from Aqueous Solution on Activated Carbons Obtained from Bean Pods. Journal of Hazardous Materials, 161, 1150- 1156. http://dx.doi.org/10.1016/j.jhazmat.2008.04.108
[7] Derylo-Marczewska, A., Swiatkowski, A., Biniak, S. and Walczyk, M. (2008) Effect of Properties of Chemically Modified Activated Carbon and Aromatic Adsorbate Molecule on Adsorption from Liquid Phase. Colloids and Sur-faces A: Physicochemical and Engineering Aspects, 327, 1-8. http://dx.doi.org/10.1016/j.colsurfa.2008.05.026
[8] Banat, F., Al-Bashir, B., Al-Asheh, S. and Hayajneh, O. (2000) Adsorption of Phenol by Bentonite. Environmental Pollution, 107, 391-398. http://dx.doi.org/10.1016/S0269-7491(99)00173-6
[9] Koh, S. and Dixon, J.B. (2001) Preparation and Application of Organo-Minerals as Sorbents of Phenol, Benzene and Toluene. Applied Clay Science, 18, 111-122. http://dx.doi.org/10.1016/S0169-1317(00)00040-5
[10] Harris, R.G., Wells, J.D. and Johnson, B.B. (2001) Selective Adsorption of Dyes and Other Organic Molecules to Kao-linite and Oxide Surfaces. Colloids and Surfaces A: Physicochemical and Engineering Aspects, 180, 131-140.
http://dx.doi.org/10.1016/S0927-7757(00)00747-0
[11] Prasad, R.K. and Srivastava, S. (2009) Sorption of Distillery Spent Wash onto Fly Ash: Kinetics and Mass Transfer Studies. Chemical Engineering Journal, 146, 90-97. http://dx.doi.org/10.1016/j.cej.2008.05.021
[12] Ho, Y., Porter, J. and McKay, G. (2002) Equilibrium Isotherm Studies for the Sorption of Divalent Metal Ions onto Peat: Copper, Nickel and Lead Single Component Systems. Water, Air, and Soil Pollution, 141, 1-33.
[13] Langmuir, I. (1916) The Constitution and Fundamental Properties of Solids and Liquids. Part I. Solids. Journal of the American Chemical Society, 38, 2221-2295. http://dx.doi.org/10.1021/ja02268a002
[14] Freundlich, H. (1906) Over the Adsorption in Solution. The Journal of Physical Chemistry, 57, e470.
[15] Temkin, M. and Pyzhev, V. (1940) Kinetics of Ammonia Synthesis on Promoted Iron Catalysts. Acta Physicochimica URSS, 12, 217-222.
[16] Sharma, N. and Nandi, B.K. (2013) Utilization of Sugarcane Baggase, an Agricultural Waste to Remove Malachite Green Dye from Aqueous Solutions.Journal of Materials and Environmental Science, 4, 1052-1065.
[17] Lagergren, S. (1898) About the Theory of So-Called Adsorption of Soluble Substances. Kungliga Svenska Vetenskap-sakademiens Handlingar, 24, 1-39.
[18] Ho, Y. and McKay, G. (1999) Pseudo-Second Order Model for Sorption Processes. Process Biochemistry, 34, 451-465.
http://dx.doi.org/10.1016/S0032-9592(98)00112-5
[19] Redlich, O. and Peterson, D.L. (1959) A Useful Adsorption Isotherm. Journal of Physical Chemistry, 63, 1024-1024.
http://dx.doi.org/10.1021/j150576a611
[20] Hubbe, M.A., Rojas, O.J., Fingas, M. and Gupta, B.S. (2013) Cellulosic Substrates for Removal of Pollutants from Aqueous Systems: A Review. 3. Spilled Oil and Emulsified Organic Liquids. BioResources, 8, 3038-3097.
http://dx.doi.org/10.15376/biores.8.2.3038-3097