http://dx.doi.org/10.4236/jsip.2015.63019
A Comparison of Integer Cosine and
Tchebichef Transforms for Image
Compression Using Variable Quantization
Soni Prattipati
1, M. N. S. Swamy
1, Pramod K. Meher
21Department of Electrical and Computer Engineering, Concordia University, Montreal, Canada 2Institute of Infocomm Research, Singapore City, Singapore
Email: [email protected], [email protected], [email protected]
Received 9 May 2015; accepted 17 July 2015; published 21 July 2015
Copyright © 2015 by authors and Scientific Research Publishing Inc.
This work is licensed under the Creative Commons Attribution International License (CC BY).
http://creativecommons.org/licenses/by/4.0/
Abstract
In the field of image and data compression, there are always new approaches being tried and tested to improve the quality of the reconstructed image and to reduce the computational com-plexity of the algorithm employed. However, there is no one perfect technique that can offer both maximum compression possible and best reconstruction quality, for any type of image. Depending on the level of compression desired and characteristics of the input image, a suitable choice must be made from the options available. For example in the field of video compression, the integer adaptation of discrete cosine transform (DCT) with fixed quantization is widely used in view of its ease of computation and adequate performance. There exist transforms like, discrete Tchebichef transform (DTT), which are suitable too, but are potentially unexploited. This work aims to bridge this gap and examine cases where DTT could be an alternative compression transform to DCT based on various image quality parameters. A multiplier-free fast implementation of integer DTT (ITT) of size 8 × 8 is also studied, for its low computational complexity. Due to the uneven spread of data across images, some areas might have intricate detail, whereas others might be rather plain. This prompts the use of a compression method that can be adapted according to the amount of detail. So, instead of fixed quantization this paper employs quantization that varies depending on the characteristics of the image block. This implementation is free from additional computa-tional or transmission overhead. The image compression performance of ITT and ICT, using both variable and fixed quantization, is compared with a variety of images and the cases suitable for ITT-based image compression employing variable quantization are identified.
Keywords
1. Introduction
In the area of data communication and storage, there is always a struggle to convey the most with the least amount of representation. Image compression in particular, reduces the presence of inherent redundancy and irre-levant details in images to reduce the size of the data needed for representation. Lossy compression is preferred over Lossless compression for applications where a minor loss of quality is acceptable as they pledge high rates of compression. Applications like space research and defense often require huge volumes of video data to be trans-mitted, analyzed and a suitable response triggered instantaneously. This mandates the use of compression tech-niques to accelerate the transmission procedure, which consumes the major portion of the total response time.
In transform-coded compression techniques, the image undergoes transformation before being encoded. The discrete Tchebichef transform (DTT), based on a polynomial kernel derived from discrete Tchebichef polyno-mials (DTPs), was introduced in [1] and was developed later into an orthogonal transform in [2]. The discrete cosine transform (DCT), which originates from the trigonometric representation of the Tchebichef polynomials of the first kind, has its image compression potential exhaustively investigated. Numerous fast DCT algorithms [3]-[5] have been developed and multiple DCT-based compression techniques have been established. DTT exhi-bits energy compaction and de-correlation properties that are very much comparable with those of DCT. For a block size 8 × 8 and correlation coefficient 0.9, the de-correlation efficiencies of DTT and DCT are 97.34% and 97.82%, respectively [6] [7]. The first five diagonal elements of the transformation matrix result in energy packing efficiencies of 97.41% and 97.6% for DTT and DCT, respectively [6] [7]. DTT can be shown to con-form easily to an integer representation without the need for approximation unlike the Integer counterpart of DCT. This reveals that DTT could be a potential competitor to DCT for certain class of images.
Lately, integer approximation of DCT, integer cosine transform (ICT) is gaining popularity thanks to its re-duced computational complexity and growing relevance of integer transforms in general. ICT is being used in high efficiency video coding (HEVC). HEVC provides better video compression performance than H.264/ MPEG-4 AVC does. The implementation algorithm of ICT used in HEVC is in [8]. It can be observed that ICT is not a completely faithful adaptation of the DCT as scaling is involved during the estimation process; however, it has been shown that there is no approximation involved while developing ITT from DTT. Thus, it is of inter-est to compare the compression performance of ITT and ICT for various images and identify cases where ITT is a better choice. This work aims at identifying areas where ITT stands up to be a viable alternative to ICT for lossy image compression based on various image quality assessment parameters. Based on these findings, it would be possible to predict if an image is suited for ITT-based compression or ICT-based compression. An ITT for a block size of 8 × 8 is utilized here, whose computational complexity is compared with that of ICT and is completely multiplier-free.
It is advantageous to further enhance the lossy compression algorithm by including a variable quantization technique thereby ensuring better image quality even at higher compression rates. Quantization is a significant step during the lossy image compression procedure and optimizing it for better performance without an increase in computational complexity is highly desirable. It is unusual for an image to have a homogenous distribution of data all over. As a result, selecting a distinct quantization matrix optimized for each individual image block is appealing, but it would require transmitting the quantization information along with each block of the image. This significant transmission overhead defeats the very purpose of compression. In [9], a predefined collection of quantization matrices were maintained at the transmitter and the receiver to avoid transmitting the entire quantization matrix along with each image block. However, this seriously hinders the flexibility of operation as the user is restricted to a pre-determined set of quantization matrices. For instance, the image block might be robust enough to withstand higher quantization, which might not be supported at the receiver. Depending on the type of images being compressed, the receiver might need to be updated periodically to ensure the adequacy of the quantization set. This predicament can be avoided by making the procedure truly adaptive and allowing the user a wider choice of quantization matrices without any additional transmission overheadby using a special en-coding technique. This work evaluates the performance of ITT with respect to that of ICT for compression of some special images using the novel variable quantization technique.
The simulated results of compression for a variety of images are presented and interpreted. Finally, Section 5 contains the conclusions.
2. Discrete Tchebichef Polynomial and Transform
Transforms refer to conversion of signals between different domains like time and frequency. The representation of a signal in multiple domains makes it suitable for various applications like compression, analysis, detection, filtering, etc. There are different popular discrete transforms like discrete cosine, discrete Fourier, discrete wavelet and discrete Hartley transforms. Each of these transforms represents the signal in varied domains, bringing out specific innate characteristics which are suitable for different applications.
Discrete signals can be denoted using linear combination of sinusoidal or complex exponential sequences. Thus polynomials which are orthogonal in particular, are widely employed to represent the signals in view of their efficient data fitting and approximation abilities. Some of the popular discrete orthogonal polynomials are Hahn, Meixner, Krawtchouk and Charlier.
Discrete Tchebichef polynomials (DTP) [6] [7] [10] are the class of hyper geometric orthogonal polynomials associated with the distribution dα(n) of Stieltjes type, where α(n) is a step function with unit jumps at support points n=0,1,,N−1. They are a special case of Hahn polynomial, which is a classic discrete orthogonal po-lynomial and a discrete analog of the popular Jacobi popo-lynomial.
If Δ is the forward difference operator, the DTP is defined by the difference formula
( )
! k for 0,1, , 1k
n n N
t n k k N
k k
−
= ∆ = −
(1)
where tk
( )
n is the kth Tchebichef polynomial.DTP exhibits important properties like orthogonality, recurrence and normalization which can be used to de-fine a related transfer function τ
( )
k n, where k and n correspond to the indices of the frequency and time components, respectively, as shown in [9] [10].Properties of DTP
A. Orthogonality: DTPs are orthogonal with respect to a unit weight function
( ) ( )
(
)
1 0
,
N
k m km
n
t n t n
δ
d k N−
=
=
∑
(2)where tk(n) and tm(n) are the k
th
and mth Tchebichef polynomials, respectively, and d(k,N) is the squared norm of the DTP defined as
(
)
1( )
20
,
N
k n
d k N t n
−
=
=
∑
(3)The squared norm of the DTP can also be written as
(
,)
(
2 1)(
2 22) (
2 2)
2 1
N N N N k
d k N
k
− − −
=
+
(4)
B. Direct Representation: DTP can be evaluated using the closed form expression
( )
( )
0
1
! 1
k k i k
i
N i k i n
t n k
k i k i
− =
− − +
= −
−
∑
(5)C. Recurrence Relation: DTPs satisfy a three-term recurrence relation given by
( )
( )
( )
(
2(
)
2)
( )
1 1 2
2 1 1
1
k k k
k k
t n t n t n N k t n
k − k −
− −
= − − −
(6)
for k≥2 with t0
( )
n =1, t n1( )
=2n− +N 1. This formula is useful for a fast evaluation of polynomials of higher degrees.D.Symmetry: The DTP satisfies the symmetry property
(
1) ( ) ( )
1kk k
E. Normalization of the DTP: The system defined in (1) is orthogonal. Every orthogonal system can be norma-lized by replacing tm
( )
x by( )
1 2
m m m
t ⋅t − t x [10], where . is the scalar product. In view of (3), ortho-normal DTP, denoted by τk
( )
n , is given by( )
( )
(
,)
k k
t n
n
d k N
τ = (8)
As a consequence, the recurrence relation in (6) may be rewritten for orthonormal DTPs in the form [2]
( ) (
1 2)
1( )
3 2( )
k n a n a k n a k n
τ = + τ − + τ − (9)
With
( )
( ) (
)
(
)
0 1 2
1 3
, 2 1
1
n n n N
N N N
τ
=τ
= + −− where
(
)
2 22 2
1 2 2 2 2 2 3 2 2
1
2 4 1 1 4 1 1 2 1
, ,
3 2 3
N k
k N k k k
a a a
k k k
N k N k N k
− −
− − − − +
= = = ⋅
−
− − −
From the discrete Tchebichef polynomial and its various properties, a discrete Tchebichef transform (DTT) is derived.
In the DTT domain, the transformed sequence, Y(k), of an input data sequence, x(n), is given by
( )
1( ) ( )
0
, for , 0,1, , 1
N
n
Y k
τ
k n x n k n N−
=
=
∑
= − (10)where τ
( )
k n, is the orthogonal basis of DTP denoted as τk( )
n in (8) over an interval[
0,N−1]
and whose values can be obtained from the recurrence relation in (9). In the above equation, k and n denote frequency and time indices, respectively.The inverse DTT restores the input data when applied to the transform coefficients and is given by
( )
1( ) ( )
0
, for , 0,1, , 1
N
k
x n
τ
k n Y k k n N−
=
=
∑
= − (11)For a 2-D input sequence x (n1,n2), the 2-D DTT of order N × M is defined as
(
)
(
) (
) (
)
1 2
1 1
1 2 1 1 2 2 1 2
0 0
, , , ,
N M
n n
Y k k τ k n τ k n x n n
− −
= =
=
∑ ∑
(12)for k n1, 1=0,1,,N−1 and k n2, 2=0,1,,M−1. The inverse 2-D DTT is given by
(
)
(
) (
) (
)
1 2
1 1
1 2 1 1 2 2 1 2
0 0
, , ,
,
N M
k k
x n n τ k n τ k n Y k k
− −
= =
=
∑ ∑
(13)for k n1, 1=0,1,,N−1 and k n2, 2=0,1,,M−1
All the properties of DTP discussed are applicable to DTT as well.
3. Integer Tchebichef Transform
Floating-point operations preserve full-precision value, but at the cost of increased resource consumption. Moreover, floating-point operations are not defined in all processors. Integer operations offer increased compu-tational speed as well as decreased complexity, cost and power consumption. This sub-section, discusses an in-teger Tchebichef transform of size 8 × 8, which greatly reduces the computational complexity.
Framework for Integer Transform Representation:The 2-D DTT of input data X, of size N × N given by (12), can also be expressed in the form below
′ =
( )
( )
(
,)
p k q k
d k N
= (15)
where
( )
(
)
(
)
! for 1
! 1 for 0, 2, 4, 6
! for 3, 5, 7
k k k
p k k k k
k N k k
= = + = − =
and d(k, N) is the squared norm of the DTP given by
(
,)
(
2 1)(
2 22) (
2 2)
2 1
N N N N k
d k N
k − − − = + (16)
Let
Q
be a “N × N” diagonal matrix with q(k) given in (15) as the diagonal element of the kth row. It is possible to express the transformation matrix τ asˆ
=Q
τ τ (17)
1 ˆ=Q−
τ τ (18)
Hence evaluating (18) by substituting the values of τ from (9) and
Q
for N = 8 results in1 1 1 1 1 1 1 1
7 5 3 1 1 3 5 7
7 1 3 5 5 3 1 7
7 5 7 3 3 7 5 7
ˆ
7 13 3 9 9 3 13 7
7 23 17 15 15 17 23 7
1 5 9 5 5 9 5 1
1 7 21 35 35 21 7 1
− − − − − − − − − − − − = − − − − − − − − − − − − − − − −
τ (19)
Consequently, from (17), the transform of (14) may be written as
( ) ( )
ˆ
ˆ
′
(
ˆ
ˆ
′
)
=
=
Y
Q
τ
X Q
τ
Q
τ τ
X
Q
(20)By utilizing the properties of a diagonal matrix, the above equation can be expressed as
(
ˆ ˆ′)
ˆ=
Y τ τX Q (21)
where
represents element-by-element multiplication and ˆQ. ˆQ can be obtained by multiplying as
(
)
1(
)
1ˆ diagonal elements of diagonal elements of
N× ×N
= ×
Q Q Q (22)
For N = 8, ˆQ is given by 2
0 0 1 0 2 0 3 0 4 0 5 0 6 0 7
2
0 1 1 1 2 1 3 1 4 1 5 1 6 1 7
2
0 2 1 2 2 2 3 2 4 2 5 2 6 2 7
2
0 3 1 3 2 3 3 3 4 3 5 3 6 3 7
2
0 4 1 4 2 4 3 4 4 4 5 4 6 4 7
2
0 5 1 5 2 5 3 5 4 5 5 5 6 5 7
0 6 1 6 2
ˆ
q q q q q q q q q q q q q q q
q q q q q q q q q q q q q q q
q q q q q q q q q q q q q q q
q q q q q q q q q q q q q q q
q q q q q q q q q q q q q q q
q q q q q q q q q q q q q q q
q q q q q q
= Q
2
6 3 6 4 6 5 6 6 6 7
2
0 7 1 7 2 7 3 7 4 7 5 7 6 7 7
q q q q q q q q q
q q q q q q q q q q q q q q q
In (21),
(
τ τˆXˆ′)
represents the ITT, as the transformation matrixτ
ˆ is entirely composed of integers as seen in (19). The matrix multiplication with the input must be carried out in a manner as computationally less intensive as possible. The 1D ITT of input “X” is given by( )
τˆX . The elements of matrix “τ
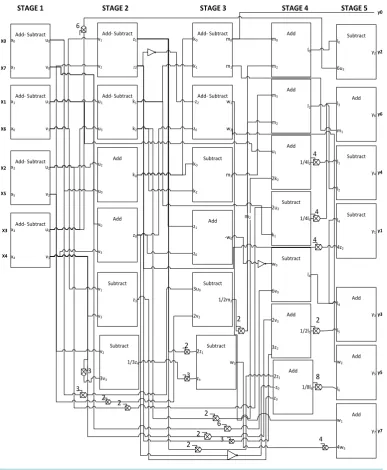
ˆ“ for size N = 8 are given by (19). The corresponding 1D transformation Y for an input X of size 8 can be obtained by following the steps in Table 1. [image:6.595.121.509.239.710.2]It can be observed that the process is carried out predominantly by add and subtract operations, thereby re-ducing the number of multiplication operations which are computationally more intensive. The only multiplying coefficients that appear in the proposed implementation are 2, 3, 4, 6 and 8. The computational complexity can be further decreased by realizing the remaining multiplication operations by a series of shift and add operations as shown in Table 2.
Figure 1 shows a 5-stage architectural structure for ID ITT designed following the multiplier-free
implemen-tation described in this Section.
Figure 1. Architectural diagram of 1D integer DTT.
v0 u0 x7 x0 Add- Subtract v1 u1 x6 x1 Add- Subtract v2 u2 x5 x2 Add- Subtract v3 u3 x4 x3 Add- Subtract Z2 z1 v2 v1 Add- Subtract k2 k1 u3 u1 Add- Subtract k0 u0 u2 Add z0 v3 v0 Add z3 v3 v1 Subtract X0 X7 X1 X6 X4 m1 m0 k1 k0 Add- Subtract w2 w1 z0 -z2 Add- Subtract m3 k2 k0 Subtract 1/2m2 2v2 3u0 Subtract -w0 z0 z1 Add 3 2 2 l0 m2 m0 Add l1 m2 m3 Add 1/4l2 2k2 u1 Add 2 1/4l3 k1 2u2 Subtract 2 l4 6v0 w0 Subtract 6 1/2l5 3z2 2v3 Add 2 3 z3 1/8l6 -z0 2z1 Add 2 m2 X2 X5
X3 y1
4z2 l4 Subtract 4 y2 6u3 l0 Subtract 6 4 4 y4 l2 l1 Subtract y6 m1 l3 Add
2 y3
l5
l4
Add
8 y5
l6 w2 Add 1/3z4 3v3 v2 Subtract 3 w3 z4 2z1 Subtract 2 3 y7 4w3 w1 Add 4 y0 y2 y6 y4 y1 y3 y5 y7
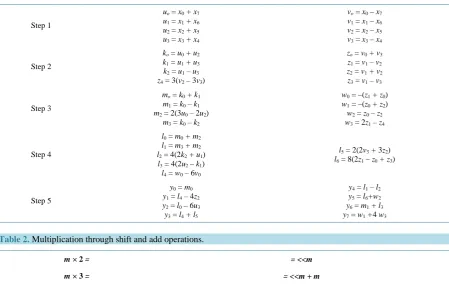
Table 1. 1D multiplier-free fast ITT.
Step 1
uo = x0+x7
u1 = x1+x6
u2 = x2+x5
u3 = x3+x4
vo = x0 – x7
v1 = x1 – x6
v2 = x2 – x5
v3 = x3 – x4
Step 2
ko = u0+u2
k1 = u1+u3
k2 = u1–u3
z4 = 3(v2– 3v3)
zo = v0+v3
z1 = v1–v2
z2 = v1+v2
z3 = v1–v3
Step 3
mo = k0+k1
m1 = k0–k1
m2 = 2(3u0– 2u2)
m3 = k0–k2
w0 = –(z1+z0)
w1 = –(z0+z2)
w2 = z0–z2
w3 = 2z1–z4
Step 4
l0 = m0+m2
l1 = m3+m2
l2 = 4(2k2+u1)
l3 = 4(2u2 – k1)
l4 = w0– 6v0
l5 = 2(2v3+ 3z2)
l6 = 8(2z1 – z0+z3)
Step 5
y0 = m0
y1 = l4– 4z2
y2 = l0 – 6u3
y3 = l4+l5
y4 = l1–l2
y5 = l6+w2
y6 = m1+l3
[image:7.595.88.538.97.386.2]y7 = w1+4 w3
Table 2. Multiplication through shift and add operations.
m × 2 = = <<m
m × 3 = = <<m + m
m × 4 = = <<<<m
m × 6 = = << (<<m + m)
m × 8 = = <<<<<<m
The 2-D DTT can be computed efficiently by using the proposed 1-D implementation first along the rows and then along the columns in two steps by using the separability property of the DTT as shown below.
( )
(
)
ˆXˆ′ = ˆ ˆX ′ ′
τ τ τ τ (23)
The element-by-element multiplication between the ITT, namely,
(
τ τˆXˆ′)
and factorization matrix ˆQ in (22), is incorporated into the quantization stage.4. Variable Quantization
The transformation of the image data is followed by the crucial step of “quantization” in lossy image compres-sion during which each block of the transformed image is divided by a quantization matrix and the result is rounded off to nearest integer leading to better compression, but loss of accuracy as well. The quantization ma-trix employed in image compression using JPEG standard with cosine transform of size 8 × 8 is fixed and is given by [10]. Depending upon the level of compression desired, the fixed quantization matrix is multiplied by a quantization factor. Higher the quantization factor, higher is the amount of compression achieved. In conven-tional JPEG compression the entire image is quantized with the resulting matrix. As a result, all the blocks of the image have the same accuracy level which might not always be the best choice.
For variable quantization, the image blocks need to be differentiated as robust or sensitive to quantization based on their characteristics. The sensitive blocks are quantized with a smaller quantization matrix, whereas the resilient ones are quantized with a strong matrix,thus improving the quality of the image.
compared with a threshold can help in determining if the block is strong enough to withstand high levels of quantization. It is possible to maintain multiple thresholds and quantize each image block that satisfies a thre-shold condition with the corresponding matrix. To decompress the image, each block needs to be de-quantized using the same matrix with which it was quantized.
If the nzp of the image block is less than the threshold, it is deemed to be robust and the elements of the al-ready quantized block are quantized by an additional factor. This factor is always chosen to be a multiple of “2”, i.e., 2p (p = 1, 2, 3..), such that the additional quantization i.e., division, can be accomplished by “p” simple right shift operations.If none of the threshold conditions are met then “p” is set to “0” and no additional quantization is carried on the block. Thus, “p = 0” indicates the corresponding image block to be sensitive to quantization as shown in Figure 2.
For the current set of images chosen, the focus is to achieve high compression with least possible error. It has been found that the threshold value of “15” along with p = 1, i.e., an additional quantization factor of “2”, gives the best results in an 8 × 8 matrix. Hence, if the last non-zero element position of a transformed image block af-ter being quantized with fixed quantization matrix is less than “15”, then all the elements of the already quan-tized block undergo a single right shift to be additionally quanquan-tized by factor “2”. If the condition is not satisfied, there is no additional quantization. Thus, the blocks robust to quantization undergo double the quantization than the sensitive blocks.
However, it must be noted that without the variable quantization information, the receiver cannot distinguish the blocks that underwent additional quantization from the normal blocks. Thus, the variable quantization factor needs to be transmitted along with the compressed data to ensure faithful reconstruction. This can be achieved by the encoding technique described below.
Encoding: The block resulting from quantization is rearranged into a linear sequence and is subjected to en-coding to reduce the amount of information to be transmitted. Usually, run length encoding (RLE) is employed which could be followed by any other encoding technique to further condense the data if desired.
Conventional RLE takes advantage of the fact that image data after transformation and quantization has sig-nificant number of zeros. RLE encodes by giving only the non-zero elements of the sequence. Each non-zero element (E) is preceded by the number of zeros (Z) before itself in the sequence. End of the sequence is signified by setting both Z and E to zero. It can be seen that (E) can never be zero unless it is the end of the sequence.
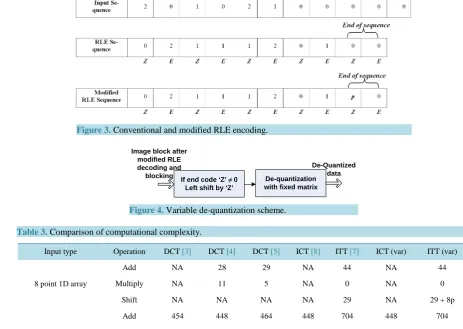
In the modified RLE scheme, the last two codes (Z and E) at the end of block sequence, not only indicate the end of the block, but also its corresponding quantization factor. So at the end of the block sequence, E is set to zero indicating end of sequence and Z is set to “p” giving the variable quantization code. Figure 3 is a compari-son of the outcomes of conventional and modified RLE carried on a data sequence.
At the decoder, the block is reconstructed and the variable quantization code “p” is identified as (Z) whose corresponding (E) is set to zero at the end of the sequence. The resulting block undergoes “p” left shifts which is equivalent to being multiplied by “2p” before being de-quantized with the fixed matrix as shown in Figure 4.
Table 3 gives a comparison of the arithmetic complexity of the proposed fast ITT with those for the fast
DCTs in [3]-[5] and ICT in [8]. It also presents the arithmetic complexity when variable quantization is used for ICT and ITT.
[image:8.595.200.429.667.704.2]The crucial observation of the comparison in Table 3 is that the computationally intensive multiplication op-erations are completely eliminated by using the proposed ITT implementation for both 1D and 2D cases. There is a minor increase in the number of addition operations for ITT when compared to the rest of the approaches. Additionally, ITT employs shift operations which are not used by the other implementations. The nominal in-crease in complexity arising from an inin-crease in the number of addition and shift operations for ITT is justified by the elimination of multiplication operations which consume more resources. It is seen that the variable quan-tization technique demands only an increase in the number of shift operations to compensate for the improved compression performance. The minor increase in computational complexity due to increase in the number of shift operations can be totally justified by the increased compression achieved with no additional bit transmis-
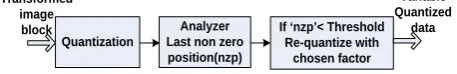
Figure 2. Variable quantization scheme. Quantization
Transformed image
block Analyzer
Last non zero position(nzp)
If ‘nzp’< Threshold Re-quantize with
chosen factor
Variable Quantized
Figure 3. Conventional and modified RLE encoding.
[image:9.595.90.540.328.445.2]Figure 4. Variable de-quantization scheme.
Table 3. Comparison of computational complexity.
Input type Operation DCT [3] DCT [4] DCT [5] ICT [8] ITT [7] ICT (var) ITT (var)
8 point 1D array
Add NA 28 29 NA 44 NA 44
Multiply NA 11 5 NA 0 NA 0
Shift NA NA NA NA 29 NA 29 + 8p
8 point 2D array
Add 454 448 464 448 704 448 704
Multiply 94 176 144 352 0 352 0
Shift 6 NA NA 128 464 128+64p 464 + 64p
In the above table, “2p” is the quantization factor for the image block and (var) represents transform with variable quantization.
sion by using variable quantization.
For the purpose of comparison between ITT and ICT, compression and decompression of image blocks of size 8 × 8 are carried out using a scheme similar to the one followed by Joint Photographic Expert Group (JPEG) format [11] as shown in Figure 5and Figure 6, respectively.
5. Simulation
MATLAB software is chosen to simulate the image compression scheme illustrated in Section IV using both ITT and ICT with and without variable quantization. A variety of input images are selected to analyze and com-pare the compression results obtained using the two transforms. The quality of compression achieved for an im-age depends as much on its spatial and frequency content as on the technique adopted for compression. Meas-ures like spectral activity measure (SAM) and spatial frequency measure (SFM) are employed to assess the structural nature of the image [12]. SAM gives a measure of image predictability in the spectral domain, and is defined as the ratio of the arithmetic mean to the geometric mean of the DFT coefficients.
It is given by
( )
( )
{
}
2 1 1
0 0 1 2 1 1
0 0
1
, SAM
,
M N
i j
M N M N
i j
F i j M N
F i j
− −
= =
− − ⋅
= =
⋅
=
∑ ∑
∏ ∏
(24)
where M and N are the numbers of pixels in the horizontal and vertical directions and F (i, j) is the (i,j)th DFT
If end code ‘Z’ ≠ 0 Left shift by ‘Z’ Image block after
modified RLE decoding and
blocking De-quantization
with fixed matrix
Figure 5. Compression scheme.
Figure 6. De-Compression scheme.
coefficient of the original image
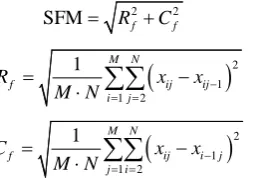
SAM of an image is directly proportional to the predictability of the image and has a dynamic range of [1,∞). SFM indicates the overall activity level in a picture, defined by the row frequency, Rfand the column frequen-cy, Cf.
It is given by
2 2
SFM= Rf +Cf (25)
(
)
21 1 2
1 M N
f ij ij
i j
R x x
M N = = −
= −
⋅
∑∑
(26)(
)
21 1 2
1 M N
f ij i j
j i
C x x
M N = = −
= −
⋅
∑∑
(27)where, xij represents the (i,j)thpixel value of the original image and M and N are the numbers of pixels in the horizontal and vertical directions.SFM is directly proportional to the number of high frequency components in the image.
In general, images with a large SFM and a small SAM are difficult to code, since they have high frequency content and are not very predictable.
The level of compression of the image is varied by adjusting the factor multiplying the quantization matrix used during the quantization phase of the compression. If the factor is high, the quality of the compression de-creases, whereas the amount of compression increases. In order to rate the performance of the different com-pression techniques, comcom-pression performance curves are plotted between the evaluation parametersPSNR vs. bpp (bits per pixel) and RMSE vs. CR (compression ratio). In the PSNR vs. bpp plots, the higher the curve the better is the performance, whereas in the RMSE vs. CR plots, the lower the curve the better is the quality of compression.
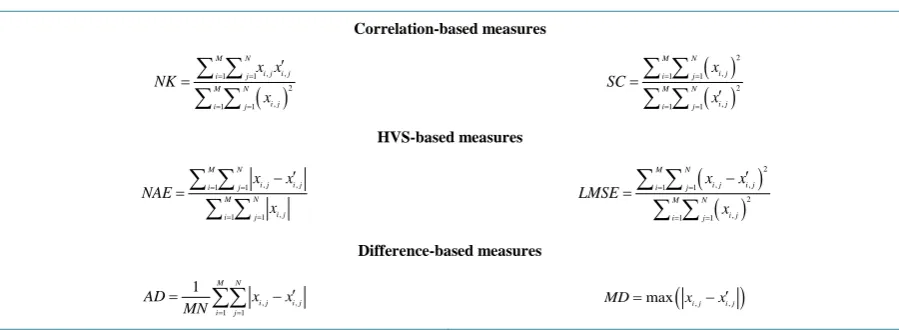
In [12] [13], the authors have proposed a set of quality parameters composed of objective measurements for picture quality evaluation which are expressed as in Table 4.
Ideally, when the reconstructed image is a close replica of the input image before compression, the correla-tion-based measures (NK, SC) should be close to unity, whereas the Human Visual System (HVS)-based meas-ures (NAE, LMSE) and the difference-based measmeas-ures (AD, MD) should be close to zero.
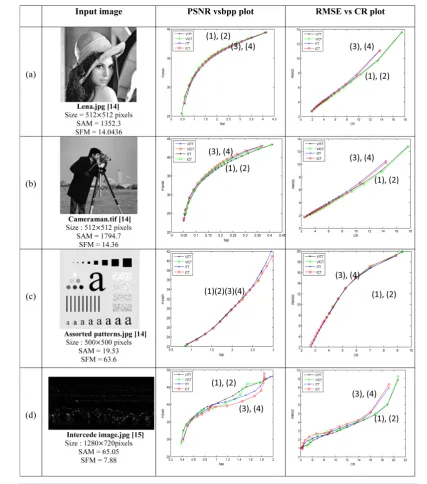
By varying the quantization factor, the image is subjected to different levels of compression. The PQE meas-ures as well as the performance evaluation measmeas-ures are calculated at each level of compression. Using the per-formance plots of PSNR vs. bpp and RMSE vs. CR along with the PQE measures, compression for each of the input images is interpreted. In the performance plots in Figure 7, the curves (1) and (2) in black and green cor-respond to ITT and ICT based compression techniques with variable quantization, whereas curves (3), and (4) in blue and red correspond to ITT and ICT based compression techniques with fixed quantization respectively A. Lena
The popular image of Lena [14] has medium predictability and considerable amount of spectral activity. The PSNR and RMSE plots of ITT are almost overlapping with those of ICT in both the variable and non variable quantization cases. It can also be noted that the compression evaluation parameters, namely, CR and bpp are better for variable quantization. The rest of the quality evaluation measures discussed in Table 4 are not too
Transform Original
image block
Quantization
Rearrange (Zig-Zag pattern) (2D block
à1D Sequence)
Encoding Encoded
data
Decoding Encoded
data
Inverse Transform Rearrange
(Zig-zag pattern) (1D Sequence
à2D block)
De-Quanization
[image:10.595.248.379.294.383.2]Figure 7. Various images with their compression performance plots.
deviant from their ideal values except for MD. There is an increase in MD when images are compressed with variable quantization using ITT or ICT. However, this can be ignored since an increase in MD does not neces-sarily mean overall poor quality of the image. From the RMSE vs. CR plot of Figure 7(a) it can be observed that RMSE curve for compression using variable quantization is significantly lower than that with normal quan-tization. Similarly, from the PSNR vs. bpp plot of Figure 7(a) it is observed that the PSNR is higher at higher compression levels with variable quantization using either ITT or ICT than that with normal quantization. From this analysis, it can be inferred that compression using variable quantization is beneficial for images with mod-erate predictability and considerable frequency content.
B. Cameraman
Table 4. Objective PQE measures. Correlation-based measures
( )
, , 1 1 2 , 1 1 M N i j i j i j M N i j i j x x NK x = = = = ′ =∑ ∑
∑ ∑
( )
( )
2 , 1 1 2 , 1 1 M N i j i j M N i j i j x SC x = = = = = ′∑ ∑
∑ ∑
HVS-based measures , , 1 1 , 1 1 M N i j i j i j M N i j i j x x NAE x = = = = ′ − =∑ ∑
∑ ∑
(
)
( )
2 , , 1 1 2 , 1 1 M N i j i j i j M N i j i j x x LMSE x = = = = ′ − =∑ ∑
∑ ∑
Difference-based measures , , 1 11 M N i j i j i j
AD x x
MN = =
′
=
∑∑
− MD=max(
xi j, −xi j′,)
Note: xi,j and x'i,j represent the (i, j)th pixel value of the original and reconstructed images, respectively. M is the number of rows in the image; N is the number of columns in the image.
for ITT and ICT, except that the difference parameters, namely, AD and MD of ICT are marginally better than that of ITT. So it can be inferred that ICT offers a slightly better compression performance than ITT.
It can also be noticed from the same plots that compression with variable quantization offers better results than that with fixed quantization using either ITT or ICT. It can also be stated that variable quantization offers a wider range of compression, without much deterioration in quality than that offered by standard quantization, as can be observed from the corresponding RMSE vs. CR plot. Thus, it can be deduced that a better compression performance can be attained by using variable quantization for images with considerable frequency content and ICT over ITT for images with high predictability.
C. Assorted Patterns
The assorted patterns image [14] has low SAM indicating unpredictability. It is observed that though the cor-relation-based measures and the HVS-based measures are close to their ideal values, they are not as close as they were for the more predictable images using either ITT or ICT. Similarly, the AD and MD values are also higher which can be attributed to the lower predictability of the image. It can be observed from Figure 7(c) that the RMSE plot of ITT is lower than that of ICT, whereas the PSNR plot is higher indicating a better quality of com-pression.
The plots also indicate that compression using variable quantization is very similar to that obtained using normal quantization as the curves for variable and non-variable quantization based compression overlap for ITT as well as ICT. This can be attributed to the high SFM value of the image, which indicates the presence of intri-cate detail. So abiding by the law of variable quantization, the majority of blocks cannot withstand high levels of quantization and so undergo usual quantization. Thus, it can be stated that variable quantization and standard quantization based compression techniques yield similar results for images with high SFM and that ITT-based compression is superior to that of the ICT-based compression.
D.Intercede image
The intercede image given in Figure 7(d) is the difference between two concurrent frames of a video of horses running in a beach [15]. As the image has less predictability, the PQE parameters are slightly deviant from their ideal parameters at high rates of compression. At any given CR, it can be observed from Figure 7(d)
that the RMSE of ITT is lower than that of ICT and the PSNR curve of ITT is above that of ICT over a major range of bpp. Hence, it is logical to deduce that ITT is a better choice over ICT for compression of the image.
6. Conclusions
In this work, ITT of size 8 × 8 has been realized using a multiplier-free fast implementation and its complexity has been shown to be less than that of popular fast DCT and ICT implementations. The nature of images more suited for compression using ITT and using ICT have been identified based on their SFM and SAM characteris-tics. Through simulations it has been shown that the compression performance of ITT is about the same as that of ICT in most of the cases. Though the compression performance of ITT can be slightly inferior to that of ICT for images with high predictability (SAM), it provides a better performance than ICT does for images with low SAM, as illustrated for inter-coding images (Figure 7(d)). This could find a major application in the field of video compression where the concept of interceding is used.
The performances of ITT and ICT with and without variable quantization have also been compared using the PQE parameters and the performance curves. When variable quantization is employed, the image blocks are discriminated based on their sensitivity to quantization. The blocks that are robust to quantization undergo dou-ble the quantization than the rest of the blocks. The additional computational complexity resulting from making the quantization variable has been shown to be negligible involving just a shift operation. The transmission overhead resulting from the requirement to transmit the variable quantization information has been avoided by the modified run length encoding that has been introduced. It has been found that the performance of variable quantization-based compression is either superior to or on par with that of the standardized compression tech-nique for the images analyzed. Images with low or moderate frequency content were found to profit the most from variable quantization. This results in a better quality reconstructed image for a given compression ratio when variable quantization is employed. It can also be interpreted that higher compression ratios are possible for a fixed level of expected quality in the reconstructed image when variable quantization is used.
While the strength of fast DCT designs lie in exploiting trigonometric properties, fast ITT designs can be de-veloped by manoeuvring its polynomial properties. Since polynomial theory is very well-dede-veloped, there is a possibility of developing more efficient ITT implementations.
The variable quantization technique proposed can be further enhanced by differentiating the image blocks into more than two sets based on their sensitivity to quantization. Further research may be carried out to optimize the threshold value used to distinguish between the image blocks based on the type of image being compressed.
Acknowledgements
This work was supported by the Natural Sciences and Engineering Research Council (NSERC) of Canada and the Regroupement strategique en Microelectronique du Quebec (ReSMIQ), and is based on an invited paper presented at the Ninth International Conference on Information, Communications and Signal Processing, Tainan, Taiwan, December 2013.
References
[1] Mukundan, R., Ong, S.H. and Lee, P.A. (2001) Image Analysis by Tchebichef Moments. IEEE Transactions on Image Processing, 10, 1357-1364. http://dx.doi.org/10.1109/83.941859
[2] Nakagaki, K. and Mukundan, R. (2007) A Fast 4 × 4 Forward Discrete Tchebichef Transform Algorithm. IEEE Signal Processing Letters, 14, 684-687.
[3] Feig, E. and Winograd, S. (1992) Fast Algorithms for the Discrete Cosine Transform. IEEE Transactions on Signal Processing, 40, 2174-2193. http://dx.doi.org/10.1109/78.157218
[4] Loeffler, C., Ligtenberg, A. and Moschytz, G.S. (1989) Practical Fast 1-D DCT Algorithms with 11 Multiplications.
IEEE International Conference on Acoustics, Speech, and Signal Processing, 2, 988-991. http://dx.doi.org/10.1109/icassp.1989.266596
[5] Arai, Y., Agui, T. and Nakajima, M. (1988) A Fast DCT-SQ Scheme for Images. Transactions-IEICE, E-71, 1095- 1097.
[6] Ishwar, S., Meher, P.K. and Swamy, M.N.S. (2008) Discrete Tchebichef Transform—A Fast 4 × 4 Algorithm and Its Application in Image/Video Compression. IEEE International Symposium on Circuits and Systems, Seattle, 18-21 May 2008, 260-263. http://dx.doi.org/10.1109/ISCAS.2008.4541404
[8] (2011) Joint Collaborative Team on Video Coding (JCT-VC) of ITU-T SG16 WP3 and ISO/IEC JTC1/SC29/WG11 7th Meeting, Geneva, 21-30 November 2011, 21-30.
[9] Kakarala, R. and Bagadi, R. (2009) A Method for Signalling Block-Adaptive Quantization in Baseline Sequential JPEG. IEEE TENCON, Singapore City, 23-26 January 2009, 1-6.
[10] Mukundan, R. (2006) Transform Coding Using Discrete Tchebichef polynomials. Proceedings of IASTED Internation-al Conference on VisuInternation-alization Imaging and Image Processing, Palma de Mallorca, Spain, 29-31 August 2006, 270- 275.
[11] Pennebaker, W.B. and Mitchell, J.L. (1992) JPEG Still Image Data Compression Standard. Kluwer Academic Publish-ers, Norwell.
[12] Grgic, S., Mrak, M. and Grgic, M. (2001) Comparison of JPEG Image Coders. Proceedings of 3rd International Sym-posium on Video Processing and Multimedia Communications, VIPromCom-2001, Zadar, Croatia, 13-15 June 2001, 79-85.
[13] Eskicioglu, A.M. and Fisher, P.S. (1995) Image Quality Measures and Their Performance.IEEE Transactions on Com- munications, 43, 2959-2965. http://dx.doi.org/10.1109/26.477498
[14] (2013) Digital Image Processing Database. http://www.imageprocessingplace.com/root_files_V3/image_databases.htm