Haq, I. and Irving, J.A. and Faull, S.V. and Dickens, J.A. and Ordóñez, A.
and Belorgey, D. and Gooptu, Bibek and Lomas, D.A. (2013) Reactive centre
loop mutants of -1-antitrypsin reveal position-specific effects on intermediate
formation along the polymerization pathway. Bioscience Reports 33 (3), pp.
499-511. ISSN 0144-8463.
Downloaded from:
Usage Guidelines:
Please refer to usage guidelines at
or alternatively
Reactive centre loop mutants of
α
-1-antitrypsin
reveal position-specific effects on intermediate
formation along the polymerization pathway
Imran HAQ*1, James A. IRVING*1, Sarah V. FAULL*, Jennifer A. DICKENS*, Adriana ORD ´O˜NEZ*,
Didier BELORGEY*2, Bibek GOOPTU† and David A. LOMAS*3,4
*Department of Medicine, University of Cambridge, Cambridge Institute for Medical Research, Wellcome Trust/MRC Building, Hills Road, Cambridge CB2 0XY, U.K., and †Institute of Structural and Molecular Biology, Birkbeck, University of London, London, U.K.
Synopsis
The common severe Z mutation (E342K) ofα1-antitrypsin forms intracellular polymers that are associated with liver
cirrhosis. The native fold of this protein is well-established and models have been proposed from crystallographic and biophysical data for the stable inter-molecular configuration that terminates the polymerization pathway. Despite these molecular ‘snapshots’, the details of the transition between monomer and polymer remain only partially understood. We surveyed the RCL (reactive centre loop) ofα1-antitrypsin to identify sites important for progression,
through intermediate states, to polymer. Mutations at P14P12and P4, but not P10P8or P2P1, resulted in a decrease
in detectable polymer in a cell model that recapitulates the intracellular polymerization of the Z variant, consistent with polymerization from a near-native conformation. We have developed a FRET (F¨orster resonance energy transfer)-based assay to monitor polymerization in small sample volumes. Anin vitroassessment revealed the position-specific effects on the unimolecular and multimolecular phases of polymerization: the P14P12region self-inserts early during
activation, while the interaction between P6P4 and β-sheet A presents a kinetic barrier late in the polymerization
pathway. Correspondingly, mutations at P6P4, but not P14P12, yield an increase in the overall apparent activation
energy of association from∼360 to 550 kJ mol−1.
Key words: cirrhosis, emphysema, FRET, intermediate, polymerization, serpin
Cite this article as: Haq, I., Irving, J.A., Faull, S.V., Dickens, J.A., Ord´o˜nez, A., Belorgey, D., Gooptu, B. and Lomas, D.A. (2013) Reactive centre loop mutants ofα-1-antitrypsin reveal position-specific effects on intermediate formation along the polymerization pathway. Biosci. Rep.33(3), art:e00046.doi:10.1042/BSR20130038
INTRODUCTION
The serine protease inhibitor (serpin) superfamily plays import-ant roles in controlling a wide range of proteolytic cascades [1]. A serpin in its inhibitory form can be viewed as a metastable folding intermediate that converts to an extremely stable state on proteo-lytic cleavage of an exposed ‘RCL’ (reactive centre loop), as summarized inFigure 1(A). This transition forms the basis of the serpin inhibitory mechanism [2]. Point mutations that perturb the balance between metastable and stable states result in dis-eases, termed serpinopathies, in which ordered polymers are
re-. re-. re-. re-. re-. re-. re-. re-. re-. re-. re-. re-. re-. re-. re-. re-. re-. re-. re-. re-. re-. re-. re-. re-. re-. re-. re-. re-. re-. re-. re-. re-. re-. re-. re-. re-. re-. re-. re-. re-. re-. re-. re-. re-. re-. re-. re-. re-. re-. re-. re-. re-. re-. re-. re-. re-. re-. re-. re-. re-. re-. re-. re-. re-. re-. re-. re-. re-. re-. re-. re-. re-. re-. re-. re-. re-. re-. re-. re-. re-. re-. re-. re-. re-. re-. re-. re-. re-. re-. re-. re-. re-. re-. re-. re-. re-. re-. re-. re-. re-. re-. re-. re-. re-. re-. re-. re-. re-. re-. re-. re-. re-. re-. re-. re-. re-. re-. re-. re-. re-. re-. re-. re-. re-. re-. re-. re-. re-. re-. re-. re-. re-. re-. re-. re-. re-. re-. re-. re-. re-. re-. re-. re-. re-. re-. re-. re-. re-. re-. re-. re-. re-. re-. re-. re-. re-. re-. re-. re-. re-. re-. re-. re-. re-. re-. re-. re-. re-. re-. re-. re-. re-. re-. re-. re-. re-. re-. re-. re-. re-. re-. re-. re-. re-. re-. re-. re-. re-. re-. re-. re-. re-. re-. re-. re-. re-. re-. re-. re-. re-. re-. re-. re-. re-. re-. re-. re-. re-. re-. re-. re-. re-. re-. re-. re-. re-. re-. re-. re-. re-. re-. re-. re-. re-. re-. re-. re-. re-. re-. re-. re-. re-. re-. re-. re-. re-. re-. re-. re-. re-. re-. re-. re-. re-. re-. re-. re-. re-. re-. re-. re-. re-. re-. re-. re-. re-. re-. re-. re-. re-. re-. re-. re-. re-. re-. re-. re-. re-. re-. re-. re-. re-. re-. re-. re-. re-. re-. re-. re-. re-. re-. re-. re-. re-. re-. re-. re-. re-. re-. re-. re-. re-. re-. re-. re-. re-. re-. re-. re-. re-.
Abbreviations used:ANS, 8-anilinonaphthalene-1-sulfonic acid; bis-ANS, 4,4-dianilino-1,1-binaphthyl-5,5-disulfonic acid; FRET, F¨orster resonance energy transfer; NTA, nitrilotriacetic acid; RCL, reactive centre loop; SI, stoichiometry of inhibition; Tm,midpoint of thermal denaturation.
1These authors contributed equally to this work.
2Present address: Universit´e de Strasbourg, Ecole Europ´eenne de Chimie, Polym`eres et Mat´eriaux (ECPM), Laboratoire de Chimie Biorganique et M´edicinale, UMR CNRS 7509,
F-67087 Strasbourg, Germany.
3Present address: Faculty of Medical Sciences, University College London, Maple House, 149 Tottenham Court Road, London W1T 7NF, U.K. 4 To whom correspondence should be addressed (email [email protected]).
tained within the endoplasmic reticulum of the cell of synthesis [3], and aggregate as inclusions associated with toxicity and cell death [4]. The archetypal serpinopathy isα1-antitrypsin defi-ciency, in which the affected individuals can develop neonatal hepatitis and cirrhosis and early onset emphysema [5].
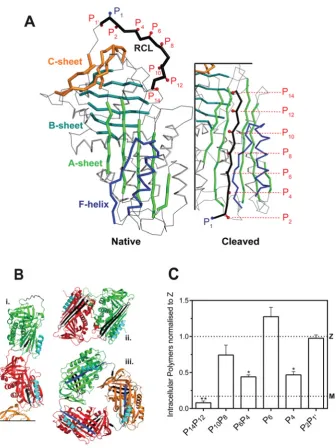
Figure 1 RCL mutants ofα1-antitrypsin
(A) The location of the mutations used in this study are indicated against a cartoon representation of wild-typeα1-antitrypsin
(prepared using PyMol and PDB entries 1QLP [42] and 1EZX [43]). The RCL is highlighted in black, and numbered according to the P-site convention of Schechter and Berger [28], in which the P1and P1positions are either side of the site of cleavage by a cognate protease. The threeβ-sheets of the serpin fold and the F-helix are labelled. Upon transition from the native, active conformation (left panel) to the cleaved or latent forms, the RCL moves from an exposed to an inserted position as an additionalβ-strand ofβ-sheet A (right panel). (B) The three main models of polymerization: i, a molecular model of a loop-sheet polymer; ii, the crystal structure of a closed dimer of antithrombin; iii, a closed trimer ofα1-antitrypsin. The site
of inter-molecular interaction in each form is shown in black and helix F is coloured cyan. (C) Mutations at positions P14P12,
P6P4and P4of the RCL reduce intracellular polymerization of Zα1-antitrypsin. COS-7 cells were transiently transfected with
Mα1-antitrypsin, Zα1-antitrypsin and RCL mutants on a Zα1-antitrypsin background in serum-free medium for 24 h before
lysis. A sandwich ELISA analysis of intracellular polymers made use of the polymer-specific 2C1 monoclonal antibody. The results are normalized to Zα1-antitrypsin (n=4; mean+−S.D.) and differences were assessed by one-way ANOVA with
Bonferroni’s correction for multiple comparisons: *,P<0.01; **,P<0.001. The value for Mα1-antitrypsin is shown
self-associates (P) or is converted into a monomeric inactive form (L) [14–16]:
M↔ Ipol ↓
L
+Ipol
−−−→P
During the activation to intermediate, there is a change in far-UV circular dichroic signal, intrinsic tryptophan fluorescence, the interaction with ANS (8-anilinonaphthalene-1-sulfonic acid) or bis-ANS (4,4-dianilino-1,1-binaphthyl-5,5-disulfonic acid) dyes [14,17], ion mobility mass spectrum collision cross-sectional area [18] and NMR cross-peaks [19]. While denaturant can induce polymerization at concentrations that favour popula-tion of an unfolding intermediate state (Idenat) [6,20], observations indicate that there are multiple pathways favoured depending on the manner in which polymers are formed, and as a result intermediate ensembles represented by Ipol and Idenat could be structurally distinct [19]. In support of this, it has recently been shown that polymers produced in the presence of denaturant lack an epitope that is expressed on polymer obtained from patient samples [18,21]. Given this diversity it is unsurprising that there are currently three main models for the terminal polymer that differ from one another in fundamental respects (Figure 1B). The RCL-to-β-sheet A linkage ‘loop-sheet’ model, supported by a considerable amount of biophysical data [2,6,8,10,22], has recently been joined by two models that are based on crystal structures of self-terminating oligomers: a circular dimer of an antithrombin mutant with an RCL-strand 5Aβ-hairpin domain swap [23], and a circular trimer ofα1-antitrypsin formed in the presence of an engineered disulfide bond with a triple strand 1C– 5B–6B domain swap [24]. The extent of the regions exchanged in these latter two structures has led to the proposal that the cor-responding polymerization intermediates will involve substantial unfolding of some secondary structure elements.
While the main polymer models disagree in the nature of the inter-molecular linkage, they all predict an expanded 6-strand β-sheet A with RCL residues accommodated in the equivalent positions to that seen in the canonical cleaved conformation. This is consistent with the observation thatα1-antitrypsin polymeriza-tion can be induced or blocked by incorporapolymeriza-tion of an exogenous peptide mimic of the RCL intoβ-sheet A [6,25,26]. The evidence therefore substantively implicates the RCL as a critical compon-ent of the mechanism of polymerization, while the extcompon-ent of RCL insertion during intermediate (Ipol) formation varies between the most parsimonious interpretations of the different models: partial or none in the case of the loop-sheet and theβ-hairpin forms, and full insertion in the triple-strand model.
In order to assess the relative contribution of different RCL po-sitions toIpol, we replaced the residues that are accommodated by β-sheet A in the cleaved and latent forms (P14, P12, P10,. . ., P1) with aspartic acid [12] (Figure 1A). We determined the effect of these mutations on the rate of activation to the intermediate state by monitoring changes in tryptophan fluorescence, CD and bind-ing to bis-ANS, and we report a novel FRET (F¨orster resonance energy transfer)-based polymerization assay.
Reconciliation of the results with features that are common to the three extant models of the polymer form reveals details of the pathway. An early structural transition, detectable by change in CD, precedes partial insertion of the P14P12residues intoβ-sheet A. The interaction of the P6P4residues withβ-sheet A – whether in an inter- or intra-molecular fashion – occurs late in the polymerization pathway and presents an energetic barrier to polymerization.
The observation that polymerization in mammalian cells can be blocked by mutation of the P6P4and P14P12sites suggests that,
in vivo, polymerization occurs from a state with intact strands 3A and 5A ofβ-sheets A, and strands 2B, 3B and 4B ofβ-sheets B. It is therefore concluded that most likely polymerization oc-curs from a near-native form rather than a substantially unfolded intermediate.
EXPERIMENTAL
Plasmid generation for the expression of recombinantα1-antitrypsinin vitroand in cell culture
The pQE-30 and pQE-81L plasmids (Qiagen) containing the ‘wild-type’ (M allele) α1-antitrypsin ORF with the C232S mutation (introducing N-terminal vector-derived amino acids MRGSHHHHHHT and MRGSHHHHHHTDPHASSVP, re-spectively) were used to express recombinantα1-antitrypsin [27]. The C232S substitution obviates the need for reducing agent in the assay buffer and was used as the control forin vitro experi-ments (ATC232S). This variant has been found to behave in an equi-valent fashion to wild-type in the previous studies (for example [22]). Reactive loop mutants were prepared on the C232S back-ground using aspartic acid-scanning mutagenesis [12] to generate T345D, A347D, G349D, M351D, L353D, A355D, P357D and S359D substitutions (corresponding with RCL positions P14, P12, P10, P8, P6, P4, P2 and P1 in subsite notation [28]), yielding in combination the variants P14P12, P10P8, P6P4, P2P1, P6 and P4. The pcDNA plasmid containing the Z (E342K)α1-antitrypsin allele was used as the basis for the mutants in cell culture exper-iments [29].
Cell culture, transfection and lysis
Escherichia coliexpression and purification of recombinantα1-antitrypsin
Plasmids containing wild-type and mutated Mα1-antitrypsin on a C232S background were transformed into SG13009/pREP4 cells and BL21 (DE3) cells (Novagen) for 30 and pQE-81L-based constructs, respectively. Recombinant proteins were expressed and purified as described previously [30] before buf-fer exchange into 20 mM Tris, 100 mM NaCl, pH 7.4 and stor-age at −80◦C. The resulting proteins were assessed by SDS-and non-denaturing PAGE, CD spectra, thermal stability SDS-and for their ability to inhibit bovineα-chymotrypsin. The different N-terminal extensions produced by the pQE-30 and pQE-81L ex-pression systems generatedα1-antitrypsin with the same thermal stability, secondary structure (as evaluated by CD), inhibitory kinetics and ability to form polymers as described previously [14,21,31].
Thermal denaturation assay
The stability ofα1-antitrypsin was investigated by thermal denat-uration in the presence of a 5×concentration of SYPRO Orange dye solution (Life Technologies) in 50 mM Na2HPO4/NaH2PO4 buffer, pH 7.4, at a final protein concentration of 0.1 mg/ml and in a 20μl volume [32]. Protein samples were heated from 25 to 95◦C at a rate of 1◦C min−1 in three separate experiments on an Applied Biosystems 7900HT quantitative real-time PCR in-strument, and the fluorescence in the 625–630 nm bins recorded. The midpoint of denaturation (Tm) was reported as the temperat-ure at which the first derivative of fluorescence intensity against temperature reached a maximum.
Assessment of inhibitory activity ofα1-antitrypsin
Bovineα-chymotrypsin (Sigma) was titrated using 4-nitrophenyl acetate [33]. The SI (stoichiometry of inhibition) of wild-type and mutants ofα1-antitrypsin was determined by incubation of the protein for 30 min at room temperature with 0.5μM bovine α-chymotrypsin in 20μl protease assay buffer (20 mM Tris, 100 mM NaCl, 0.1 % (w/v) PEG 8000, 10 mM CaCl2, pH8.0). 180μl of 200μM N-succinyl-Ala-Ala-Pro-Phe-p-nitroanilide substrate (Sigma) was added and the rate of absorbance increase at 405 nm was recorded for 5 min using a ThermoMax plate reader (Molecular Devices). Linear regression was used to extra-polate the amount of inhibitor required to completely abrogate enzyme activity. The association rate constant of inhibitor with enzyme (kass) was measured by reaction progress curves under pseudo-first-order conditions for 4 h at 25◦C with a final con-centration of 5–600 nM inhibitor, 200μM substrate and 0.5 nM bovineα-chymotrypsin. Data analysis was as described previ-ously [34].
CD analysis
All far-UV spectra were obtained using a Jasco J-810 spectro-polarimeter with a 0.2 mm pathlength cell. Samples were dia-lysed into 10 mM Na2HPO4/NaH2PO4, pH 7.4 and adjusted to
0.5 mg/ml prior to analysis. Scanning was performed between 260 and 180 nm at a rate of 50 nm/min, a 0.1 nm pitch and 1 s response time, with averaging of four spectra per experiment. A thermal shift assay to evaluate the effect of the ATTO-NTA (nitrilotriacetic acid) fluorescent probes (described below) was undertaken by monitoring the CD of the sample at 222 nm in a 2 mm pathlength cuvette, as the sample was heated from 5 to 95◦C at a rate of 1◦C min−1. The unimolecular activation as-say used 0.1 mg ml−1 protein in 20 mM Na2HPO4/NaH2PO4, pH 7.4, heated at 55◦C in a 10 mm pathlength cell while monit-oring the output at 222 nm. Data were normalized as a proportion of the starting signal before fitting in Prism (GraphPad) to a two-phase exponential equation of the form
It =1−Be−k1,cdt −Ce−k2,cdt (1)
whereBandCare pre-exponential factors,k1,cdis the apparent rate of the early transition under the conditions of the assay and
k2,cdis the calculated rate of the late transition.
Polymerization kinetics monitored by FRET
A microplate assay was developed in which the rate of polymer formation was determined by monitoring FRET between Ni-NTA (nickel-nitrilotriacetic acid)-conjugated 550 and ATTO-647N fluorescent probes (Sigma). These dyes are recruited from solution to interact non-covalently with the hexahistidine tag of the variants, and as such it is not possible to measure labelling efficiency; coupled with the heterogeneous nature of polymeriza-tion, no inference was therefore made as to the physical distance between fluorophores.α1-Antitrypsin was diluted to 0.1 mg/ml in polymerization buffer (10 mM Na2HPO4/NaH2PO4, 0.1 M so-dium chloride, 0.1 % (w/v) PEG8K, pH 7.4) containing a pool of 2–8μM ATTO-550-Ni-NTA and 2–8μM ATTO-647N-Ni-NTA probes. The ratio of fluorescence intensity of the donor and ac-ceptor fluorophores was followed for 8–18 h at 50, 55 and 60◦C. Change in fluorescence was monitored for 20μl samples us-ing an Applied Biosystems 7900HT quantitative PCR instrument (which uses a 488 nm laser to excite the donor) and the ratio of the emitted fluorescence in the 645–660 to 550–600 nm bins was monitored. FRET efficiency increased to a plateau value; in some cases this was followed by a gradual decrease interpreted as precipitation or secondary change in polymer characterist-ics. Data were normalized as a proportion of the initial FRET value; it was determined empirically that an overall increase of less than 5 % corresponded with a lack of polymerization. As described in the Results section, it was found that best numer-ical stability was obtained for the fit, using Prism (Graphpad), of the integrated second-order rate equation for homogeneous reactants following truncation of the data below 25 % of the total signal:
Ft F0
=A
1− 1
1+kapp.frt
+1 (2)
whereFt denotes the ratio of acceptor to donor fluorescence (a
efficiency, Ais a scaling factor andkapp,fr is the apparent rate constant under the conditions of the assay. For recording of full FRET spectra at room temperature, a SpectraMax M5 plate reader (Molecular Devices) was used, with excitation at 520 nm and monitoring emission between 550 and 725 nm with 4–10 nm intervals.
Polymerization monitored by the change in intrinsic tryptophan fluorescence
A LS55B spectrofluorimeter (Perkin Elmer) fitted with a Peltier module was used to measure fluorescence ofα1-antitrypsin at constant temperature in polymerization buffer. Samples were di-luted 200–800-fold into pre-heated buffer to give an 800μl final volume in a 4 mm×10 mm stirred quartz cuvette. Samples were excited at 290 nm and the emission was measured at 340 nm, with 3 nm widths, and the PMT voltage adjusted as appropriate. The resulting curves were fitted using a single exponential equation of the form:
It =A+B(1−e−kapp,flt) (3)
in whichIt is the fluorescence intensity at timet,Bis the
pre-exponential factor,Athe baseline signal andkapp,flthe apparent rate of polymerization under the conditions of the assay.
Monitoring the formation of an activated intermediate using bis-ANS
This experiment was conducted both in a microplate format using a SpectraMax M5 (Molecular Devices) plate reader and in a cu-vette format using an LS55B spectrofluorimeter (Perkin Elmer). In both cases, polymerization buffer containing 10μM bis-ANS and 0.1μM fluorescein was pre-heated, samples diluted at least 20-fold, and measurement was initiated immediately. Final mi-croplate well volume was 200μl overlaid with 50μl VaporLock and cuvette volume was 800μl; excitation was at 390 nm and emission at 480 nm, with 2.5 nm/5 nm slit widths on the LS55B and fixed 9 nm/15 nm bandwidths on the M5 instrument. The fluorescein was used as a passive reference to correct for light path anomalies in the microplate assay and detected by excit-ing at 480 nm and readexcit-ing the emission at 520 nm; the bis-ANS measurement was normalized against this value. Curves were fit to a single exponential equation.
RESULTS AND DISCUSSION
RCL mutants affect the accumulation of intracellular Zα1-antitrypsin polymers
While the precise role of the RCL in polymerization is conten-tious, its fundamental importance has been shown consistently in many studies [2,6,8,10,22–24]. The extant models of polymeriz-ation (Figure 1B) predict burial of at least some of the residues in the P14to P4region, and it has been found that oligomerization is
blocked by peptides spanning P7-P2[35,36] with the critical sites of interaction found to be P6and P4[37]. All models anticipate an interaction – inter- or intra-molecular – that is consistent with the positions of the inserted RCL residues in accordance with the canonical cleaved conformation (Figure 1A). We sought to probe the role of different RCL residues in the formation of polymers. Accordingly, four double mutants (P14P12, P10P8, P6P4and P2P1) and two single mutants (P6and P4) were generated.
It is clear that the cellular machinery affects the polymeriz-ation processin vivo, as approximately 70 % of synthesized Z α1-antitrypsin is degraded by endoplasmic reticulum-associated degradation [38]. In order to explore the effect of the mutants in this context, they were investigated using a COS-7 cell model that expresses the common severe Z mutant (E342K) of α 1-antitrypsin. Cells were transiently transfected with pcDNA-based constructs to induce expression, and grown for 24 h before harvest; expressed protein levels were evaluated by sandwich ELISA.
The results revealed that while there was no significant dif-ference in total intracellularα1-antitrypsin, the mutants exhib-ited marked variation in the accumulation of intracellular α 1-antitrypsin polymers (Figure 1C), as detected by the 2C1 mono-clonal antibody [21]. Substitutions at P14P12, P6P4 and P4 led to a marked decrease in polymer levels, but the reduction seen with the P10P8 variant did not reach statistical significance, and for the P6and P2P1loop mutants, the intracellular polymer bur-den was equivalent to the Zα1-antitrypsin control. Notably, the P6P4and P4variants showed an equivalent repression of polymer-ization, demonstrating a lack of additive effect between the P6 and P4positions. Overall, these data suggest that during polymer-ization of the Z variant within the ER, the P10–P6positions rep-resent a partition between two functionally distinct RCL regions, which potentially exert different effects on the polymerization mechanism.
Mutations within the RCL exert a minimal effect on overall stability
In order to explore in detail the effect of the mutations on the polymerization ofα1-antitrypsin, the variants were produced us-ing anE. coliexpression system. The control protein used in all
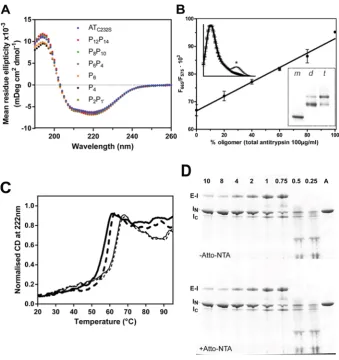
Figure 2 Characteristics of the mutants and heat-induced polymerization monitored by FRET
(A) Assessment of the integrity of wild-type and reactive loop mutants by CD. CD spectra of the reactive loop mutants, at 0.5 mg/ml in 10 mM Na2HPO4/NaH2PO4pH7.4, recorded between 260 and 190 nm, show a similar profile to that of
the wild-type protein. The spectra are the average of at least four independent experiments. (B) Monomer and samples containing predominantly dimer or trimer were separated by gel filtration of polymerized material using a Superdex 200 column (inset gel). Different ratios of the oligomer fractions were mixed with monomer such that the total concentration of each sample was 0.1 mg/ml, and combined with 4μM NTA-ATTO550 and 4μM NTA-ATTO647N. The ratio of fluorescence at 665 nm to that at 575 nm upon excitation at 488 nm was recorded. The measurements shown are from two separate experiments, each using the two different oligomer preparations. The FRET signal varied inversely with the amount of monomer on non-denaturing PAGE. A linear relationship between oligomer concentration and FRET signal is in keeping with previous biophysical studies ofα1-antitrypsin polymerization [14]. Inset fluorescence spectra, normalized for the
emission maximum of ATTO550, show a distinct FRET peak (indicated by an asterisk ‘*’) for recombinantα1-antitrypsin
heated at 60◦C for 10 min in the presence of 4μM NTA-ATTO550 and 4μM NTA-ATTO647N dyes, but not for the unheated control or in the absence of either dye. (C) A 600μl sample of recombinantα1-antitrypsin (thick lines) or plasma antitrypsin
(thin lines) at 0.1 mg/ml in 10 mM Na2HPO4/NaH2PO4, 100 mM NaCl in the presence (unbroken lines) or absence (broken
lines) of 4μM NTA-ATTO550/4μM NTA-ATTO647N was heated from 20 to 95◦C at a rate of 1◦C min−1in a Jasco-J810
spectropolarimeter and the ellipticity at 222 nm measured across a 2 mm pathlength. Values were scaled to occur between 0 and 1.0; curves shown are the average of two experiments and error bars indicate the difference between the duplicate measurements. The midpoint of denaturation of recombinantα1-antitrypsin in these buffer conditions is 59.6+−0.1◦C
in the absence of the reporter dyes and 58.0+−0.4◦C in the presence of the dyes, and the respective midpoints for the plasma protein are 64.0+−0.1 and 63.8+−0.1◦C. (D) 2μgα1-antitrypsin (lane A) was combined with different molar
ratios of bovineα-chymotrypsin (indicated by numbers at the top of the gel) in chymotrypsin assay buffer for 15 min at room temperature. Samples were mixed with SDS loading buffer without boiling and separated on an SDS/PAGE(4–12 % gel) bis-Tris PAGE, and visualized by Coomassie Brilliant Blue. The position of theα1-antitrypsin–bovineα-chymotrypsin
Figure 3 Characterization of the FRET assay
(A) The FRET-based polymerization assay was conducted using different concentrations of ATC232Sat 55◦C in the presence
of 2μM dyes, and the resulting rate constants,kapp,fr, were plotted. (B) The rate of polymerization reported by the FRET
assay varied as a function of dye concentration. Linear regression of the natural logarithm of the apparent rate constant,
kapp,fr, permitted extrapolation of the rate in a dye-free solution, shown for the control (ATC232S) protein at 50, 55 and 60◦C.
Each data point is the result of at least three independent experiments and error bars show the standard error of the mean. (C) Polymerization progress curves for recombinant controlα1-antitrypsin and loop variants at 55◦C were corrected
for the effect of the NTA-ATTO dyes on apparent rate, as described in the text, and averaged. Samples were prepared at a concentration of 0.1 mg/ml in polymerization buffer with 2–8μM NTA-ATTO550 and NTA-ATTO647N. Fluorescence was monitored continuously on an ABI 7900HT instrument upon excitation with the 488 nm laser and the FRET efficiency calculated; the normalized values are shown as the fraction of polymerized material present in the sample.
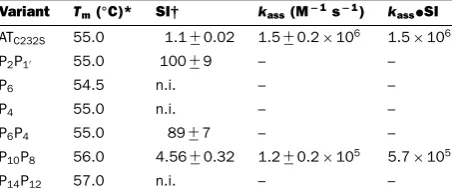
Table 1 Biophysical and biochemical characteristics of recombinant wild-type and RCL mutants ofα1-antitrypsin
Variants were assessed for their midpoint of denaturation, SI and asso-ciation rate constant (kass) against bovineα-chymotrypsin. The results
are the mean of at least three independent experiments. n.i., non-in-hibitory (less than 1 % residual innon-in-hibitory activity).
Variant Tm(◦C)* SI† kass(M−1s−1) kass•SI ATC232S 55.0 1.1+−0.02 1.5−+0.2×10⁶ 1.5×10⁶
P2P1 55.0 100+−9 – –
P6 54.5 n.i. – –
P4 55.0 n.i. – –
P6P4 55.0 89+−7 – –
P10P8 56.0 4.56+−0.32 1.2+−0.2×10⁵ 5.7×10⁵
P14P12 57.0 n.i. – –
*All standard errors were less than precision of the technique on the instrument (+−0.5◦C).
†Standard errors were calculated by regression of a transformed linear equation with
the intercept at the abscissa as a parameter.
Development of a FRET-based assay to follow oligomerization
Spectroscopically, serpin polymerization is typically followed using approaches that monitor coincident changes in the intrinsic properties of the molecule. We sought to use a technique that directly reports increases in physical proximity during oligo-merization. For this purpose, we developed a FRET-based assay by exploiting the presence of a hexa-histidine affinity tag on the recombinant proteins. Ni-NTA-conjugated ATTO-550 and 647N are commercially available dyes that are able to inter-act non-covalently with these affinity tags. In the presence of pre-polymerizedα1-antitrypsin, NTA-ATTO-550 was found to
excite NTA-ATTO-647N via FRET (Figure 2B, inset top left), with the magnitude of the signal proportional to the amount of oligomer present (Figure 2B, graph). The presence of the dyes led to a 1.6◦C decrease in thermal stability as determined using a CD-based thermal shift assay (Figure 2C), but had no effect on the ability to form SDS-stable complexes with bovine α -chymotrypsin (Figure 2D). It has previously been noted that the hexa-histidine tag increases stability of the recombinant protein [14], and this probably represents a partial negation of this effect, as the presence of the dye had no effect on the thermal stability of non-tagged plasmaα1-antitrypsin (Figure 2C).
In conjunction with a laser-excited real-time thermal cycler, it was possible to monitor the formation of polymer of multiple low-volume (20μl) samples concurrently in a microplate assay (Figure 3A). Non-linear regression analysis was performed using differential equations describing several alternative possible re-action schemes with COPASI [39]. The simplest kinetic reaction scheme that minimized the RMS deviation from the data was:
M−→
k1,fr Ipol+Ipol−→kapp,fr
P
wherek1,fr is a first-order activation rate constant,kapp,fr is the apparent second-order association rate constant, M is a non-activated monomer, Ipol a polymerization intermediate andP the species reported by FRET. Exploration of alternative path-ways with greater complexity, including reversible activation and mixed intermediate species, failed to yield improved fits; simil-arly, removal of the initial unimolecular step resulted in a much poorer correspondence with the data.
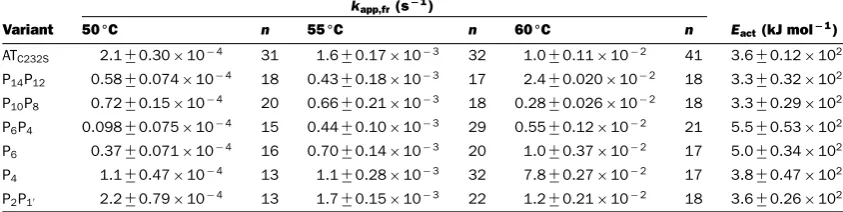
[image:8.595.65.292.428.526.2]Table 2 Effect of mutations on polymerization
The apparent rate of polymerization, determined using the FRET-based assay, is shown for each of theα1-antitrypsin loop mutants,
at 0.1 mg ml−1. The aggregate number of independent observations for a variant at each temperature is shown, and standard
errors are reported. The apparent energy of activation was calculated by application of Arrhenius’ law.
kapp,fr(s−1)
Variant 50◦C n 55◦C n 60◦C n Eact(kJ mol−1) ATC232S 2.1+−0.30×10⁻⁴ 31 1.6+−0.17×10⁻³ 32 1.0+−0.11×10⁻² 41 3.6+−0.12×10²
P14P12 0.58+−0.074×10⁻⁴ 18 0.43+−0.18×10⁻³ 17 2.4+−0.020×10⁻² 18 3.3+−0.32×10²
P10P8 0.72+−0.15×10⁻⁴ 20 0.66+−0.21×10⁻³ 18 0.28+−0.026×10⁻² 18 3.3+−0.29×10²
P6P4 0.098+−0.075×10⁻⁴ 15 0.44+−0.10×10⁻³ 29 0.55+−0.12×10⁻² 21 5.5+−0.53×10²
P6 0.37+−0.071×10⁻⁴ 16 0.70+−0.14×10⁻³ 20 1.0+−0.37×10⁻² 17 5.0+−0.34×10²
P4 1.1+−0.47×10⁻⁴ 13 1.1+−0.28×10⁻³ 32 7.8+−0.27×10⁻² 17 3.8+−0.47×10²
P2P1 2.2+−0.79×10⁻⁴ 13 1.7+−0.15×10⁻³ 22 1.2+−0.21×10⁻² 18 3.6+−0.26×10²
second-order rate equation (as detailed in the Materials and Meth-ods section). However, it was not possible to derive robust values fork1,fr using this method, in which the presence ofIpol could only be inferred from the lack of conformity of an initial part of the curve to the second-order rate model. As equation (2) im-plicitly represents the concentration of polymer at a given time point as a proportion of a final steady-state value, points could be excluded below a nominal threshold value to ensure thatkapp,fr was determined from a region subject only to second-order time dependence. It was found that a cutoff of 25 % of the plateau FRET signal maximized the number of data points considered while effectively excluding the region of the curve subject to the first-order conversion ofMtoIpol.
The resulting second-order rates were proportional to α1 -antitrypsin concentration (Figure 3A), confirming that the assay was reporting a concentration-dependent bi-molecular step. The slope of the regression corresponds with a rate of polymerization of 4.3+−0.3×10²M−1s−1. The linearity of this relationship, in the context of the reaction scheme shown above, indicates that the activation step was not rate-limiting.
When experiments were performed in the presence of dif-ferent concentrations of ATTO-NTA, a linear relationship was also found between the natural logarithm ofkapp,frand the dye concentration used (Figure 3B). This enabled the derivation of a theoretical rate in the absence of dye. The resulting corrected rates were in excellent agreement with other measures of poly-merization, as detailed below.
Mutations at P6P4 increase the activation energy of polymerization
Progress curves were generated using the FRET-based assay for eachα1-antitrypsin mutant at 50, 55 and 60◦C at a fixed con-centration of 0.1 mg/ml (Figure 3C), and the dye-corrected ap-parent rate constant,kapp,fr, was determined under each condition (Table 2). At least three independent experiments were performed at each temperature at three concentrations of dye. The mutants displayed a range of behaviours, demonstrating differential ef-fects of the mutations at different sites in the RCL. Only P2P1 be-haved in a wild-type fashion. At 50◦C, the rate of polymerization followed the order P6P4<P6<P14P12<P10P8<P4<ATC232S/P2P1,
from slowest to fastest. At 55◦C, P6P4and P14P12were found to be the most resistant to polymer formation. At 60◦C, the barrier to polymerization was sufficiently reduced such that the vari-ants in the P6-P1range demonstrated similar rates to the control; however, the P14P12 and P10P8 variants remained slower. It is interesting to note that the behaviours of the P6 and P4variants deviate in this assay from that observed in cells in the presence of the Z mutation (Figure 1). As oligomers in both contexts are recognized by the 2C1 anti-pathogenic polymer antibody, it is unlikely that this is the product of fundamentally different mech-anisms of polymerization; however it does indicate there are dif-ferences in the molecular details. This may reflect the difference between a specific destabilization of the top ofβ-sheet A by the Z point mutation [6,7,17] and a more general destabilization of theβ-sheet A under thermal stress.
In accordance with Arrhenius’ law, a linear relationship was found between the natural logarithm of the rates and the inverse of the experimental temperature (Figure 4A). From the slopes of these regressions, it was possible to calculate the apparent energy of activation (Eact) for the polymerization reaction. The ATC232S control variant was determined to have an activation energy of polymerization of∼360 kJ mol−1 (Table 2). This analysis re-vealed a striking behaviour for the P6and P6P4mutants: steeper curves with respect to the other variants were consistent with an additional barrier to activation of 140–190 kJ mol−1. Notably, despite the considerable resistance of the P10P8and P14P12α1 -antitrypsin variants to polymerization, these mutants had com-parable activation energies to the ATC232S control (Figure 4B andTable 2), indicating their effects are manifested during the unimolecular activation phase rather than the multimolecular as-sociation phase.
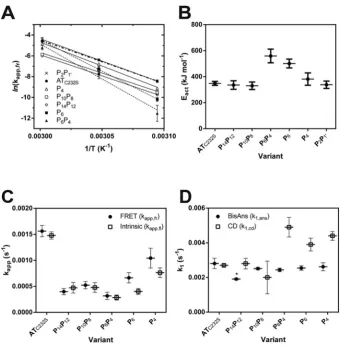
Figure 4 Apparent rate constants calculated for activation and polymerization of controlα1-antitrypsin and reactive
loop mutants
(A) The inverse relationship between the natural logarithm of the apparent rate of polymerization,kapp,fr(calculated for
each variant as shown inFigure 2D), and temperature was used to determine the energy of activation of the reaction,
Eact. Each data point is from least ten independent experiments. (B) The calculated energy of activation,Eact, for the
heat-induced polymerization of each variant is shown. (C) The change in intrinsic tryptophan fluorescence was monitored for the variants at 55◦C using an LS55B instrument with a stirred cuvette and excitation at 280 nm and emission at 340 nm (open squares). Protein concentration was 0.1 mg/ml in 800μl polymerization buffer. Values shown (kapp,fl) are
from three to five independent experiments and are the result of fitting a single exponential equation to the data [14]. The combined results of the FRET assay at this temperature are shown for comparison (kapp,fr) interpolated from the linear
regressions in panel (A) (closed circles). (D) The change in fluorescence in the presence of 10μM bis-ANS was followed at 55◦C in a cuvette or plate reader format, and fitted to a single exponential equation (closed circles). The resulting rates (k1,ans) were calculated from seven independent experiments. Alongside these values are the rates of change of circular
dichroic ellipticity at 222 nm (k1,cd), calculated from two to three independent experiments for each point (open squares).
An asterisk ‘*’ indicates a significant decrease (P=0.035) with respect to the control as determined by one-way ANOVA using the Bonferroni multiple test correction.
ANS or bis-ANS binding, and by two-phase analysis of change in intrinsic tryptophan fluorescence [14,40].
Unimolecular activation of plasma-derived α1-antitrypsin is associated with an increase in fluorescence which is of interme-diate magnitude to that seen with subsequent polymerization [14]. This indicates that distinct changes in the tryptophan environment occur during each phase. For all of the variants, at 55◦C trypto-phan fluorescence was found to follow only a single exponential function. This lack of a detectable second ‘fast’ phase for the recombinant protein, when compared with glycosylated
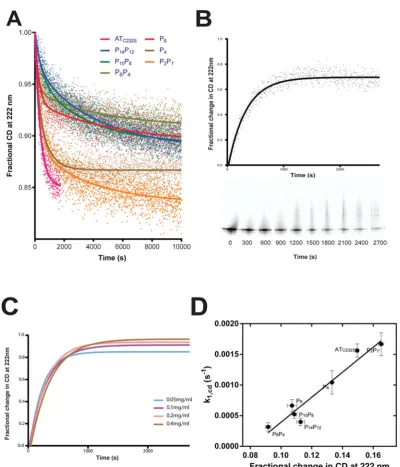
Figure 5 Intermediate formation monitored by CD
(A) Change in secondary structure content was monitored at 222 nm in a 2 mm pathlength cuvette containing 20 mM Na2HPO4/NaH2PO4pH 7.4 pre-warmed to 55◦C. The progress curves shown are the aggregate of three replicate
experi-ments, normalized to the starting CD signal, and fit using a two-phase exponential equation. (B) The normalized change in ellipticity for the ATC232Scontrol at 55◦C is shown. Periodically, an aliquot containing 2μg of material was removed and
snap frozen, before separation on a 4–12 % (w/v) acrylamide non-denaturing gel; positions in the figure are relative to the time at which they were removed. (C) The rate of change of the CD signal at 55◦C at different concentrations of ATC232S
is shown. (D) A trend is evident between the magnitude of the CD signal change and the rate of polymerization of the variants.
bis-ANS reports a decreased rate of activation for P14P12α1-antitrypsin
At 55◦C, the bis-ANS dye was found to report a phase with significantly faster rates (k1,ans) for all proteins than that repor-ted by the FRET and intrinsic fluorescence assays (Figure 4D,
circles). This is consistent with its ability to detect an activation step that precedes polymer formation [40]. Interestingly, how-ever, only P14P12 showed a significant decrease in the rate of activation with respect to the ATC232Scontrol (one-way ANOVA,
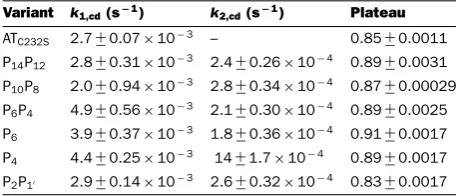
Table 3 Rate and magnitude of the structural change reported by CD at 55◦C
The plateau value reflects the magnitude of the change from the start-ing CD ellipticity measurement. Parameters were calculated from fit-ting a two-phase exponential equation to the combined data from at least three independent experiments. Standard errors from the fit are reported.
Variant k1,cd(s−1) k2,cd(s−1) Plateau ATC232S 2.7+−0.07×10⁻³ – 0.85+−0.0011
P14P12 2.8+−0.31×10⁻³ 2.4+−0.26×10⁻⁴ 0.89+−0.0031
P10P8 2.0+−0.94×10⁻³ 2.8+−0.34×10⁻⁴ 0.87+−0.00029
P6P4 4.9+−0.56×10⁻³ 2.1+−0.30×10⁻⁴ 0.89+−0.0025
P6 3.9+−0.37×10⁻³ 1.8+−0.36×10⁻⁴ 0.91+−0.0017
P4 4.4+−0.25×10⁻³ 14+−1.7×10⁻⁴ 0.89+−0.0017
P2P1 2.9+−0.14×10⁻³ 2.6+
−0.32×10⁻⁴ 0.83+
−0.0017
insert into the top ofβ-sheet A, and are the first to insert during an inhibitory interaction. Combined with the observation that at non-polymerizing temperatures, bis-ANS is able to interact with the Z variant ofα1-antitrypsin but not wild-type [17], it is prob-ably that this difference in rate reflects an early activation step involving the opening ofβ-sheet A and initial insertion of these residues of the RCL.
Differential effects on the rate of circular dichroic change during polymerization
The unimolecular phase of polymerization can be followed using CD spectroscopy at 222 nm, which reports changes in secondary structure content [14]. As the bis-ANS data did not account for differences in the rate of polymerization, and since the use of an ANS-based dye may perturb structural equilibria [19], we used this technique to explore other potential effects on the activation toIpol.
A pronounced initial decrease in ellipticity for all proteins was observed within approximately 1200 s (Figure 5A), dur-ing which time non-denaturdur-ing gel analysis revealed minimal polymer formation (Figure 5B). Varying serpin concentration failed to have a significant effect on the shape of the curve ( Fig-ure 5C) over this time frame, suggesting CD indeed reports a pre-oligomerization activation step. The CD data were expressed as a function of starting ellipticity, and fit to a two-phase exponen-tial decay equation. Surprisingly, the P10P8and P14P12mutants were not significantly different in the early ‘fast’ phase from the ATC232S control, and the P6, P4 and P6P4 variants exhibited an increased rate despite their repression of polymerization (k1,cdin
Table 3). This conflicting behaviour indicates that the underly-ing structural change represented by the increase in CD is not a rate-limiting step in the polymerization of these variants.
It has been noted previously that CD of plasmaα1-antitrypsin reports a single transition consistent with activation and not poly-merization [14]. The behaviour of the control variant is consistent with this. While the CD progress curves of the mutants demon-strated a measurable second phase, the significance of this was not clear, as the rate (k2,cd) did not appear to correlate with other measures of polymerization or activation (Table 3). This
trans-ition may therefore represent a secondary structural change not directly associated with the polymerization mechanism.
The amplitudes of the curves themselves reflect differing over-all degrees of secondary structural change over the course of the experiment. It was found that the magnitude of this change showed a strong linear trend against the rate of polymerization of the variants (Table 3and Figure 5D). At a molecular level, this could be the result ofα1-antitrypsin molecules adopting two distinct structural states that contribute differentially to the CD of the sample. It is unlikely that these two states represent sequential intermediates on a single reaction path, as the progress curves do not converge to a common CD value; this lack of convergence also indicates that the different contributions to the CD signal persist during polymer formation. When expressed as the frac-tional deviation from the starting CD value, extrapolation of the linear regression tok1,cd=0 s−1yielded an intercept of 0.0807, indicating that one of the components had lost about 8 % of the measured secondary structure signal at 222 nm with respect to the monomer.
Although this analysis was not possible for the second com-ponent, it could be inferred from the linear relationship that the second component is required for polymerization to occur, that is, the first component is unable to self-associate. Polymerization by association between ‘donor’ and ‘acceptor’ molecules could be one explanation for these observations. Differences in popula-tion of these two states would accordingly influence the apparent rate of inter-molecular association, and explain why, in the ab-sence of the increased energy of activation observed with the P6P4and P6variants, the P14P12, P10P8and P4variants result in a reduced rate of polymerization.
Conclusions: the dichotomous behaviour of the RCL mutants
Mutations in distinct regions of the RCL of the Z variant ofα 1-antitrypsin – at P14P12 and P4 – are able to significantly affect accumulation of polymers in cells. In vitro, the P14P12 mutant decreases the rate of polymerization, in part by interfering with an initial insertion of the RCL at an early stage in the pathway. This effect is consistent with the three extant models of polymer-ization (Figure 1B). In the context of the RCL-exchange models, pre-insertion of the P12and P14residues coincides with opening ofβ-sheet A, which in the case of the loop-sheet polymer, would ultimately accommodate the loop of a second molecule. In the β-hairpin model, this step foreshadows the destabilization and loss of strand 5A. When considered, on the other hand, through the prism of the C-terminal polymer, this insertion step precedes a cascading RCL as the molecule transitions to a latent-like con-formation.
considered, the polymerizing species is in a near-native state with respect to the ‘breach’ region at the top ofβ-sheet A.
In contrast, P6P4 does not decrease the rate of early changes reported by bis-ANS or CD, but increases the activation energy required to transit between the intermediate ensemble these meth-ods report, and the terminal self-associated form. As this increase is reflected in the intermolecular rate constant, this is most likely the consequence of interference with an intermolecular interac-tion. It is nevertheless possible that the mutant interferes with the progression to a late-stage intermediate form; however it is note-worthy that the P14P12variant shows no effects on the activation energy despite directly affecting the bis-ANS-binding interme-diate state, arguing against significant influence of the first-order step on the calculation of the second-order rate constant.
In the case of the C-terminal polymer, self-insertion of P6P4 would represent a kinetic barrier in the transition to the latent-like activated species. At this stage, strand 1C and possibly the C-terminus will need be disengaged, and the situation of the in-coming P6P4residues in the bottom half of the A-sheet beneath the F-helix and hF-s3A loop may amplify the energetic cost of the mutations (Figure 1A, right panel). Loop-exchange models suggest that the requirement to partly displace this helix would enhance the ability of the mutations to interfere with the inter-molecularassociation. A common underlying interpretation is that the structural character of this region, which includes the F-helix and hF-s3A loop, provides an energetic barrier at the late stage of polymer formation. The efficacy of this mutant in cells therefore supports a polymerogenic species with an intact F-helix and underlyingβ-sheet A.
It is noteworthy that the P10P8mutant has only an intermediate effect on polymerization. These residues are expected to be posi-tioned near the ‘shutter’ region that regulates opening ofβ-sheet A during insertion, and are situated in close proximity to the C-terminal portion of the F-helix that has been found to undergo remodelling during polymerization [41]. In light of the observa-tion that this mutant retains some inhibitory activity, it may be that once sheet opening has been initiated, these positions have a limited ability to prevent self-insertion (C-terminal model) or that they play a minor role in any possible inter-molecular interactions (loop-exchange models). Indeed, when the latter models are con-sidered, it appears that in the presence of the Z mutation that the bridging ‘linker’ region is more extensive than in heat-generated polymers and includes P6as well as the P10P8residues.
In conclusion, these data support a polymerization reaction scheme in which a structural transition precedes the opening of β-sheet A, followed by an obligate partial insertion of the P14P12 residues, and ultimately a kinetic barrier involving the insertion of residues P6P4 into β-sheet A. CD provides evidence for a direct link between intermediate structure and polymerization rate. Finally, in cells, polymerization most likely proceeds from a near-native state.
AUTHOR CONTRIBUTION
Imran Haq, James Irving, Sarah Faull, Jenny Dickens, Adriana
Ord´o˜nez, and Didier Belorgey designed the experiments, performed
the research and analysed data. Bibek Gooptu performed
molecu-lar modelling and contributed to the design of experiments. David
Lomas and James Irving directed the research. James Irving, David
Lomas and Imran Haq wrote the paper. All authors contributed
re-visions to, and approved, the final version of the paper.
FUNDING
This work was supported by the Medical Research Council (U.K.),
the Engineering and Physical Sciences Research Council,
Glaxo-SmithKline and Papworth NHS Trust. J.D. is a Medical Research
Council Clinical Training Fellow and the recipient of a Sackler
Stu-dentship Award, and S.V.F. is supported by an Engineering and
Physical Sciences Research Council/GlaxoSmithKline Case
Stu-dentship. AO was an eALTA Fellow.
REFERENCES
1 Silverman, G. A., Bird, P. I., Carrell, R. W., Church, F. C., Coughlin, P. B., Gettins, P., Irving, J., Lomas, D. A., Moyer, R. W., Pemberton, P. et al. (2001) The serpins are an expanding superfamily of structurally similar but functionally diverse proteins. Evolution, novel functions, mechanism of inhibition and a revised nomenclature. J. Biol. Chem.276, 33293–33296
2 Whisstock, J. C. and Bottomley, S. P. (2006) Molecular gymnastics, serpin structure, folding and misfolding. Curr. Opin. Struc. Biol.16, 761–768
3 Lomas, D. A. and Mahadeva, R. (2002) Alpha-1-antitrypsin polymerisation and the serpinopathies: pathobiology and prospects for therapy. J. Clin. Invest.110, 1585–1590 4 Gooptu, B. and Lomas, D. A. (2008) Polymers and inflammation:
disease mechanisms of the serpinopathies. J. Exp. Med.205, 1529–1534
5 Ekeowa, U. I., Gooptu, B., Belorgey, D., H¨aggl¨of, P., Karlsson-Li, S., Miranda, E., P´erez, J., MacLeod, I., Kroger, H., Marciniak, S. J. et al. (2009) alpha1-Antitrypsin deficiency, chronic obstructive pulmonary disease and the serpinopathies. Clin. Sci. (Lond.)116, 837–850
6 Lomas, D. A., Evans, D. L., Finch, J. T. and Carrell, R. W. (1992) The mechanism of Zα1-antitrypsin accumulation in the liver. Nature357, 605–607
7 Lomas, D. A., Evans, D. L., Stone, S. R., Chang, W.-S. W. and Carrell, R. W. (1993) Effect of the Z mutation on the physical and inhibitory properties ofα1-antitrypsin. Biochemistry32, 500–508 8 Dunstone, M. A., Dai, W., Whisstock, J. C., Rossjohn, J., Pike,
R. N., Feil, S. C., Le Bonniec, B. F., Parker, M. W. and Bottomley, S. P. (2000) Cleaved antitrypsin polymers at atomic resolution. Protein Sci.9, 417–420
9 Mast, A. E., Enghild, J. J. and Salvesen, G. (1992) Conformation of the reactive site loop ofα1-proteinase inhibitor probed by limited proteolysis. Biochemistry31, 2720–2728
10 Huntington, J. A., Pannu, N. S., Hazes, B., Read, R., Lomas, D. A. and Carrell, R. W. (1999) A 2.6 ˚A structure of a serpin polymer and implications for conformational disease. J. Mol. Biol.293, 449–455
12 Yamasaki, M., Sendall, T. J., Harris, L. E., Lewis, G. M. and Huntington, J. A. (2010) The loop-sheet mechanism of serpin polymerization tested by reactive centre loop mutations. J. Biol. Chem.285, 30752–30758
13 Devlin, G. L., Chow, M. K. M., Howlett, G. J. and Bottomley, S. P. (2002) Acid denaturation ofα1-antitrypsin: characterization of a novel mechanism of serpin polymerization. J. Mol. Biol.324, 859–870
14 Dafforn, T. R., Mahadeva, R., Elliott, P. R., Sivasothy, P. and Lomas, D. A. (1999) A kinetic mechanism for the polymerisation of
α1-antitrypsin. J. Biol. Chem.274, 9548–9555
15 Gooptu, B., Hazes, B., Chang, W.-S. W., Dafforn, T. R., Carrell, R. W., Read, R. and Lomas, D. A. (2000) Inactive conformation of the serpinα1-antichymotrypsin indicates two stage insertion of the reactive loop; implications for inhibitory function and
conformational disease. Proc. Natl. Acad. Sci. U.S.A.97, 67–72 16 Lomas, D. A., Elliott, P. R., Chang, W.-S. W., Wardell, M. R. and
Carrell, R. W. (1995) Preparation and characterisation of latent
α1-antitrypsin. J. Biol. Chem.270, 5282–5288
17 Knaupp, A. S., Levina, V., Robertson, A. L., Pearce, M. C. and Bottomley, S. P. (2009) Kinetic instability of the serpin Z a1-antitrypsin promotes aggregation. J. Mol. Biol.396, 375–383 18 Ekeowa, U. I., Freeke, J., Miranda, E., Gooptu, B., Bush, M. F.,
P´erez, J., Teckman, J., Robinson, C. V. and Lomas, D. A. (2010) Defining the mechanism of polymerization in the serpinopathies. Proc. Natl. Acad. Sci. U.S.A.107, 17146–17151
19 Nyon, M. P., Segu, L., Cabrita, L. D., L´evy, G. R., Kirkpatrick, J., Roussel, B. D., Patschull, A. O., Barrett, T. E., Ekeowa, U. I., Kerr, R. et al. (2012) Structural dynamics associated with intermediate formation in an archetypal conformational disease. Structure20, 504–512
20 Powell, L. M. and Pain, R. H. (1992) Effects of glycosylation on the folding and stability of human, recombinant and cleaved
α1-antitrypsin. J. Mol. Biol.224, 241–252
21 Miranda, E., P´erez, J., Ekeowa, U. I., Hadzic, N., Kalsheker, N., Gooptu, B., Portmann, B., Belorgey, D., Hill, M., Chambers, S. et al. (2010) A novel monoclonal antibody to characterise pathogenic polymers in liver disease associated with a1-antitrypsin deficiency. Hepatology52, 1078–1088 22 Sivasothy, P., Dafforn, T. R., Gettins, P. G. W. and Lomas, D. A.
(2000) Pathogenicα1-antitrypsin polymers are formed by reactive loop-β-sheet A linkage. J. Biol. Chem.275, 33663–33668 23 Yamasaki, M., Li, W., Johnson, D. J. and Huntington, J. A. (2008)
Crystal structure of a stable dimer reveals the molecular basis of serpin polymerization. Nature455, 1255–1258
24 Yamasaki, M., Sendall, T. J., Pearce, M. C., Whisstock, J. C. and Huntington, J. A. (2011) Molecular basis ofα1-antitrypsin deficiency revealed by the structure of a domain-swapped trimer. EMBO Rep.12, 1011–1017
25 Schulze, A. J., Baumann, U., Knof, S., Jaeger, E., Huber, R. and Laurell, C.-B. (1990) Structural transition ofα1-antitrypsin by a peptide sequentially similar toβ-strand s4A. Eur. J. Biochem.194, 51–56
26 Skinner, R., Chang, W.-S. W., Jin, L., Pei, X., Huntington, J. A., Abrahams, J.-P., Carrell, R. W. and Lomas, D. A. (1998) Implications for function and therapy of a 2.9 ˚A structure of binary-complexed antithrombin. J. Mol. Biol.283, 9–14
27 Zhou, A., Carrell, R. W. and Huntington, J. A. (2001) The serpin inhibitory mechanism is critically dependent on the length of the reactive center loop. J. Biol. Chem.276, 27541–27547
28 Schechter, I. and Berger, A. (1967) On the size of the active site in proteases. 1. Papain. Biochem. Biophys. Res. Commun.27, 157–162
29 Kr¨oger, H., Miranda, E., MacLeod, I., P´erez, J., Crowther, D. C., Marciniak, S. J. and Lomas, D. A. (2009) Endoplasmic
reticulum-associated degradation (ERAD) and autophagy cooperate to degrade polymerogenic mutant serpins. J. Biol. Chem.284, 22793–22802
30 Irving, J. A., Ekeowa, U. I., Belorgey, D., Haq, I., Gooptu, B., Miranda, E., P´erez, J., Roussel, B. D., Ord´o˜nez, A., Dalton, L. E. et al. (2011) The serpinopathies: studying serpin polymerization
in vivo. Methods Enzymol.501, 421–466
31 Kwon, K.-S., Kim, J., Shin, H. S. and Yu, M.-H. (1994) Single amino acid substitutions ofα1-antitrypsin that confer enhancement in thermal stability. J. Biol. Chem.269, 9627–9631
32 Nettleship, J. E., Brown, J., Groves, M. R. and Geerlof, A. (2008) Methods for protein characterization by mass spectrometry, thermal shift (ThermoFluor) assay, and multiangle or static light scattering. Methods Mol. Biol.426, 299–318
33 Kezdy, F. J. and Kaiser, E. T. (1970) Principles of active site titration of proteolytic enzymes. Methods Enzymol.19, 3–20 34 Hopkins, P. C. R., Carrell, R. W. and Stone, S. R. (1993) Effects of
mutations in the hinge region of serpins. Biochemistry32, 7650–7657
35 Mahadeva, R., Dafforn, T. R., Carrell, R. W. and Lomas, D. A. (2002) Six-mer peptide selectively anneals to a pathogenic serpin conformation and blocks polymerisation: implications for the prevention of Zα1-antitrypsin related cirrhosis. J. Biol. Chem.277, 6771–6774
36 Huntington, J. A. and Whisstock, J. C. (2010) Molecular contortionism-on the physical limits of serpin ‘loop-sheet’ polymers. Biol. Chem.391, 973–982
37 Zhou, A., Stein, P. E., Huntington, J. A., Sivasothy, P., Lomas, D. A. and Carrell, R. W. (2004) How small peptides block and reverse serpin polymerization. J. Mol. Biol.342, 931–941
38 Belorgey, D., Irving, J. A., Ekeowa, U. I., Freeke, J., Roussel, B. D., Miranda, E., P´erez, J., Robinson, C. V., Marciniak, S. J., Crowther, D. C. et al. (2011) Characterisation of serpin polymersin vitroand
in vivo. Methods53, 255–266
39 Hoops, S., Sahle, S., Gauges, R., Lee, C., Pahle, J., Simus, N., Singhal, M., Xu, L., Mendes, P. and Kummer, U. (2006) COPASI–a COmplex PAthway SImulator. Bioinformatics22, 3067–3074 40 James, E. L. and Bottomley, S. P. (1998) The mechanism of
α1-antitrypsin polymerization probed by fluorescence spectroscopy. Arch. Biochem. Biophys.356, 296–300
41 Cabrita, L. D., Whisstock, J. C. and Bottomley, S. P. (2002) Probing the role of the F-helix in serpin stability through a single tryptophan substitution. Biochemistry41, 4575–4581
42 Elliott, P. R., Abrahams, J.-P. and Lomas, D. A. (1998) Wildtype
α1-antitrypsin is in the canonical inhibitory conformation. J. Mol. Biol.275, 419–425
43 Huntington, J. A., Read, R. J. and Carrell, R. W. (2000) Structure of a serpin-protease complex shows inhibition by deformation. Nature 407, 923–926
Received 16 April 2013/22 April 2013; accepted 25 April 2013