IJPSR (2018), Volume 9, Issue 8 (Research Article)
Received on 04 December, 2017; received in revised form, 14 March, 2018; accepted, 18 March, 2018; published 01 August, 2018 EVALUATION OF GLUCOSE SYRUP PRODUCED FROM CASSAVA HYDROLYZED WITH MALTED GRAINS (RICE, SORGHUM & MAIZE)
Modupe Elizabeth Ojewumi * 1, Opeyemi Adewale Adeeyo 1, Oluwaseun Mary Akingbade 1, Damilola Elizabeth Babatunde 1, Ayodeji Ayodele Ayoola 1, Olugbenga Olufemi Awolu 2, Emmanuel Omotayo Ojewumi 2 and Oladele Julius Omodara 1
Chemical Engineering Department 1, Covenant University, P.M.B 1023, Canaan Land, Ota, Ogun state, Nigeria.
Department of Food Science and Technology 2,Federal University of Technology, Akure, Ondo State, Nigeria.
ABSTRACT: The crude malt obtained from the grains were hydrolyzed with cassava starch to obtain glucose syrup. 94.33% malt was produced from maize, rice had 84.46% malt, while sorghum had 84.97% malt. Glucose syrup yield was greatest using sorghum malt with percentage yield of 75.55%, 52.37% using rice malt, and while maize malt had 48.33 % syrup. Maize sample had highest malt yield but lowest glucose syrup yield showing that glucose syrup yield is in dependent on malt yield but on the quality of amylase produced during malting. Analysis on the glucose syrup obtained gave the following results: moisture content of 13.8%, 14.5%, 15.4%; ash content of 0.02%, 0.04%, 0.01%; carbohydrate 86.47%, 84.76%, 83.01%; total reducing sugar (invert sugar) 85.79%, 83.86%, 82.58%; total soluble (sugar brix) 100°Brix, 110°Brix, 105°Brix for rice, sorghum and maize samples respectively. Dextrose equivalent, viscosity, colour and taste of the end products were also analyzed. Microbial analysis was 2×101, 5×101, 3×101 cfu/mL for glucose syrup from rice, sorghum and maize samples respectively with no trace of yeast or mold growth making the glucose syrup fit for consumption.
INTRODUCTION: Grains are small, hard, dry seeds harvested for human or animal consumption. After harvest, dry grains are able to exist for a long time without significant deterioration than other common foods and this durability has made grains well suited to industrial agriculture. Sorghum, millet, maize, rice and wheat are the most important cereals in Nigeria 1, 2, 3.
QUICK RESPONSE CODE
DOI:
10.13040/IJPSR.0975-8232.9(8).3378-87
Article can be accessed online on:
www.ijpsr.com
DOI link: http://dx.doi.org/10.13040/IJPSR.0975-8232.9(8).3378-87
Glucose syrup is an undiluted aqueous solution of glucose, maltose and other nutritive saccharides obtained from cassava starch.
Starch is a polysaccharide carbohydrate consisting of a large number of glucose units linked by glycosidic bonds 1. Starch is one of the most valuable and widely occurring carbohydrate reserves in green plants and it is commercially produced from seeds, tubers and roots of plants 2, 3. Starch can be physically, chemically or enzymatically modified and processed into many value added products 2, 4, 5, 6. A suitable and commercial source of starch is Cassava. Cassava,
Manihot esculenta crantz is a tuberous plant which grows best in tropical and subtropical areas of the
Keywords:
Brix, Gelatinization, Hydrolysis, Malt, Syrup Correspondence to Author: Dr. Modupe Elizabeth Ojewumi
world all through the year. By virtue of its high starch content and tolerance to drought, it is one of the most essential crops in the tropics with Nigeria being the highest producer in the world 7, 8. Glucose syrup is an undiluted aqueous solution of glucose, maltose and other nutritive saccharides from edible starch. Currently, glucose syrup is not sufficiently manufactured in Nigeria but most industries make use of it in their operation. Industrially, it is utilized in large quantities in fruit juices, liquors, crystallized fruits, bakery products, confectionery, pharmaceuticals, and brewery products. It is used to improve shelf life, enhance colour, reduce breakage, and maintain crispiness in breakfast cereals. Import formation revealed that in the year 2003, over 800 million naira was used in the importation of glucose syrup in Nigeria 9.
Glucose syrup is produced by hydrolysis of starch. In the past, hydrolysis of starch was widely carried out using acid. Several researches carried out on acid hydrolysis of starch favour the use of dilute acids such as hydrochloric acid over other acids because its action on starch is mild and produces lesser amount of side products.
However, acid hydrolysis are generally energy intensive, relatively difficult to control, require the use of materials that do not corrode easily, give rise to high colour and salt-ash content (after neutralization) 10. Enzymatic hydrolysis is now largely replacing the acid hydrolysis because it is easy to control, effective even in mild ambient conditions and do not give rise to any by-product. Enzymatic hydrolysis of starch is done with the use of amylase enzyme 11. Amylase enzyme breaks the bonds between the molecules of starch to form glucose. The enzyme is found abundantly in animals, plants, fungi etc. Malting is a means being employed to activate this enzyme in plant. Malting is the process of controlled germination and quick drying of cereal grains before shoot development 12. Malting is done to promote synthesis of hydrolytic enzymes which breaks macro molecules into compounds of low molecular weight of desired characteristics 13, 14. For most industrial processes, barley is the most preferred malting grain. However, Nigeria those not locally produce barley. Barley is majorly grown in cooler temperate regions with Russia, Spain, Canada, and
Germany being the top producers 15, 16. The selection of any malting grain among other things will however be based on its suitability for processing, yield of desired flavour qualities and good malting characteristics 17, 18.
Among the cereals that have high potential as alternative to barley are maize, sorghum and rice. Maize is one the most considered malting grain perhaps because of its abundant supply and relatively low cost 19. Sorghum (Sorghum bicolor
(L.) Moench) is a tropical cereal grass grown by cultivation. It is produced in almost all the states in Nigeria which is considered the second largest producer of sorghum 20. The locally produced rice is available all year round and is known to be highly nutritious. The malt obtained from the locally produced rice will potentially contain much nutrient. This paper considers the use of maize, sorghum and rice of Nigerian origin as grain in view of their malting characteristics and ultimately their ability to hydrolyze locally produced cassava starch to glucose syrup.
MATERIALS AND METHODS:
Collection of Samples: Rice paddy (oriza sativa), maize (Zea mays), sorghum (Sorghum Bicolor) and cassava (Manihot esculenta Crantz) were purchased from open market. All the reagents used were of analytical grade from Sigma Chemicals, USA.
Sample Preparation: Dirt and broken kernel were removed from the grains by hand picking. The grains were weighed and washed thoroughly with distilled water. Extraneous (floating materials) were also removed.
Cassava Flour Production: The tubers were peeled, washed and grated. The grated samples were soaked in water for 3 days, after which it was pressed using a muslin cloth to extract starch content. The starch was allowed to settle down, water was decanted and dry white powder was obtained using a Mitchel drier at 100 °C for 24 h. The whole process must not exceed 24 h in order not for fermentation to set in 21.
was measured and poured into the bowls containing the clean grains. The bowls were covered and left for 24 h (steeping). After steeping for 24 h, water was drained off and washed again thoroughly using distilled water. Each grain were poured in perforated bowls for water to drain. They were then tied in jute bags (still in sieve) and left for 7 days. The jute bags were opened every day to sprinkle the grains with water (germination) and to pick
samples every 24 h. These samples were used to analyze for amylase activity. The malted grains were weighed and put in the oven to dry at low temperature of 50 °C for 3 days. After complete drying they were de-rooted by rubbing in between the two palms to get roots off. The rootlets were sieved and weighed. The malt were weighed, milled with a blender into fine powder and stored in a cool dry place.
FIG. 1: MALTED RICE FIG. 2: MALTED MAIZE FIG. 3: MALTED SORGHUM
Extraction of Carbohydrate: The carbohydrate content was extracted with 50% methanol which was prepared by mixing methanol and distilled water at a volume ratio 1:1.
Determination of amylase activity of malted grain: This analysis is done on malted grain samples that were taken every 24 h for 168 h (7 days). The samples were milled and extracted with Acetate buffer. 2.0 g of ground malt was stirred in a 250 Erlenmeyer flask containing 100 ml of sodium chloride solution in a water bath at 20 °C and extracted for 60 min. The content was filtered using (whatman fluted filter paper). 1.0 ml of the filtrate was diluted to 100 ml with sodium chloride solution.
The magnetic bars were placed in the test-tubes and place the rack of the tubes in the 45 °C water bath, 1 ml of standard alpha-amylase was added to each tube. 5 ml acetate buffer was added and pre-incubated for 10 min in the water bath at 45 °C with continuous stirring. 1.0 ml of diluted enzymes extract was added to the tubes, after exactly 15 min, 2 ml sodium hydroxide was added to each tube and mixed by inversion. The tubes were allowed to stand for 15 min in a water bath at 20 °C. The absorbance at 620 nm wavelength against water was checked using a spectrophotometer.
Method of Calculation: The alpha-amylase activity is calculated on dry malt according to the formula:
A2 = A1 × 100 / 100 – M ... (1)
A1 = the amylase activity on sample from the concentration factor; amylase units/mg malt
A2 = the amylase activity on dry malt; amylase units/mg malt; M = moisture content
Analysis of Glucose Syrup:
Determination of pH: 10 ml of sample syrup was measured into 100 ml beaker and the pH was determined with the aid of a previously standardized pH meter (model Hannap211). The pH meter was calibrated using pH 4.0 and 7.0 buffer.
Determination of Total Solids: 25 ml of each sample was measured into pre-weighed 100 ml beaker. The beakers and the content were placed on a ring water bath for 1 h. The samples were dried in an oven at 105 °C for 2 h, cooled in a desiccator and then weighed on a chemical balance. The percentage total solids were calculated as follows:
Total solids = W2 - W1 / W2 - W1 × 100 ... (2)
Invert Sugar Determination: 2.5 grams of sample was weighed and transferred to 250 ml volumetric flask. 100 ml of neutral lead acetate solution was added and diluted to volumetric water and filtered. An aliquot of 25 ml of the clarified filtrate was transferred to 50 ml volumetric flask containing about 100 ml of water. Potassium oxylate was added in small amount until there is no further precipitation. An aliquot of 50 ml of clarified de-leaded was pipette to a 100 ml volumetric flask, 5 ml of concentrated HCl was also added and allowed to stand at room temperature for 24 h. This was then neutralized with concentrated NaOH solution followed by 0.1N NaOH solution made up to volume and transferred to 50 ml burette having an offset tip to perform the titration in Fehling’s solution.
Titration: 5 ml of Fehling solution was put into 250 ml conical flask and was mixed with 10 ml water and a few boiling glass beads. The solution
was dispensed and heated to boiling. 3 drops of methylene blue indicator was added, the addition of solution drop wise was continued until the blue colour disappeared to a brick-red end point. The titre value was recovered, the percentage total reducing sugar (as invert sugar) was calculated as follows:
Total Reducing Sugar (as invert sugar) = Dilution × Fehling factor × 100 / Weight of Sample × Titre ... (3)
Ash Content Determination: 5 g of the crushed sample was weighed into porcelain crucible previously ignited and weighed. Organic matter was charted by igniting the material on a hot plate in the fume cupboard. The crucibles were placed in the muffle furnace and maintained at 600°C. They were then cooled in a desiccator and the content was weighed immediately. The percentage ash content was weighed and calculated as follows:
% Ash = Weight of crucible ash - Weight of empty crucible / Sample weight. ... (4)
Enumeration of Microorganisms in Glucose Syrup: All glass wares used were properly washed, dried and sterilized in an oven at 180 °C for 3 h. Media: 23 g of nutrient agar, 52 g mc Conckey agar and 37.9 g of potato dextrose agar were weighed using a digital mettle balance (sutonis) and were suspended into 1 litre (1000 ml) amount of distilled water respectively homogenized on hot plate magnetic stirrer to form a uniform solution. Diluent: 90 ml and 9 ml distilled water were made in flasks and screw-capped test-tubes for serial dilution. The media and aliquots were sterilized at 121 °C for 15 min in an autoclave. At the end of sterilization period, media were cooled in the water
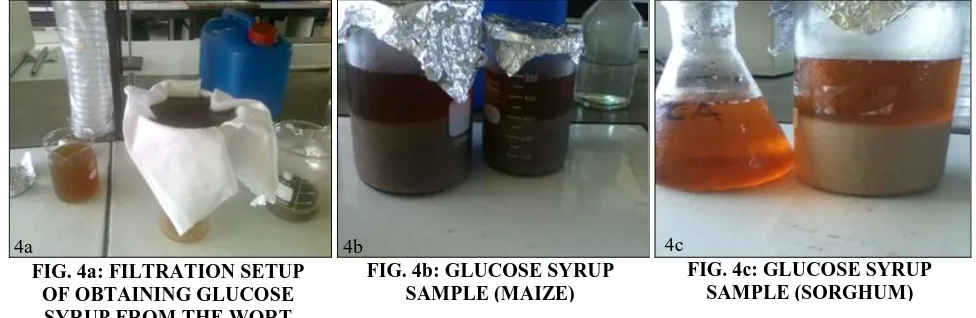
FIG. 4a: FILTRATION SETUP OF OBTAINING GLUCOSE SYRUP FROM THE WORT
[image:4.612.61.549.55.214.2]4a 4b 4c
FIG. 4b: GLUCOSE SYRUP SAMPLE (MAIZE)
bath set at 45 °C in order to inhibit bacterial growth. Streptomycin (0.14 g/L (w/v)) was aseptically weighed into potato dextrose agar only for fungi.
Isolation: l0 ml was measured aseptically with a sterile micro pipette and transferred into the first dilution blank of 90 ml distilled water. From the dilution, 1ml was aseptically taken and transferred into the next dilution blank of 9 ml sterile distilled water (10 - 1 dilution). Dispensable petri dishes were set out and labeled accordingly and isolation was carried out using pour plate method. Aliquot (1.0 ml) mcConkey agar (MCA) for chloroforms and potato dextrose sugar agar for fungi respectively in duplicates. The plates were allowed to set and incubated inversely under aerobic conditions at 37 ± 2 °C for bacteria while fungi plates were - incubated at 25 ± 2 °C for 3 - 5 days. The growth on each plate was examined at the end of incubation period, the colony observed on the plates were counted using colony counter. The colony or viable count per ml was calculated by multiplying average number of colonies per countable plate by the reciprocal of the dilution reported as forming units per ml (cfu/ml).
Determination of Soluble Solids (Sugar Brix): A drop of 10% v/v glucose syrup (diluted) was placed on the refractometer eye piece. The refractometer was viewed and the sugar level was read through the graduated mark in the refractometer in degree brix (Brix°).
RESULTS AND DISCUSSION:
Malting Process: Table 1 shows the characteristic feature of grains during steeping. Rice paddy had greatest floating material 33.3 g and maize with no
floating materials. The reason for the high floating material of rice paddy could be as a result of the source of the grains, while maize had no floating materials. Sorghum imbibed most water with a volume of 517.6 ml and rice with lowest of 138.3 ml. Grains were steeped for same duration. The imbibition of water by the grains is due to the different permeability of seed coats of grains. The significance of steeping in malting cannot be overemphasized as this step helps to accelerate the process of germination and increase moisture content of the grains. If the seed coat is impermeable to water or even metals in the soil it can cause imbibition of germination. Germination process allows for the development of endosperm enzymes which helped to modify the starch, proteins and cell walls of the endosperm.
Table 2 above shows maize having the highest germination with green malts weight of 1200 g and lowest as rice with weight of 1000 g. The process employed were in line with the malting procedures as 10. The Grains were allowed to grow under controlled conditions, sugars were produced from grain starch store (which explains a loss of weight when malt is obtained) and natural enzymes developed in the grain kernel. Speed of germination was controlled by temperature, aeration and maintenance of moisture by continued spraying with water. Also turning to avoid grains matting together which was done to obtain good green malt. The reason for kilning is to halt growth and dry grain to stable state at low temperature. Colour and flavor compounds are formed. It is also important to note that rice malt had longest kilning time. Rice malt had lowest yield and can be related to the result of low water imbibition shown in Table 1.
TABLE 1: CHARACTERISTIC FEATURE OF GRAINS DURING STEEPING Grain Weight of
grains
Weight of floating material
Volume of water
Weight of grains to be steeped
Weight of steeped out grains
Water imbibed during steeping
Rice 900g 33.3g 2 Litres 866.7g 1005g 138.3ml
Sorghum 1000g 7.6g 2 Litres 992.4g 1510g 517.6ml
Maize 1000g None 2 Litres 1000g 1400g 400ml
TABLE 2: CHARACTERISTIC FEATURE OF MALT FROM CEREAL GRAINS
Cereal grains Weight of green malt Weight of dried malt Weight of clean malt Malt yield
Rice 1000g 229.8g 194.08g 84.46%
Sorghum 1150g 306g 260g 84.97%
Maize 1200g 530.9 500g 94.33%
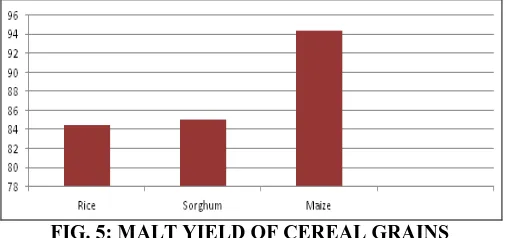
Fig. 5 shows maize with greatest malt yield of 94.33% compared to rice with yield of 84.46%.
give the highest yield of malt. This can be explained by the fact that there are other factors that affect malt yield like the starch store inherent in the grain. Other factors may include: preharvest germination (this is a situation where malting process is stopped meanwhile the grain is still alive), heat damage, contamination during malting, use of immature grains for malting could also reduce the yield of the malt.
[image:6.612.315.564.236.332.2]FIG. 5: MALT YIELD OF CEREAL GRAINS
TABLE 3: % MOISTURE CONTENT DURING MALTING FOR 168 h
Duration (h) Rice (%) Sorghum (%) Maize (%)
0 7.58 6.26 6.95
24 7.45 6.43 7.2
48 7.39 6.65 7.31
72 7.66 6.39 7.315
96 7.87 6.53 7.40
120 7.91 6.63 7.47
144 7.98 6.50 7.505
168 7.875 6.43 7.54
Table 3 shows the moisture content during malting. The moisture content for rice malt decreased from 7.58% at the 0th h to 7.39% at the 48th h, this increase continued until the last day of malting; the 168th h with moisture content of 7.875%. For sorghum malt there was fluctuation in the moisture content; constant rise and fall of moisture level until the 120th h with moisture content of 6.63% when there was increase and final drop on the 168th h. The table shows a continuous increase in the moisture content of the maize malt sample from
6.95% at 0th h to 7.54% at the 168th h. High moisture content enhances enzyme production and shoot emergence 22.
The amylase activity of the cereal grains are shown in Table 4. The table revealed that amylase unit of the three samples increased throughout the malting process. Amylase activity in rice malt increased from 9.156 in the 0th h to 96.495 on the 168th h, sorghum from 6.311 to 62.519 and maize from 7.706 to 62.519 amylase unit in the 168th h.
TABLE 4: ALPHA-AMYLASE ACTIVITY DURING MALTING (µ/MG MALT)
Duration (h) Rice Sorghum Maize
0 9.156 4.311 7.706
24 16.014 6.636 14.449
48 27.501 10.252 24.077
72 38.229 13.797 38.084
96 55.796 22.807 51.097
120 74.146 33.400 66.421
144 83.371 45.09 82.019
168 96.495 62.519 89.143
[image:6.612.51.298.342.439.2]Numerous studies of the effect of malting conditions on the production of alpha-amylase have been made and the conclusions reached have agreed quite well 23, 24, 25 demonstrated that increased steeping moisture, germination time, and germination temperature increased alpha-amylase production. According to 26 in their work on exogenous enzymes from sweet potato, Alpha amylase is a liquefying enzyme that drastically reduces the viscosity of gelatinized starch solution to produce mainly maltose, maltotriose, and low molecular weight dextrins. They also stated that amylase brings about complete degradation of starch to metabolize fermentable sugar during germination or malting of cereal grains. The reducing sugar of the grains during malting was as shown in Table 5. The reducing sugar increased with time for rice, sorghum and maize malt respectively.
TABLE 5: REDUCING SUGAR IN MALTED SAMPLE (%) Duration
(h)
Rice Sorghum Maize
Absorbance at 530nm
Reducing (mg %)
Absorbance at 530nm
Reducing (mg %)
Absorbance at 530nm
Reducing (mg %)
0 0.231 15.59 0.193 13.11 0.241 16.37
24 0.316 24.52 0.261 17.73 0.394 26.77
46 0.493 33.49 0.354 24.05 0.511 34.71
72 0.542 35.59 0.460 31.66 0.667 45.31
96 0.638 43.34 0.611 41.51 0.812 55.16
120 0.741 50.34 0.724 42.51 0.892 60.51
144 0.892 60.59 0.840 54.62 0.842 57.20
[image:6.612.50.562.616.741.2]Change in temperature and pH during malting is shown in Table 6. Temperature reduced from 25°C to 18°C for rice malt, decreased from 27°C to 18°C for sorghum malt and finally from 26 °C to 19 °C for maize malt respectively from the beginning of
[image:7.612.45.569.138.264.2]malting at 0th h to the end at 168th h. The temperature decrease might be as a result of temperature regulation which is done by spraying the malt with water regularly, aeration (air rest), and turning the grain to avoid matting.
TABLE 6: CHANGE IN TEMPERATURE AND pH DURING MALTING
Duration (h) Rice Sorghum Maize
T °C pH T °C pH T °C pH
0 25°C 6.80 27°C 6.70 26°C 6.85
24 24°C 6.40 26°C 6.50 25°C 6.60
48 24°C 6.10 25°C 6.20 24°C 6.30
72 23°C 5.95 23°C 6.05 23°C 6.10
96 21°C 6.05 22°C 6.00 22°C 6.00
120 20°C 6.15 20°C 5.98 21°C 6.05
144 19°C 6.07 20°C 5.90 20°C 5.98
168 18°C 5.90 18°C 5.85 19°C 5.93
pH for rice malt reduced from 6.80 to 5.95 at the 72nd h but increased at the 96th h and finally decreased to 5.90 at the 168th h. This shows that malt tends toward alkalinity. This also follows for sorghum malt that decreases from 6.70 to 5.85 and maize malt from 6.85 to 5.93 from the 0th hour to 168th h respectively. This research is in line with the fact that pH and temperature influences germination process. Application of an elevated temperature of 22 °C during malting was postulated by some researchers in order to replace the standard temperature of 14°C, as part of the malting technique referred to as “Activated Germination Malting” 27
. The elevated temperature of 22 °C was intended to cause the activity of the main malt enzymes to appear at earlier stages of steeping of the grain, by fast activation of the embryo. He also stated that Phenomena occurring during malting and mashing depend strongly on the pH value and
temperature. Germination temperature decreases the malt yield and also creates mold growth problems.
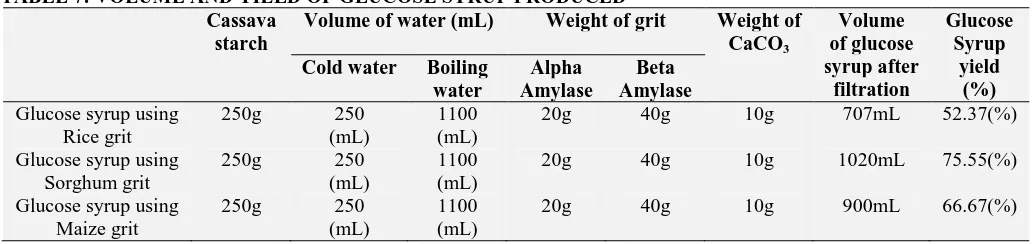
[image:7.612.48.566.554.676.2]This research was free from this effect of malt yield decrease and mold growth because the germination temperature decreased during malting. Volume of glucose syrup samples after filtration was recorded in Table 7. Glucose syrup using rice grit after filtration was 707 mL, from sorghum grit 1.02 L and maize grit was 900mL. Hydrolysis using sorghum grit gave the highest yield of glucose syrup, 75.5%. Rice grit gave glucose syrup yield of 52.37% and maize gave 66.67%. Temperature and pH greatly affects the hydrolysis of starch. Other factors that affect yield are type of starch and natural amylase inhibitor. Longer hydrolysis time and high enzyme dose shows highest increment in percentage of glucose yield.
TABLE 7: VOLUME AND YIELD OF GLUCOSE SYRUP PRODUCED Cassava
starch
Volume of water (mL) Weight of grit Weight of CaCO3
Volume of glucose syrup after
filtration
Glucose Syrup
yield (%) Cold water Boiling
water
Alpha Amylase
Beta Amylase Glucose syrup using
Rice grit
250g 250 (mL)
1100 (mL)
20g 40g 10g 707mL 52.37(%)
Glucose syrup using Sorghum grit
250g 250 (mL)
1100 (mL)
20g 40g 10g 1020mL 75.55(%)
Glucose syrup using Maize grit
250g 250 (mL)
1100 (mL)
20g 40g 10g 900mL 66.67(%)
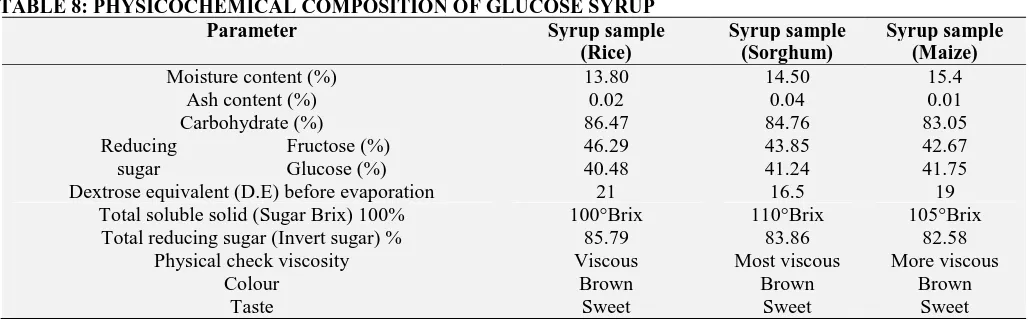
Table 8 shows the physiochemical composition of the samples of syrup produced. The composition analyzed were moisture content, ash content, carbohydrate, reducing sugar, total soluble solid, D.E, total reducing sugar and a physical check of
the end of liquefaction are dose of amylase added and duration (h) necessary for liquefaction. Ash content from table 8 shows 0.04% for sorghum and 0.01% for maize; which were within 0.03% maximum approved by Standard Organization of Nigeria for ash content specification of glucose syrup. There were no significant difference between the brix values of all the weight ratios used for the production of glucose syrup. The moisture content of the samples were between 15-20% which is the standard by literature.
The percentage conversion to reducing sugars and glucose was computed with rice sample having 85.79%, sorghum sample 83.86% and maize with 82.58. Sorghum is the most viscous of the three samples which were concentrated at the same time and temperature. In addition, rice sample concentrated first during evaporation but it ended up least viscous. The samples were sweet, brown viscous liquid with caramel odour. The factors that could have affected the rate of hydrolysis include: particle size of the malt grit used, and heat applied for the cooking of the starch (cooking of the starch makes it more readily available for enzymatic hydrolysis), natural amylase inhibitor.
The absence of starch in glucose syrup is an indication that amylolytic enzymes involved with liquefaction and saccharification process of starch
during mashing as contained in the malt might have done the process successfully. The mashing process was carried out at a pH of 5.0, for the enzymatic breakdown of starch and protein. Similar pH values of 5.0 - 5.5 was considered adequate for mashing as reported by 28. According to them pH below 4.5 cause a reduction in enzymatic hydrolysis. Final product (Glucose syrup) really depends on amylase/ amylopectin makeup of the starch.
[image:8.612.49.566.472.632.2]A dark colour was noticed during evaporation in the glucose syrup concentrates, this could result from the application of heat and also the remain of calcium carbonate in the sample. Starch granules naturally contain protein in their structure. The protein content defers depending on the source of starch and is sometimes seen as undesirable since it gives rise to browning reaction during the hydrolysis process to produce the glucose syrup 29. Invert sugar (reducing sugar) contains glucose and fructose. This was as a result of the enzymatic hydrolysis of the solution. Invert sugar was highest in glucose from rice sample and lowest in glucose syrup from maize sample. Invert sugar has a crystal inhibiting (slow down) characteristics and promotes retention of moisture (humectant properties) which means that the shelf life of many products can be extended by the use of Invert Syrup in product formulations.
TABLE 8: PHYSICOCHEMICAL COMPOSITION OF GLUCOSE SYRUP
Parameter Syrup sample
(Rice)
Syrup sample (Sorghum)
Syrup sample (Maize)
Moisture content (%) 13.80 14.50 15.4
Ash content (%) 0.02 0.04 0.01
Carbohydrate (%) 86.47 84.76 83.05
Reducing sugar
Fructose (%) 46.29 43.85 42.67
Glucose (%) 40.48 41.24 41.75
Dextrose equivalent (D.E) before evaporation 21 16.5 19 Total soluble solid (Sugar Brix) 100% 100°Brix 110°Brix 105°Brix
Total reducing sugar (Invert sugar) % 85.79 83.86 82.58 Physical check viscosity Viscous Most viscous More viscous
Colour Brown Brown Brown
Taste Sweet Sweet Sweet
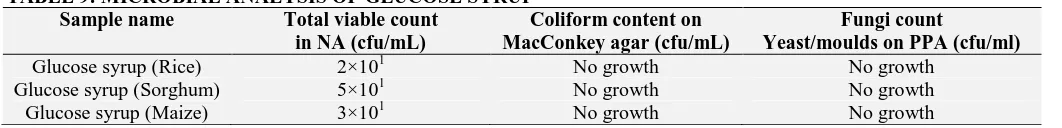
Table 9 shows that the 3 samples of glucose syrup are fit for consumption as there were no microbial growth (yeast/molds) present in them. The technology of glucose syrup is complex and the risks of contamination during the processing steps or in the final product are high especially when produced on a large scale. Glucose syrup from
Although, bacterial can grow in the bottles during storage when container is wet and stored in hot places. Risks are also possible due to the external
[image:9.612.45.576.114.178.2]contamination at mixing, packaging and storage or to the unhygienic manipulation and/or maintenance of equipment.
TABLE 9: MICROBIAL ANALYSIS OF GLUCOSE SYRUP
Sample name Total viable count
in NA (cfu/mL)
Coliform content on MacConkey agar (cfu/mL)
Fungi count
Yeast/moulds on PPA (cfu/ml)
Glucose syrup (Rice) 2×101 No growth No growth
Glucose syrup (Sorghum) 5×101 No growth No growth
Glucose syrup (Maize) 3×101 No growth No growth
CONCLUSION: This research developed a very simple and practicable method for the production of glucose syrup from cassava starch with sorghum malt giving the highest yield of glucose syrup of 75.55% and most viscous. This helps to save energy during evaporation. Rice can be used alternatively because of lowest total viable count of 2X101 cfu/mL and total reducing sugar (Invert sugar) of 85.79%. Amylase activity of malt was activated which was why the starch was hydrolyzed and glucose syrup obtained.
The research also reviewed that amylase activity of malt increased with malting time until the stored starch is totally consumed. If malting process still continues, amylase activity will fall but if otherwise and kilned the amylase activity is retained.
Amylase activity increases with malting time. Malt yield was compared during malting, total soluble solid, level of concentration after evaporation and other physiochemical composition of the glucose syrup sample, sorghum was most viscous, highest total soluble solid of 110° Brix while rice has the highest D.E of 21 after saccharification and highest percentage of carbohydrate 86.47%.
During hydrolysis, highest concentration of glucose was obtained during 4 hours of operation. This technology demonstrates a good business opportunity to create wealth using available local resources. There is an existing market for glucose syrup in the food and pharmaceutical industries based in Nigeria.
ACKNOWLEDGEMENT: The authors appreciate
the partial sponsorship of Covenant University, Ota, Nigeria.
CONFLICT OF INTEREST: The authors declare
no conflict of interest.
REFERENCES:
1. Omotosho OA and Muhammad-Lawal A: Optimal food
plan for rural household’ food security in Kwara State, Nigeria: The goal programming approach. Journal of Agricultural Biotechnology and Sustainable Development 2010; 2(1): 007-014.
2. Iweala EEJ, Olugduyiro JAO, Durodola BM, Fubara-Manuel DR and Okoli AO: Metal contamination of foods and drinks consumed in Ota, Nigeria. Research Journal of Environmental Toxicology 2014; 8(2): 92-97.
3. Oloyede M, Akan W and Nsikak B: Aflatoxin
Contamination of Some Edible Grains from Lagos and Ota Markets, Nigeria. Environmental Science and Technology 2016; 1: 396-399.
4. Jay-Lin J, Tunyawat K, Sharon L, Henzy Z and John FR: Anthology of Starch Granule Morphology by Scanning Electron Microscopy. Starch/Starke 1999;2: 123-130. 5. Abbas KA: Modified Starches and Their Usages in
Selected Food Products: A Review Study. Journal of Agricultural Sciences 2010; 2: 90-100.
6. Chaplin M: The use of Enzymes in Starch Hydrolysis. http://www1.lsbu.ac.uk/water/enztech/starch.html.
7. Cock JH: Cassava: A Basic Energy Source in the Tropics. Sciences 1982; 218: 755-762.
8. Daramola B and Osanyinlusi SA: Investigation on Modification of Cassava Starch Using Active Components of Ginger Roots (Zingiber officinale Roscoe). African Journal of Biotechnology 2016; 5: 917-920.
9. Miyazaki MR, Hung PV, Maeda T and Morita N: Recent Advances in Application of Modified Starches for Bread Making. Trends in Food Science and Technology 2006; 17: 591-599.
10. Aderibigbe AF, Anozie AN, Adejumo LA and Owolabi RU: Optimization of Cassava Starch Hydrolysis by Sorghum Malt. New Clues in Science, 2012; 2: 50-58. 11. Hillocks RJ, Thresh J and Bellotti AC: Cassava in Africa.
Cassava Biology, Production and Utilization. CABI Publishing, Second edition 2002.
12. Annon N: Nigeria Trade Summary. Federal Office of Statistics (FOS), Lagos, Nigeria. 2003.
13. Roberto do NS, Fábio PQ, Valdirene NM and Eduardo RA: Production of Glucose and Fructose Syrups from Cassava (Manihot esculenta Crantz) Starch Using Enzymes Produced by Microorganisms Isolated from Brazilian Cerrado Soil. Ciência e Tecnologia de Alimento
2010; 30: 27-31.
14. Whistler RL, BeMiller JN and Paschall FE: Starch: Chemistry and Technology. 2nd edition, 612.1984.eBook
ISBN:9780323139502.
16. Ayenor GS and Ocloo FCK: Physicochemical Changes and Diastase Activity Associated with Germinating Paddy Rice (PSB. Rc 34). African Journal of food Science 2007; 1: 37 - 41.
17. Briggs DE: Malt and Malting. Blackie Academic and Professional, London. 1st Edition 1998.
18. FAO: FAO STAT. Food and Agriculture Organization of the United Nations. Available from: http://faostat.fao.org/ default.aspx. 2010.
19. United States Department of Agriculture: World
Agricultural Production. Foreign Agricultural Service. Circular Series WAP06 - 12. Available from: http://www. fas.usda.gov/. 2010.
20. Mohammed U, Garba AM and Effiong DE: A Kinetic Study of the Enzymatic Hydrolysis of Cassava Starch.
International Journal of Science Engineering
Investigations 2012; 1(11): ISSN: 2251-8843.
21. Palmer GH: Adjuncts in Brewing and Distilling. In: Campbell, I. and Priest, F.G. (Eds.), In: Proceedings of Second Aviemore Conference on Malting Brewing and Distilling, Institute of Brewing. London, UK 1979;24-45. 22. Venkatasubramanian K and Keim CR: Starch and Energy:
Technology and Economics of Fuels Alcohol Production. In The Starch Conversion Technology 1985. 23. Taylor JRN: Overview: Importance of Sorghum in Africa.
Department of Food Science University of Pretoria, Pretoria 0002, South Africa 2004.
24. Ojewumi ME, Omoleye JA and Ajayi AA: The Effect of Different Starter Cultures on the Protein Content in Fermented African Locust Bean (Parkia Biglobosa) Seeds. International Journal of Engineering Research and Technology 2016; 5: 249-255.
25. Charalampopulos S and Pandiella SS: Evaluation of the effect of malt, wheat and barley extracts on the viability of potentially probiotic lactic acid bacteria under acidic conditions. International Journal of Food Microbiology 2003; 82: 133-141.
26. Savin R and Nicolas ME: Effects of Short Periods of Drought and High Temperature on Grain Growth and Starch Accumulation of Two Malting Barley Cultivars. Australian Journal of Plant Physiology 1996; 23: 201 – 210.
27. Haifeng Z, Wei F, Jianjun D, Jian L, Jian C, Lianju S, Yan L and Weibao K: Evaluation of antioxidant activities and total phenolic contents of typical malting barley varieties. Food Chemistry 2007; 1071: 296-304.
28. Zhang G, Chen J, Wang J and Ding S: Cultivar and Environmental Effects on (1→3, 1→4)-β-D-Glucan and Protein Content in Malting Barley. Journal of Cereal Science 2001; 34: 3295-301.
29. Ojewumi ME, Obielue BI, Emetere ME, Awolu OO and Ojewumi EO: Alkaline Pre-Treatment and Enzymatic Hydrolysis of Waste Papers to Fermentable Sugar. Journal of Ecological Engineering 2018; 19(1): 211- 217.
All © 2013 are reserved by International Journal of Pharmaceutical Sciences and Research. This Journal licensed under a Creative Commons Attribution-NonCommercial-ShareAlike 3.0 Unported License.
This article can be downloaded to ANDROID OS based mobile. Scan QR Code using Code/Bar Scanner from your mobile. (Scanners are available on Google Playstore)
How to cite this article: