N A N O E X P R E S S
Open Access
Time-dependent pH sensing phenomena using
CdSe/ZnS quantum dots in EIS structure
Pankaj Kumar
1, Siddheswar Maikap
1,2*, Amit Prakash
1and Ta-Chang Tien
3Abstract
Time-dependent pH sensing phenomena of the core-shell CdSe/ZnS quantum dot (QD) sensors in EIS (electrolyte insulator semiconductor) structure have been investigated for the first time. The quantum dots are immobilized by chaperonin GroEL protein, which are observed by both atomic force microscope and scanning electron microscope. The diameter of one QD is approximately 6.5 nm. The QDs are not oxidized over a long time and core-shell CdSe/ ZnS are confirmed by X-ray photon spectroscopy. The sensors are studied for sensing of hydrogen ions concentration in different buffer solutions at broad pH range of 2 to 12. The QD sensors show improved sensitivity (38 to 55 mV/pH) as compared to bare SiO2sensor (36 to 23 mV/pH) with time period of 0 to 24 months, owing to the reduction
of defects in the QDs. Therefore, the differential sensitivity of the QD sensors with respect to the bare SiO2sensors
is improved from 2 to 32 mV/pH for the time period of 0 to 24 months. After 24 months, the sensitivity of the QD sensors is close to ideal Nernstian response with good linearity of 99.96%. Stability and repeatability of the QD sensors show low drift (10 mV for 10 cycles) as well as small hysteresis characteristics (<10 mV). This QD sensor is very useful for future human disease diagnostics.
Keywords:pH sensor; CdSe/ZnS quantum dots; EIS structure; Sensitivity
Background
Among the numerous chemical sensors, pH sensor is the major field of research area, which is one of the controlled parameter for the biochemical industrial processes. Lots of aspects have been identified to detect the hydrogen ions under different environment conditions. In development of solid state sensor, recent approaches are ISFET (ion-sensitive field effect transistor), LAPS (light addressable potentiometric sensor), and capacitance-based electrolyte insulator semiconductor (EIS) [1-4]. Among these devel-opments, EIS has shown potential in terms of its simple structure, label-free detection, easy fabrication procedure, and cost effectiveness [5,6]. In addition, nanoparticles have generated considerable interest as diagnostic tool because of their small sizes and comparatively higher surface area that leads to more interaction with ions in solution [7-10]. Semiconductor nanoparticles such as quantum dots (QDs) are one of the major candidates being
studied for sensor development [11,12]. The QDs are
better than bare SiO2 sensing membrane because of
their high surface area to volume ratio which gives the platform for controlled immobilization of the biomole-cules. In addition, the QDs have been studied as fluor-escent labels for bioimaging as well as ionic probes to detect chemical ion concentration in electrolyte solu-tion and immunosensor for cancer detecsolu-tion [13-16]. Long-term environmental stability for robust sensing device is still a major limitation due to environmental factors, such as exposure of reactive ions, humidity, and temperature; results in transformation of nanopar-ticles such as photooxidation or size change have been reported earlier [17-20]. The controlled distribution of QDs to prevent agglomeration on sensing surface is an-other important aspect for sensitivity enhancement as well as long-term stability of the device. Some protein-mediated approaches have been demonstrated for the controlled ordering of quantum dots array [21-23]. Chaperonin GroEL protein can be used as template to deposit the quantum dots on sensing membrane as they self-assembled themselves in two-dimensional (2D) array. Although many researchers have reported the sensing * Correspondence:[email protected]
1
Thin Film Nano Technology Laboratory, Department of Electronic Engineering, Chang Gung University, Tao-Yuan, Taiwan 333, Taiwan 2
Bio-Sensor Group, Department of Electronic Engineering, Chang Gung University, Tao-Yuan, Taiwan 333, Taiwan
Full list of author information is available at the end of the article
properties using different nanoparticles, time-dependent improved pH sensitivity using CdSe/ZnS QDs has not yet been reported.
In this study, time-dependent pH sensing behavior of
CdSe/ZnS QD membrane on SiO2/Si in EIS structure has
been investigated for the first time. The QDs embedded in protein are observed by both atomic force microscope (AFM) and field-emission scanning electron microscope (FE-SEM) images. After annealing at 300°C, the QDs can be observed clearly by SEM due to the removal of protein. The chemical states of the core-shell QDs have been in-vestigated by x-ray photoelectron spectroscopy (XPS). It is found that the QDs are not oxidized, however, water ad-sorption from environment can be the factor, which re-sults lower defects in the QDs' surface. The values of sensitivity are approximately 34 and 55 mV/pH after ini-tial and 24 months, respectively. The values of differenini-tial sensitivity of the QD with respect to bare SiO2sensors are improved from 12 to 32 mV/pH for longer time, owing to higher surface states of the QDs. A good pH sensing linearity of 99.96% is also obtained with QDs-modified sensor.
Methods
To study the time-dependent pH sensing behavior of the
CdSe/ZnS QDs-modified SiO2 surface, a simple EIS
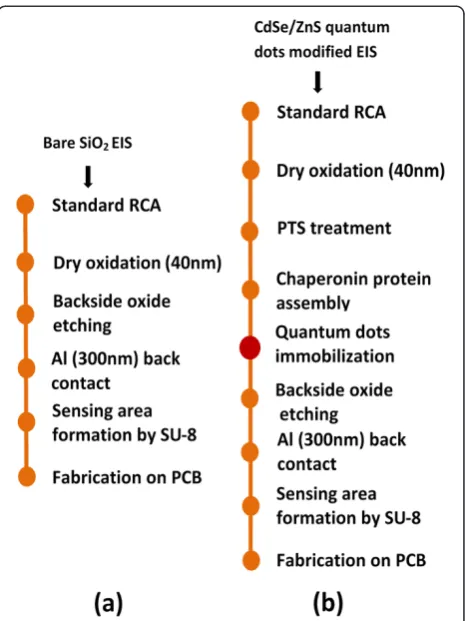
structure has been fabricated. The process flow of all the sensors has been shown in Figure 1. A 4-in. Si wafer was cleaned using standard Radio Corporation of America (RCA) procedure. RCA-cleaned wafer was used to grow 40 nm of SiO2layer by dry oxidation process as an insu-lating layer. Wafers were sonicated in absolute ethanol and dried under nitrogen flow. Dry wafers were used for piranha treatment with temperature maintained at 90°C
for 40 min to make−OH-rich surface on SiO2 layer.
Then wafer samples were rinsed with deionized water and sonicated in spectroscopic grade methanol for 5 min. Samples were dried in oven at 100°C for 60 min. Then, samples were treated with 5%
phenyltriethoxysi-lane (PTS) solution in dry toluene for 60 min under N2
flow to further activate the –OH-rich SiO2surface with silane group. After PTS treatment, wafers were rinsed three times with toluene to remove unreacted silane molecules. Further, the samples were rinsed and soni-cated in methanol for 1 min and dried at 200°C for 2 h. After cooling, the samples were floated in 0.1 mg/ml chaperonin GroEL protein solution (Takara Bio Inc., Otsu, Shiga, Japan) for 15 min. Then, samples were dried in N2flow and the wafers' surface was treated with the QDs solution (Sigma-Aldrich, St. Louis, MO, USA) for 30 min. The QDs' self-assembly around the protein molecule was expected. Samples were separated out from QD solution, rinsed with toluene three times to remove
unbound QDs, and dried under N2 flow. Chaperonin
GroEL protein consist of 14 oligomeric units which form a cage-like structure with a cavity in its middle. Chaperonin protein molecules can be self-assembled into a crystalline lattice through non-covalent interac-tions between the proteins. Cysteine amino acids (Cys138) present at the outer side of apical domain and at the bottom of equatorial domain (Cys 458 and Cys 519) have been reported earlier [24]. After CdSe/ZnS QDs distribution over protein array, QDs attached to the chaperonin molecule via ZnS interaction with thiol group of cysteine instead at the central cavity as ob-served from the microscopic characterization. Chaper-onin protein was used for controlling the distribution
and immobilization of QDs on SiO2surface. However,
this did not play any role in pH sensing. After anneal-ing at 300°C for 30 min in air atmosphere, the protein molecule burned out and the QDs remained on the SiO2surface. This process was optimized and it was re-peatable. However, there will be variation of the QD density as well as the sensitivity.
[image:2.595.306.539.87.398.2]To fabricate the device on copper-coated printed cir-cuit board (PCB), the back oxide of Si wafer was etched by BOE (buffer oxide etchant) and the aluminum back electrode was deposited by thermal evaporation. Then,
Figure 1Fabrication process flow of EIS sensors.(a) Bare SiO2.
sensing area (3.14 mm2) was defined on the device by photolithography using negative photoresist SU-8 (MicroChem, Newton, MA, USA). The device was fixed on the Cu lining pattern on PCB board using silver paste. Finally, an insulating layer of epoxy was used to pack the chip except sensing area. The schematic
dia-gram of the EIS sensor using QDs/SiO2 membrane is
shown in Figure 2.
The surface topography of chaperonin mediated QDs
distribution on SiO2 surface was investigated by using
an Innova scanning probe microscope (SPM) system (Bruker Corp., Bellerica, MA, USA). The AFM image was measured in tapping mode with a scan at area of
500 × 500 nm2. The size and topography of the QDs
were investigated using FE-SEM (MSSCORPS Co. Ltd., Taiwan). The chemical bonding of the CdSe and ZnS elements was investigated by XPS. The EIS structure was transferred to the analyzing chamber at ultra-high vacuum
of 1 × 10⁻⁹Torr. The XPS spectra were recorded using
Al Ka monochromatic x-ray source with energy of
1,486.6 eV. The scan was from 0 to 1,350 eV with step energy of 1 eV.
Capacitance-voltage (C-V) measurement was done
using HP4284A in different pH buffer solutions. An Ag/ AgCl electrode was used as a reference electrode and it
was grounded during C-V measurement. The bias was
applied on the Al bottom electrode. All measurements were done at 100 Hz. To obtain the steady results, all samples were kept in reverse osmosis (RO) water for 24 h before measurement. The EIS sensors were washed with deionized (DI) water before electrode transfer to subsequent pH solution. The ConCap response of
QD-modified EIS pH sensor was measured up to ten re-peated cycles to check any drift in pH sensitivity in each buffer solution. ConCap response was studied from acidic to basic pH and reversed to study the hysteresis effect of EIS sensors. To measure ConCap response, the QD-modified EIS sensor was washed with DI water after each step during repetitive measurement at the same buffer solution.
[image:3.595.305.538.431.690.2]Results and discussion
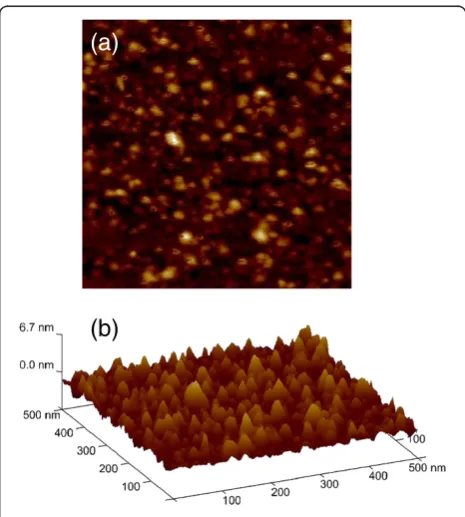
Figure 3 shows topography of the QDs embedded in chaperonin protein, observed by AFM. Two-dimensional AFM image is shown in Figure 3a, and three-dimensional (3D) image is shown in Figure 3b. The average (Ra) and
root mean square (rms; Rq) surface roughness are
found to be 0.642 and 0.836 nm, respectively. The
density of QDs is approximately 1011/cm2. Quantum
dots immobilization and distribution around protein cavity are also observed by FE-SEM, as shown in Figure 4. The distribution of the QDs on chaperonin protein layer
attached on SiO2surface (Figure 4a) and very few QDs
appear on the surface, as most of the QDs have been attached at both side and the bottom of protein via ZnS-thiol group interaction at cysteine amino acid. After annealing at approximately 300°C, the sacrificial chaperonin protein layer burned out and a structure of quantum dots arranged around the protein molecules
Figure 2Schematic diagram of CdSe/ZnS QD sensor in EIS structure on PCB.The reference electrode and sensor isolation are shown.
(a)
[image:3.595.57.291.494.695.2](b)
Figure 3AFM image of the CdSe/ZnS quantum dots distribution in chaperonin protein on SiO2/Si substrate. (a)2D
developed, as shown by different magnifications in Figure 4b,c. Development of QD ring-like structure after annealing is expected to be due to the removal of sacrificial protein molecules. The diameter of one QD from SEM image is approximately 6.5 nm. The chem-ical bonding of the QDs has been investigated by XPS, which is discussed below.
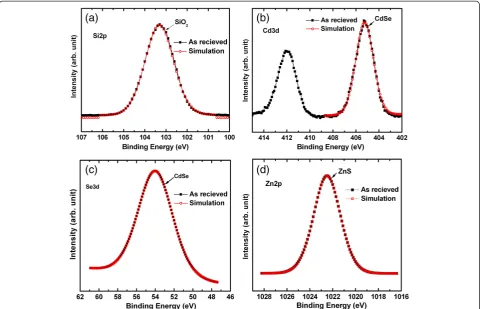
Figure 5 shows the XPS characteristics of bare SiO2
and QDs. The peak fitting was performed by Shirley subtraction and Gaussian method. The peak binding
en-ergy of Si2p is approximately 103.31 eV (Figure 5a),
which is similar to the reported value of 103.58 eV [25]. This Si2prepresents the SiO2film. Figure 5b shows the XPS spectra of 3dcore-level electrons of the CdSe. The peak binding energies of Cd3d3/2and Cd3d5/2electrons are found to be 412 and 405.24 eV, respectively. Liu et al. [26] reported the peak binding energy of CdSe at 405.46 eV. The CdSe element is also confirmed by Se fit-ting with peak energy of 54 eV, as shown in Figure 5c.
The core-level energy of Zn2p3 is approximately at
1,022.49 eV (Figure 5d), which is close to the reported peak binding energy at 1,022.73 eV [27]. By fitting, ZnS element is confirmed. Therefore, core-shell CdSe/ZnS QDs are confirmed from the XPS analysis. It is import-ant to note that these QDs are not oxidized by environ-ment or our devices' process. It is expected that this QD-modified EIS sensor will have good sensing proper-ties, which are explained below.
Figure 6 shows C-V characteristics with different pH buffer solutions for the QD EIS sensor after 24 months. It is noted that higher frequency measurement has lower sensitivity and the lower frequency has a stressing effect on the EIS sensor. That is why the optimizedC-V
meas-urement was done at 100 Hz. The C-V curves shift,
owing to different pH values. The flat band voltage (Vfb) is measured at a normalized capacitance of 0.65. Sensi-tivity of the sensors is calculated from voltage shift in
the C-Vcurves with respect to change in pH using the
equation as given below:
Sensitivity¼ΔVfb
ΔpH ð1Þ
The values ofVfb decrease with increase in the pH of buffer solutions (Figure 7), which can be explained by the combination of Site Binding model as well as Guloy-Chapman-Stern model at the electrolyte-oxide interface
[28]. Bare SiO2sensing membrane at EIS surface
under-goes silanol formation in water which further underunder-goes protonation and de-protonation reaction after contact with electrolyte solution as explained by the Site Binding model.
[image:4.595.58.291.88.678.2]SiOHþHþ↔SiOHþ2 ð2Þ
SiOH↔SiO−þHþ ð3Þ
According to this model, the combination of ionic states as shown above results from the surface charge at one par-ticular pH. At different pH buffer solutions, the surface charge varies according to the density of ionic states at the oxide surface. However, a collective effect of surface charge and ionic concentration results in the effectively charged layer at sensor-electrolyte interface known as stern layer, which is explained by Guoy-Chapman-Stern model. A com-bination of surface charge as well as the thickness of electric double layer at sensor-electrolyte interface defines the face potential of EIS sensor at different pH values. The sur-face potential of EIS sensing membrane can be determined at particular pH by Nernst equation as shown below:
E¼E0þ2:303RT
F In H
þ
½ ð4Þ
whereEis the sensing membrane potential without
elec-trolyte solution, Ris the universal gas constant of 8.314 JK−1mol−1.Tis the absolute temperature, andFis Fara-day constant of 9.648 × 10⁻⁴C-mol−1. It is assumed that
the CdSe/ZnS QDs immobilized at SiO2 surface have
higher negative charge results in the thicker stern layer or
[image:5.595.58.539.89.398.2]more H+ ion accumulation at sensor-electrolyte interface results in higher density of ionic states at the surface. The higher ions' reactivity at the sensing membrane surface lead to higher surface potential which ultimately results in moreVfbshift for the QD sensors.
Figure 5XPS characteristics of core-shell CdSe/ZnS QDs on SiO2/Si substrate.Core-level spectra of(a)Si2pfor SiO2,(b)Cd3dfor CdSe,
(c)Se for CdSe, and(d)Zn2p3 for ZnS are shown. The core-shell CdSe/ZnS QDs are confirmed.
Figure 6TypicalC-Vcharacteristics of QD sensor.TheC-V
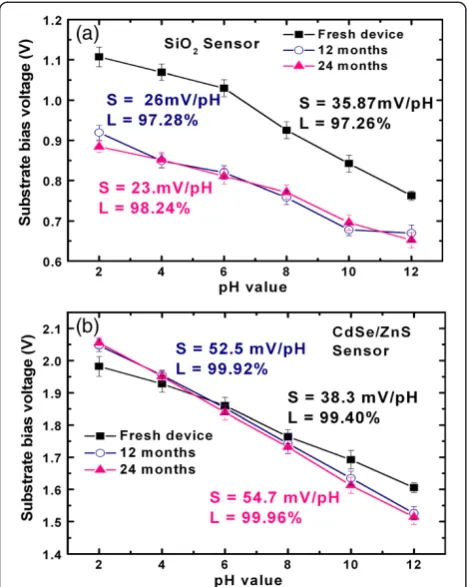
[image:5.595.307.538.523.695.2]It is interesting to note that the time-dependent sensitiv-ity of both the EIS sensors is observed over a time period of 24 months. A comparison of the sensitivity and linearity
study of bare SiO2and CdSe/ZnS quantum dot sensors at
different time periods is shown in Figure 7. Initially, the
bare SiO2 sensors show the pH sensitivity 35.87 mV/pH
with linearity 97.26%. The sensitivity of bare SiO2EIS sen-sors is not stable and even worse with time (Figure 7a). The values of sensitivities (linearity) are found to be 26 (97.28%) and 23 mV/pH (98.24%) after 12 and 24 months, respect-ively. The degradation in sensitivity of bare SiO2EIS sensor with time is attributed to the dissolution of silanol at higher acidic or basic pH in electrolyte solution. On the other hand, the sensitivity of the QD sensors shows stable and better response than the bare SiO2 sensors. Initially, the CdSe/ZnS QD sensors show the sensitivity of 38.3 mV/pH with good linearity of 99.40% (Figure 7b), which is com-paratively higher than the pH sensing response of Au nano-particles as reported by Gun et al. [10]. The values of sensitivity are improved to 52.5 and 54.7 mV/pH, while the values of linearity are found to be 99.92% and 99.96% after 12 and 24 months, respectively. After 24 months, the sensi-tivity of the QD sensors is near to ideal Nernstian response. The differential sensitivity of the QD with respect the bare
SiO2sensors also remarkably improved from 2 to 32 mV/
pH with time. Therefore, the QD sensor can be used as a differential sensor. Cordero et al. [18] proposed the im-proved luminescence behavior of QDs after passivation of the surface trap states by adsorption of water molecules and reduction in the defect sites at CdSe quantum dots. However, this phenomenon is followed by photooxidation of the QDs' surface, which is opposite of surface passiv-ation, which induces the defects in QDs' surface. In our case, we observe the similar behavior over long time. The passivation of quantum dots' surface by water molecule ad-sorption is expected from the environment's humidity, as sensor devices were kept at room temperature and mea-sured for pH sensitivity repeatedly. In addition, sensitivity evolution with time is also in agreement of mechanism pro-posed by Asami et al. [29]. They reported the change in ad-sorption state of TOPO on CdSe surface as TOPO (Lewis base) passivates the unbonded Se surface on longer photoil-lumination, and the shift in adsorption state of TOPO leads to the change in surface states of CdSe nanocrystals.
Bare SiO2sensor does not respond very well at acidic pH compared to basic pH, while core-shell CdSe/ZnS QD
sensor shows good linearity from pH 2 to 12. Bare SiO2
shows small pH differentiation for acidic because the iso-electric point of SiO2thin film grown by thermal oxida-tion is approximately 4.2 [30]. To check the stability and
repeatability of fresh bare SiO2 and QD EIS sensors, a
[image:6.595.57.291.89.383.2]ConCap response measurement has been studied at 2 to 12 pH buffer solutions, as shown in Figure 8. Bare SiO2 sensor shows the comparatively higher drift at highly acidic and highly basic pH due to silanol dissolution in electrolytes (not shown here). The core-shell CdSe/ZnS QD sensor shows acceptable drift of 10 mV as well as small hysteresis (<10 mV) studied up to 10 cycles in each pH buffer solution as well as it shows very less hysteresis Figure 7Time-dependent pH sensitivity.Sensitivity characteristics
of(a)bare SiO2and(b)CdSe/ZnS QD sensors for 0 to 24 months.
Three sensors of each sample are considered to calculate average sensitivity and linearity.
[image:6.595.306.538.527.694.2]effect than the bare SiO2EIS sensors. High surface area as well as sensitivity improvement over the years also sug-gests that the CdSe/ZnS QD sensor has a potential to de-tect biomolecules with longer lifetime.
Conclusions
The CdSe/ZnS QDs in EIS structure have been success-fully immobilized on SiO2film using chaperonin protein. The QDs are observed by AFM and FE-SEM images, and the diameter of each QD is found to be approximately 6.5 nm. The core-shell CdSe/ZnS QDs are also confirmed by XPS, and the QDs are not oxidized even after long ex-posure time in air. Initially, improved pH sensitivity of the QD sensor is observed as compared to the bare SiO2 sen-sor (approximately 38 vs. 36 mV/pH) and it is further im-proved after 24 months (approximately 55 vs. 23 mV/pH), and the differential sensitivity with respect to bare SiO2 sensor is improved from 2 to 32 mV/pH, owing to the re-duced defects in QDs with time. Good linearity of 99.96% is also obtained for a longer time. In addition, good stabil-ity and repeatabilstabil-ity of quantum dots-modified EIS sen-sors are obtained by ConCap response of devices at 2 to 12 pH buffer solutions. This simple QD EIS sensor paves a way in future human disease investigation.
Competing interests
The authors declare that they have no competing interests.
Authors’contributions
PK fabricated and analyzed the EIS sensors. AP helped to fabricate these sensors also. TCT did XPS characteristics and analysis. This research work was carried out under the instruction of SM. First draft of this manuscript was written by PK. All of the authors revised the manuscript and approved it for publication.
Acknowledgement
This work was also supported by the National Science Council (NSC), Taiwan.
Author details
1Thin Film Nano Technology Laboratory, Department of Electronic
Engineering, Chang Gung University, Tao-Yuan, Taiwan 333, Taiwan. 2Bio-Sensor Group, Department of Electronic Engineering, Chang Gung
University, Tao-Yuan, Taiwan 333, Taiwan.3Material and Chemical Research Laboratories, Industrial Technology Research Institute, Hsinchu 310, Taiwan.
Received: 20 February 2014 Accepted: 31 March 2014 Published: 12 April 2014
References
1. Dzyadevych SV, Soldatkin AP, El’skaya AV, Martelet C, Renault NJ:Enzyme biosensors based on ion-selective field-effect transistors.Anal Chim Acta
2006,568:248.
2. Shinwari MW, Deen MJ, Landheer D:Study of the electrolyte-insulator-semiconductor field-effect transistor (EISFET) with applications in biosensor design.Microelectron Reliab2007,2025:47.
3. Wagner T, Rao C, Kloock JP, Yoshinobu T, Otto R, Keusgen M, Schoning MJ:
“LAPS Card”—a novel chip card-based light-addressable potentiometric sensor (LAPS).Sensor Actuat B-Chem2006,118:33.
4. Schoning MJ:“Playing around”with field-effect sensors on the basis of EIS structures, LAPS and ISFETs.Sensors2005,5:126.
5. Poghossian A, Abouzar MH, Sakkari M, Kassab T, Han Y, Ingebrandt S, Offenhausser A, Schoning MJ:Field-effect sensors for monitoring the layer-by-layer adsorption of charged macromolecules.Sensors Actuat B-Chem
2006,118:163.
6. Sakata T, Miyahara Y:Detection of DNA recognition events using multi-well field effect devices.Biosens and Bioelectron2005,21:827. 7. Luo XL, Xu JJ, Zhao W, Chen HY:A novel glucose ENFET based on the special
reactivity of MnO2nanoparticles.Biosens and Bioelectron2004,19:1295.
8. Wang F, Hu S:Electrochemical sensors based on metal and semiconductor nanoparticles.Microchim Acta2009,165:1. 9. Cao X, Ye Y, Liu S:Gold nanoparticle-based signal amplification for
biosensing.Anal Biochem2011,417:1.
10. Gun J, Rizkov D, Lev O, Abouzar MH, Poghossian A, Schoning MJ:Oxygen plasma-treated gold nanoparticle-based field-effect devices as transducer structures for bio-chemical sensing.Microchim Acta2009,164:395. 11. Wang GL, Xu JJ, Chen HY:Selective detection of trace amount of Cu2+
using semiconductor nanoparticles in photoelectrochemical analysis. Nanoscale2010,2:1112.
12. Freeman R, Willner I:Optical molecular sensing with semiconductor quantum dots (QDs).Chem Soc Rev2012,41:4067.
13. Talapin DV, Lee JS, Kovalenko MV, Shevchenko EV:Prospects of colloidal nanocrystals for electronic and optoelectronic applications. Chem Rev2010,110:389.
14. Medintz IL, Uyeda HT, Goldman ER, Matoussi H:Quantum dot
bioconjugates for imaging, labelling and sensing.Nat Mater2005,4:435. 15. Valizadeh A, Mikaeili H, Samiei M, Farkhani SM, Zarghami N, Kaohi M,
Akbarzadeh A, Davarav S:Quantum dots: synthesis, bioapplications, and toxicity.Nanoscale Res Lett2012,7:480.
16. Dennis AM, Rhee WJ, Sotto S, Dublin SN, Bao G:Quantum dot fluorescent protein FRET probes for sensing intracellular pH.ACS Nano2012,6:2917. 17. Pechstedt K, Whittle T, Baumberg J, Melvin T:Photoluminescence of
colloidal CdSe/ZnS quantum dots: the critical effect of water molecules. J Phys Chem C2010,114:12069.
18. Cordero SR, Carson PJ, Estabrook RA, Strouse G, Buratto SK:Photo-activated luminescence of CdSe quantum dot monolayers.J Phys Chem B2000,
104:12137.
19. Nirmal M, Dabbousi BO, Bawendi MG, Macklin JJ, Trautman JK, Harris TD, Bruss LE:Fluorescence intermittency in single CdSe nanocrystals. Nature1996,383:802.
20. Antipov A, Bell M, Yasar M, Mitin V, Scharmach W, Swihart M, Verevkin A, Sargeev A:Luminescence of colloidal CdSe/ZnS nanoparticles: high sensitivity to solvent phase transitions.Nanoscale Res Lett2011,6:142. 21. Lee SK, Mao C, Flynn CE, Belcher AM:Ordering of quantum dots using
genetically engineered viruses.Science2002,296:892.
22. Mcmillan RA, Howard J, Zaluzec NJ, Kagawa HK, Mogul R, Li YF, Paavola CD, Trent JD:A self-assembling protein template for constrained synthesis and patterning of nanoparticle arrays.J Am Chem Soc2005,127:2800. 23. Mcmillan RA, Paavola CA, Howard J, Chan SL, Zaluzec NJ, Trent JD:Ordered
nanoparticle arrays formed on engineered chaperonin protein templates.Nat Mater2002,1:247.
24. Elad N, Farr GW, Clare DK, Orlova EV, Horwich AL, Saibil HR:Topologies of a substrate protein bound to the chaperonin GroEL.Cell2007,26:415. 25. Zhao X, Scott SA, Huang M, Peng W, Kiefer AM, Flack FS, Savage DE,
Lagally MG:Influence of surface properties on the electrical conductivity of silicon nanomembranes.Nanoscale Res Lett2011,6:402.
26. Liu IS, Lo HH, Chien CT, Lin YY, Chen CW, Chen YF, Su WF, Liou SC:Enhancing photoluminescence quenching and photoelectric properties of CdSe quantum dots with hole accepting ligands.J Mater Chem2008,18:675. 27. Zhu CQ, Wang P, Wang X, Li Y:Facile phosphine-free synthesis of CdSe/
ZnS core/shell nanocrystals without precursor injection.Nanoscale Res Lett
2008,3:213.
28. Chen S, Bomer JG, Carlen ET, Berg AV:Al2O3/silicon nanoISFET with near
ideal Nernstian response.Nano Lett2011,11:2334.
29. Asami H, Abe Y, Ohtsu T, Kamiya I, Hara M:Surface state analysis of photobrightening in CdSe nanocrystal thin films.J Phys Chem B2003,
107:12566.
30. Cuddy MF, Poda AR, Brantley LN:Determination of isoelectric points and the role of pH for common quartz crystal microbalance sensors. ACS Appl Mater Interfaces2013,5:3514.
doi:10.1186/1556-276X-9-179