BIROn - Birkbeck Institutional Research Online
Rossi, Federica and Rosli, A. (2015) Indicators of university–industry
knowledge transfer performance and their implication for universities:
evidence from the United Kingdom. Studies in Higher Education 40 (10),
pp. 1970-1991. ISSN 0307-5079.
Downloaded from:
Usage Guidelines:
Please refer to usage guidelines at or alternatively
Please cite as: Rossi, Federica and Rosli, Ainurul (2014) Indicators of university–industry knowledge transfer performance and their implication for universities: evidence from the United
Kingdom, Studies in Higher Education, DOI: 10.1080/03075079.2014.914914
Indicators of university-industry knowledge transfer performance and their
implications for universities: evidence from the United Kingdom
Abstract:
The issue of what indicators are most appropriate in order to measure the performance of
universities in knowledge transfer (KT) activities remains relatively under-investigated. The main
aim of this paper is to identify and discuss the limitations to the current measurements of university-industry KT performance, and propose some directions for improvement. We argue
that university-industry KT can unfold in many ways and impact many stakeholders, and that,
especially in highly differentiated university systems, choosing indicators focused on a narrow range of activities and impacts might limit the ability of universities to accurately represent their KT performance. Therefore, KT indicators should include a variety of activities and reflect a variety of impacts, so as to allow comparability between different institutions and avoid the creation of undesirable behavioural incentives. To illustrate these issues empirically, we discuss the case of the United Kingdom’s Higher Education –Business and Community Interaction (HE-BCI) survey.
Keywords: Knowledge transfer, knowledge exchange, performance indicators, university-industry relationships, HE-BCI survey
1. Introduction
The creation and dissemination of new knowledge underpinning innovation is considered as a fundamental driver of economic growth (Romer, 1990). In their role as knowledge producers, universities are increasingly recognized to play a fundamental part in supporting regional and national growth. Indeed, transferring productive knowledge to the economy has become a “third mission” for universities, complementing the traditional research and teaching missions: universities are no longer ivory towers, producing knowledge in isolation, but they are expected to engage with a multiplicity of stakeholders in order to deliver economic benefits (Etzkowitz and Leydesdorff, 2000).
Castro-Martinez, 2007) and funding for the development of a supporting infrastructure, whether at national level (as in Sweden; Sellenthin, 2006), or regional and State level (as in Germany and in the United States; Sellenthin, 2006; PACEC, 2010). In the UK, the main public funding councils for higher education have launched a specific “third stream” of funding (so called in order to distinguish it from the other funding streams for education and research) to support and incentivize universities’ KT activities (Molas-Gallart and Castro-Martinez, 2007; Kitagawa and Lightowler, 2012). The recent Witty report (2013) advocates highly targeted interventions in order to encourage maximum engagement from universities in the third mission agenda.
The growing economic importance attributed to universities’ engagement in KT activities has led policymakers in many countries to design tools for monitoring and evaluating universities’ KT performance. Monitoring often occurs through systematic data collection exercises, whereby universities are requested to provide quantitative information that describes their engagement in various areas. In the United States and Canada, the Association of University Technology Managers (AUTM) runs a yearly survey of university technology transfer offices, mainly focused on technology commercialization, addressed to about 200 research universities. At European level, several associations of technology transfer offices such as the European Knowledge Transfer Association (ProTon) and the Association of European Science and Technology Transfer Professionals (ASTP) organize their own surveys, addressed to the associations’ members. In Spain the Conference of University Rectors distributes an annual survey to the technology transfer offices of universities and public research organizations (Molas-Gallart and Castro-Martinez, 2007). In the UK the Higher Education Statistics Agency manages a yearly survey of all universities in the country (Higher Education Business and Community Interaction survey, henceforth HE-BCI) collecting a large amount of information about their KT activities. Australia is debating the implementation of a similar exercise, following closely on the indicators used in the UK (Jensen et al., 2009).
The choice of indicators for these exercises carries important implications for universities. Indicators are recognized to play a performative role (Davis et al., 2012; Merry, 2011; Teixeira and Koryakina, 2013): that is, they signal what activities are considered important by policymakers and funding agencies, and what kind of performance may be associated to implicit rewards, such as better reputation and prestige. In some countries, indicators are used to provide an overview of universities’ strengths and weaknesses (e.g. through the construction of Key Performance Indicators; Chalmers, 2008) and even to allocate funding. It is therefore important that indicators are carefully chosen to allow universities to provide a fair and accurate representation of their KT activities, without introducing implicit behavioural incentives.
a-theoretical nature, the indicators that are used in practice to assess universities’ KT performance suffer from numerous limitations.
The main aim of this article is to identify and discuss the limitations to the current approaches to the measurement of university-industry KT performance, illustrating them with a case study, and to propose some directions for improvement. In section 2, we consider the problem of identifying appropriate KT indicators in general terms: we argue that KT activities can unfold in many ways and can have many impacts, and that choosing indicators focused on a narrow range of activities and impacts might hamper the ability of universities to accurately represent their KT performance. In order to allow comparability between different institutions and avoid the creation of undesirable behavioural incentives, KT indicators should therefore include a variety of activities and reflect a variety of impacts. In section 3, we illustrate this argument empirically by considering the case of the UK. We argue that the indicators used to measure and reward universities’ KT engagement are better suited to capturing the impact of certain types of activities than others and that, since institutions have different profiles of engagement in KT, this may lead some of them to be unable to correctly represent their actual performance. In section 4, we derive some implications for policy. It must be stressed that this
study focuses on universities’ third missionactivities, and it does not discuss the indicators used
to measure universities’ performance in other areas such as teaching and research.
2. The nature of knowledge transfer and its implications for the choice of performance indicators
The identification of appropriate indicators of universities’ performance is complicated by the complex nature of KT activities (Kingsley, et al., 1996; Bekkers and Bodas Freitas, 2008; Hughes et al, 2011), whose impacts are often difficult to observe and quantify (Hughes et al., 2011). KT usually occurs through interactions rather than simple transactions, and the success of
the process depends substantially on the interaction processes themselves (the frequency,
characteristics and quality of the interactions), as well as on the active participation of the intended recipient of such transfer. It has been shown that the specific identities of the parties involved matter for the nature and success of KT: for knowledge to be communicated and received properly, the organizations involved must possess a relevant knowledge base and adequate absorptive capacity (Cohen and Levinthal, 1990; Ternouth et al., 2012). Moreover, KT is not a uni-directional process in which universities simply transmit their findings to firms and other organizations. Rather, all the parties involved (including of course the university itself) can potentially learn from the interaction (Sharifi et al., 2013), (as has been acknowledged in the
policy literature with a recent focus on bi-directional “knowledge exchange”; HEFCE, 2012),
and KT activities generate spillovers that benefit agents beyond those involved in the initial transfer. Hence, the impact of KT often goes beyond the immediate outputs produced by such activities and the set of their intended recipients, and its value can not easily be captured in economic terms.
Choosing appropriate indicators in order to measure universities’ KT performance is therefore a complex task that must recognize the variety of KT activities performed, the
specificity of each of these activities, the difficulties inherent in identifying what “counts” as
outline several dimensions that should be taken into account when attempting to measure universities’ KT performance in a fair and accurate way.
Variety of KT activities. The range of KT activities considered must be broad enough to reflect the variety of activities undertaken by universities: if the choice of activities to be measured is not sufficiently comprehensive, the indicators may misrepresent the performance of universities that engage in activities that are not measured. As an example, evidence shows that universities engage in a plurality of interactions with economic and community stakeholders, only a few of which are based on the sale and licensing of patents and the industrial exploitation of academic research outcomes (Bekkers and Bodas Freitas, 2008). Since the universities that specialize in the arts and humanities rarely produce patentable research outputs, relying upon indicators heavily focused on the filing of patents and the execution of licenses could prevent these universities from correctly representing the KT activities they engage in.
Variety of impacts. Focusing only on indicators directed at measuring the outputs of KT activities may penalize universities that transfer knowledge whose social and economic impact is not accurately reflected by the diffusion of measurable outputs. For example, while the number of consultancy contracts a university stipulates provides some measure of academics’ engagement in KT, it does not provide information about the benefits that such activities generate for the receiving organizations. A particularly problematic indicator is the income that universities receive from their KT activities. Income is assumed to reflect the value that external partners place on the knowledge they receive from universities, and hence to provide a proxy of the value created through KT. However, this assumption is questionable, and several arguments support the view that the income a university receives for KT does not necessarily reflect the impact of its activities:
more prestigious institutions may be able to charge more for their services because of
reputation, not because of the value of the transferred knowledge is greater (on the economic returns on reputation, see Fombrun 1995; Roberts and Dawling, 2002);
the cost of KT activities varies widely, and higher income may simply reflect the higher
cost of providing a certain service. For example, the cost of KT activities in the social sciences and humanities is often lower than in areas like medicine and engineering where expensive equipment or complex clinical studies may be required;
some forms of knowledge are transferred at a very low price because they are aimed at
beneficiaries with limited income (such as services to the community) but their value can be high from a social viewpoint (Hatakenaka, 2005);
in order to achieve greater impact, universities may choose to disseminate knowledge for
free under open source licenses or other open mechanisms (Sorensen and Chambers, 2008);
some KT activities may generate, similarly to basic research activities (Nelson, 1959;
when: therefore they would be willing to pay a price that only partially reflects the value of the benefits that they will eventually capture.
Comparability between institutions. Indicators may be strongly affected by factors related to institutional characteristics such as size and subject mix. For example, reliance on indicators based on the absolute amount of KT activities performed, rather than on measures of engagement in KT per unit of staff, could disadvantage smaller universities. The choice of indicators should allow comparability among different institutions, so that different outcomes can be ascribed to genuine performance differentials rather than to institutional characteristics.
Behavioural incentives. The system should be structured in such a way as to avoid the creation of undesirable behavioural incentives. If the chosen indicators specifically reward only certain KT activities, and not others, this creates implicit incentives for universities to engage only in the activities that are rewarded; but these activities may not necessarily be the most effective ways to transfer knowledge for all universities. For example, if the choice of indicators rewards universities that transfer knowledge through the sale of patents and licenses, this would incentivise universities to apply for more patents, even when this is not beneficial (Lambert, 2003). The problem of behavioural incentives is very broad, and links to another important issue: the interaction between KT and teaching and research activities. It is well known that while KT can productively complement and enhance teaching and research (Abreu et al, 2008), occasionally it can also give rise to conflicting incentives (Lambert, 2003). Indicators of KT performance should therefore take care to avoid incentivizing academics to undertake behaviours (such as excessive patenting and secrecy or allowing excessive influence of industrial sponsors on research design and the selection of research results), which in the long run may undermine scientific credibility and reduce the possibility for others to perform research.
Since there are major differences among countries in terms of how KT between university and industry is measured, in the next section we focus on the case of the UK to illustrate how the indicators fare with respect to these dimensions, and what are the implications for the universities’ ability to adequately represent their KT performance. This case is interesting for several reasons. As the UK is one of the first countries to have launched a comprehensive data collection exercise on universities’ KT activities (the HE-BCI survey), its choice of indicators is likely to provide a benchmark for policymakers in other countries. Therefore, understanding their drawbacks and implications is relevant beyond the country’s borders. Since the HE-BCI survey is very comprehensive when compared to other systematic data collection
exercises on universities’ KT activities1, any limitations identified with respect to this survey
apply even more strongly to similar exercises implemented in other countries. The availability of secondary data that are comparable across different institutions and over time allows us to support some of our arguments with quantitative evidence.
1 Rosli and Rossi (2014) present a comparison among the surveys implemented in the UK, USA and Canada,
3. Case study: the HE-BCI survey in the United Kingdom and third stream funding allocation in England (HEIF)
In the late 1990s, the Higher Education Funding Council for England (HEFCE) began to run a systematic survey (HE-BCI) aimed at capturing the intensity and characteristics of the exchange of knowledge between higher education institutions, the business community and society at large (HEFCE, 2012). The most recent editions of the survey consist of two parts: Part A for data on universities’ KT strategies, policies and infrastructures, and Part B for financial
and other quantitative data measuring engagement in and impact of KT, in a specific year.2
The HE-BCI survey is addressed to all universities in the UK. The information collected through this survey is used to support evidence-based policymaking (HESA, 2012) and to determine the allocation of third stream funding: the Higher Education Innovation Fund (HEIF) in England, the Innovation and Engagement Fund in Wales, the Knowledge Transfer grant in Scotland and the Higher Education Innovation Fund (HEIF) in Northern Ireland. While, over time, all of these funds have moved from competitive to formula-based allocation, the English HEIF is the only one that, following the recommendation of the Sainsbury Review (2007) is
currently allocated 100% through a formula3. Since 2012, all third stream funding in England is
distributed pro-rata to universities according to their share of overall KT income, based on the information presented in Part B of the survey. To compute the institution’s income from KT, the incomes derived from each activity considered in part B are summed over (each activity is weighted equally, although any income obtained from SMEs is assigned double weight). Then, funds from HEIF are assigned to each institution proportionally to that institution’s share of overall KT income, as long as the institution reaches a minimum threshold income of £250,000. The actual allocation depends on the HEIF’s annual budget.
In the following section 3.1, we analyze the indicators included in the HE-BCI survey, arguing that the focus on a limited variety of KT activities and impacts reduces the comparability between institutions and leads to the creation of possibly undesirable behavioural incentives. Then, in section 3.2, we analyse how the system of reward of universities’ KT performance, entirely based on the KT income that universities accrue, reinforces these patterns. The analysis is based on the indicators contained in the most recent (2010/11) edition of the HE-BCI survey, on data from the same edition of the survey and data on the HEIF funding allocations received
by 131 English universities4 in 2013.
3.1. The HE-BCI survey: a critique of the chosen indicators
Table 1 summarises the areas and indicators measured in Part B of the HE-BCI survey5.
Each of Part B’s five sections, listed in the first column, includes several key dimensions or sub-areas (listed in the second column). Several indicators are used in order to measure performance in each sub-area (listed in the third column).
2 Since 2009, the survey has been collected and validated by the Higher Education Statistics Agency (HESA). 3 The shares of funds allocated through formula are 80% in Northern Ireland, 75% in Wales and 92% in Scotland. 4 Since we use data from HEIF funding allocations in order to support our arguments, we must restrict our
comparative analysis to those institutions that receive funding based on the same formula. We have decided to focus on universities in England, whose third mission funding is distributed 100% through formula allocation, and which constitute the larges share (81%) of UK universities.
5 Since only the quantitative information contained in Part B is used as a basis to compare and reward universities’
Table 1: Activities and indicators included in part B the HE-BCI survey
Sections Sub-areas Indicators
Research related activities
Collaborative research with public funding (i)
Income, in–kind (ii) contribution
Contract research (iii) Income, total value, number of contracts (by: SME (iv) , Non SME commercial, non-commercial)
Business and Community service
Consultancy contracts Income, total value, number of contracts (by: SME , Non SME commercial, non-commercial)
Courses for business and the community (CPD and CE)(v)
Revenue, total learner days delivered(vi) (by: SME , Non SME
commercial, non-commercial, individual)
Facilities and equipment related services
Income, total value, total number of services (by: SME , Non SME commercial, non-commercial, individual)
Regeneration and
development programs
Regeneration and development programs
Income from European Regional Development Fund (ERDF), European Social Foundation (ESF), UK Government regeneration funds, Regional Development Agency (RDA) programme, Others Income
Intellectual Property (IP)
Disclosures and patents filed by or on behalf of the HEI
Number of new patent applications filed in year Number of patents granted in year
Cumulative patent portfolio(vii)
Licence numbers Number of licenses for non-software and software (by: SME, non-SME commercial and non-commercial)
IP Income Partner type: SMEs, Other (non-commercial) businesses and other non-commercial organisations).
IP revenues, Total cost
Spin-off activity Spin-offs(viii), staff start-up(ix) graduate start-up(x)
HEI owned, non-HEI owned.
Number of active firms, estimates employment, turnover, investment received
Social, community and cultural engagement
Public lectures, Performance arts, Exhibitions, Museum education, Other
Number of Attendees (free events, chargeable events), staff time
Note to table:
(i) Public funding: UK Department for Business, Innovation and Skills (BIS) research councils, royal society and British Academy, other UK
government departments, EU government, and others.
(ii) In-kind: contributions to the project from the non-academic collaborators. (iii) Non-public funding and research councils.
(iv) Employ fewer than 250 employees worldwide (including partners and executive directors), and has either an annual turnover not exceeding
50m Euros (approximately 42m British Pound), or an annual balance sheet total not exceeding 43m Euros (approximately 36m British Pound), and conforms to the following independence criteria: no more of 25% of the capital or the voting rights is owned by an enterprise falling outside the definition of an SME (HEFCE, 2011).
(v) Excluding pre-registration funded by the National Health Service (NHS) or Training and Development Agency (TDA). (vi) One day is equivalent to one person receiving eight hours of teaching/training.
(vii) Active (registered under licence to an external party) and live patents.
(viii) Spin-offs are defined as companies set-up to exploit IP that has originated from within the HEI.
Table 1 suggests that the variety of KT activities that are monitored through the survey is extensive but not exhaustive. Although the survey tries to capture a full range of KT activities, not all of them are investigated with the same degree of detail and some are overlooked.
The measurement of KT via intellectual property rights and spin offs is attributed high importance, as it includes 4 out of the 10 sub-areas measured in part B of the survey, and nearly 36% of the questions included in the survey. This is despite evidence that shows that only few universities use this model with appreciable intensity and success (Litan et al. 2008), as it suitable to a limited number of scientific fields (Harabi 1995; Brouwer and Kleinknecht 1999). Moreover, the focus is strongly on patents and copyright licenses: little attention is paid to other intellectual property rights (design rights, trademarks) and to many non-proprietary types of intellectual property that universities produce (materials and artefacts not protected by intellectual property rights, or protected by open source or creative common licenses) (Andersen et al., 2012; Baghurst and Pollard, 2009). As some types of disciplines (the arts and humanities, for example) are likely to generate the latter forms of intellectual property rather than patents, institutions that are relatively more focused on these disciplines may be unable to correctly represent the amount of KT they engage in.
Some attention is paid to forms of KT that involve open dissemination: publicly-funded collaborative research with non-academic partners, publicly-funded regeneration programmes and knowledge-dissemination activities in the humanities and social sciences. However, these activities are quite marginal: together, they represent only around 12% of the questions included in the survey. The impact of publicly-funded programmes is mainly measured on the basis of the funding they attracted, neglecting other outputs (collaborative research can produce joint university-industry publications, support joint workshops and other openly disseminated outputs, and regeneration programmes can have many valuable impacts on the community).
While the survey collects information about some interactions with industry and the local business environment and community, several important types are not included, especially those involving students and personal interactions (graduate placements in industry, recruitment of university staff members to industry positions, academics’ participation in industry conferences and workshops, placements of entrepreneurs and industry personnel in universities, visiting scholarships, and others; overviews of the many channels of knowledge exchange are presented in Dutrénit et al., 2010; Hughes et al., 2011; Boardman and Ponomariov, 2009; Jensen, R. et al, 2010; Bekkers and Bodas Freitas, 2008). Furthermore, interactions around production and service activities, such as prototyping, clinical testing and design services, would fall within the very generic area of “Facilities and equipment related services” where they would be grouped with standardized, non-knowledge producing services like room and equipment rental activities.
were asked to state their main objectives, choosing three out of 13 possible options.6 By applying
a hierarchical clustering algorithm7 to these 13 variables, we have identified 6 distinct clusters of
universities according to their key objectives. Universities in the first three groups (clusters 1, 2 and 3) have a national or global focus, although with different emphasis; the rest of the universities have predominantly a local focus. To simplify the analysis, we have further agregated the three smaller clusters with “local” objectives into a single cluster comprising 25
[image:10.595.81.516.214.348.2]institutions8 (cluster 4). Table 2 summarises these clusters.
Table 2. Clustering universities according to their knowledge transfer objectives
Cluster: focus Main knowledge transfer objectives universitiesN. universities% 1. Research and TT Supporting business via research and technology transfer 42 32.06%
2. Education Widening access to education and meeting nation's demand for skills 27 20.61%
3. General Support for SMEs, education and research 37 28.24%
4. Local
Focus on SMEs and local employment; focus on attracting students and building community links; focus on local partnerships and regional skills
25 19.09%
Figure 1 shows the KT engagement profiles of universities in the different clusters. We consider all the activities for which data on the intensity of engagement is collected (number of research contracts, number of consultancy contracts; number of facilities and equipment-related services; learner days of CPD courses provided; number of disclosures; number of licenses; number of spinoffs; academic staff days of public events performed). Each indicator is then divided by the number of academic staff employed by the institution, and normalized to lie between zero and 1.
6 The 13 options are: Access to education, Graduate retention in local region, Technology transfer, Supporting small
and medium size enterprises (SMEs) Attracting inward investment to region, Research collaboration with industry, Attracting non-local students to the region, Support for community development, Developing local partnerships, Management development, Meeting regional skills needs, Meeting national skills needs, Spin-off activity.
7 We have used an agglomerative complete-linkage clustering procedure, according to which units are progressively
grouped into clusters based on a measure of distance. One of the advantages of hierarchical clustering is that the number of clusters can be appropriately selected upon inspection of the dendrogram produced by the clustering algorithm, rather than having to be specified a priori.
8 According to a Kruskal-Wallis rank test, 8 out of the 13 variables used to construct the clusters have statistically
Figure 1. Knowledge transfer engagement profiles of universities in different clusters
The diagram shows that universities in different clusters have different profiles of
engagement, in line with their strategic objectives. Staff at universities in the “Research and TT”
cluster are relatively more engaged in intellectual-property related activities (disclosures,
licenses, spinoff companies). Staff at universities in the “Local” and “Education” clusters are
relatively more engaged in consultancies, public events, CPD courses and facilities and equipment-related services, as their missions bring them to engage more directly with their
stakeholders using a variety of interactions. The “Education” cluster appears to have a more
diversified engagement profile than the other clusters. Hence, it is likely that the indicators included in the HE-BCI survey are more suitable to the KT profiles of certain universities than others. In particular, since the survey focuses heavily on intellectual property-related indicators (especially focusing on patent and copyright licenses), and instead overlooks several KT activities involving students and personal interactions between university and industry staff, those universities that are education-oriented and those that are particularly keen to support employability and local firms may be especially unable to accurately reflect the activities they engage in.
From the point of view of the variety of impacts considered, Table 1 suggests that the choice of indicators is strongly oriented towards quantifying the outputs of KT activities, especially the income received from them. The characteristics and quality of the interactions through which KT takes place (for example their duration, the number of partner organizations and people involved, the partners’ satisfaction with the interactions, their perception of what they learned from the interactions and the short and long term benefits they received) are not considered. The only indicators that capture some interaction aspects measure the number of contracts issued and the partners’ types (SMEs/large firms/ non commercial organizations) and location (within the same region/outside the region).
0 0.02 0.04 0.06 0.08 0.1 0.12
Contract research
Consultancy
Facilities and equipment related services
CPD courses
Spinoff companies Licences
Disclosures Public events
Also, although it was claimed that the dataset provides valuable and in depth commentary on the extent of knowledge exchange in the UK, the indicators only capture uni-directional KT from the HEIs, and no attempts are made to explore the benefits that universities derive from these activities, besides income.
The focus on a limited variety of KT activities and impacts creates problems of comparability and generates potentially undesirable behavioural incentives. Universities that perform activities that are not measured in the survey, or whose outputs are not correctly reflected in the income they generate, are unable to correctly represent their engagement in KT. Over time, this may encourage them to move away from KT activities whose performance is not properly acknowledged, and towards activities that instead are more accurately measured, even though this may not actually translate into greater KT engagement, nor generate greater benefits for the stakeholders that these universities interact with.
The system of monetary reward of universities’ KT performance, based on the allocation of third stream funding through a formula entirely dependent on the income that universities accrue from KT activities, is likely to reinforce these patterns. Using data from the HE-BCI 2010-11, in the rest of our analysis we focus on the limitations of income as an indicator of performance, and on the consequences of a system of performance reward entirely based on income measurement. We argue not only that income in itself is not an accurate proxy for impact, but also that the level of income accrued can depend upon a number of institutional characteristics – a university’s KT profile, its subject mix, its size – which can confound the measurement of performance.
3.2. The limitations of income as an indicator of knowledge transfer performance
According to HEFCE (2011), the choice to assign HEIF funding on the basis of the level of KT income accrued by each institution reflected the objective to “incentivise and support those HEIs that can make the greatest contribution to the economy and society”, since “income remains the best proxy we have for the impact of KE activities on the economy and society; hence it is the best measure of performance and will be used in the formula allocation of HEIF” (HEFCE, 2011). This argument, however, suffers from two weaknesses.
Secondly, the level of income can be high simply because the institution employs a large number of academic and KT staff: this implies rewarding an institution because of the scale of its operations, rather than for the effectiveness with which it uses its resources to generate KT
impacts (rewarding “capacity rather than excellence” as the University Alliance, (2011), put it in
response to a HEFCE consultation), which is not, per se, a way to reward performance.
We present some empirical evidence in support of these two arguments. The first argument is that the amount of income that a university receives from KT in part depends on the nature of the activities it engages in, and does not necessarily reflect the intensity of its engagement in KT or its impact. We find strong correlations between the universities’ KT profiles and the third stream funding that they received, which is based on their income from KT.
Universities in the “Education” and “Local” clusters comprise, together, 40% of the population,
but make up 63% of the group of universities that have received zero funding from HEIF, and
only 13% of the group that has received more than £2m. Universities in the “Research and TT”
clusters are, by contrast, 32% of the population, but only 7% of the group that has received zero HEIF funding and 73% of the group that has received more than £2m. The mean funding obtained by universities in the “Research and TT” cluster (£1,974,043) is much higher than that obtained by universities in all the other clusters (£829,811 in the “General” one, £743,885 in the “Education” one and £775,880 in the “Local” one), and the differences are all statistically
significant. At the same time, as shown in Figure 1, universities in the “Research and TT” cluster
do not always perform more KT activities per academic staff than other universities: indeed,
universities in the “Education” and “Local” clusters tend to do more research contracts,
consultancies, facilities and equipment-related services and CPDs per unit of staff: this suggests that these universites receive less income not because they engage in a lower amount of KT activities per capita, but because they tend to focus on less remunerative KT activities.
Another way to see how the income that universities receive from KT depends on the nature of KT activities they engage in, is to consider the universities’ subject mix. We can expect universities with greater incidence of staff in the arts and humanities to engage in KT activities whose impacts are less likely to be accurately reflected in the income produced, because their target clients are more often disadvantaged socioeconomic groups, or the broader community; furthermore, these activities are generally less costly (compared to, for example, clinical trials and prototyping). Indeed, if we correlate the the institutions’ HEIF funding allocations with the
share of staff employed in each discipline in 2010/11 (considering nine main categories)9 we find
that the correlations between funding allocation and share of staff in most of the sciences are mainly significantly positive, while the correlations between funding allocation and share of staff in some of the arts and humanities and in education are significantly negative. This is shown in Table 3, which reports a positive sign for each significantly positive correlation and negative sign for each significantly negative correlation. From the same table we can also see the correlations between the shares of academic staff in each subject and various measures of KT engagement per academic staff. We find that these correlations are varied, with both the sciences and the humanities displaying positive correlations with some types of engagement and negative correlations with others. Therefore, the higher income received by the universities that have greater share of staff in the sciences is not necessarily due to greater engagement in all kinds of KT activities, but probably to greater engagement in more remunerative ones. For example, the share of staff in Design, Creative & Performing Arts is negatively correlated to HEIF funding
received but it is positively correlated with the number of consultancies per staff and the number of CPDs per academic staff, suggesting that the lower income accruing to these subjects is not necessarity due to lower engagement but to the lower prices that these activities command. The share of staff in Business & Administrative Sciences is positively correlated to the number of disclosures per academic staff, but uncorrelated to the number of patent and copyright licenses per academic staff (maybe because licensing occurs though other mechanisms such as open source contracts, or because the related knowledge is not licensed but openly disseminated), and to HEIF funding.
Table 3. Signs of significant correlations between the share of staff in each discipline and: amount of HEIF allocation, various measures of knowledge transfer engagement per academic staff
% staff in: HEIF
a llo ca tio n in 20 13 /1 4 Numb er o f co ntr act s per aca demic st af f Numb er o f co ns ulta ncie s per aca demic st af f Numb er o f fa cilit ies per aca demic st af f Numb er o f CP Ds per aca demic st af f Numb er o f spi no ff s per aca demic st af f Numb er o f IP licen ses per aca demic st af f Numb er o f dis clo sures per aca demic st af f Numb er o f P ub lic E vent s per aca demic st af f
Medicine, dentistry & health
+ - - + +
Agriculture, forestry & veterinary science
+ + + +
Biological,
mathematical & physical sciences
+ - - +
Engineering & technology
+ - - + +
Architecture & planning
Administrative, business & social studies
- - - +
Humanities & language based studies & archaeology Design, creative & performing arts
- + + -
Education - - -
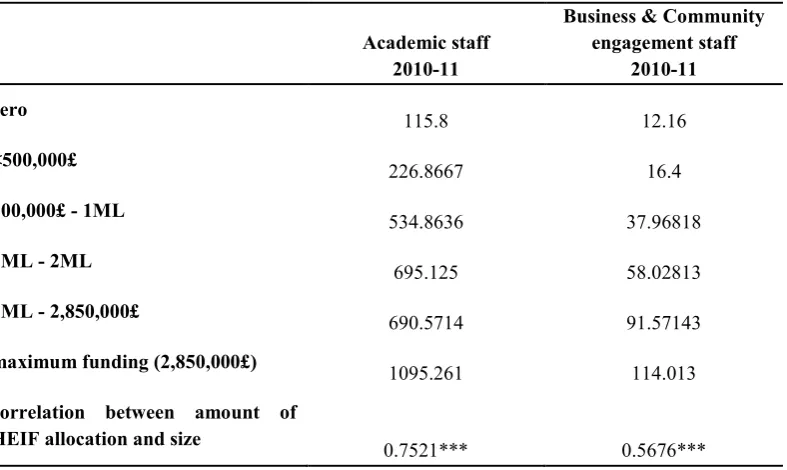
[image:14.595.65.483.255.642.2]some support for the argument that one of the reasons explaining universities’ greater income is
[image:15.595.73.467.107.342.2]their larger size in terms of academic and Business and Community engagement staff10.
Table 4. Average sizes of universities according to HEIF funding received
Academic staff 2010-11
Business & Community engagementstaff
2010-11
zero 115.8 12.16
<500,000£ 226.8667 16.4
500,000£ - 1ML 534.8636 37.96818
1ML - 2ML 695.125 58.02813
2ML - 2,850,000£ 690.5714 91.57143
maximum funding (2,850,000£) 1095.261 114.013
correlation between amount of
HEIF allocation and size 0.7521*** 0.5676***
To capture the effectiveness of a university’s KT performance, it would be more appropriate to use an indicator of income normalized by the amount of resources used to produce it. The following Figure 2 shows how the ranking of the different clusters would change if performance in different types of KT activities was measured in terms of income per academic
staff or income per contract, rather than of total income. The “Research and TT” cluster is ranked
first for all types of KT activities when using total income (on average, universities in this cluster
are significantly larger than those in the “Education” and “Local” clusters), but falls behind in
some of them when income per academic staff or income per contract are used. The “Education”
cluster is ranked first for consultancies when income per contract is used, and first for consultancies, CPDs and facility and equiprment-related services when income per academic
staff is used. The “General” cluster is ranked first for CPDs when income per contract is used.
This suggests that the current approach based on considering the level of total income is not always rewarding the most effective performers, but often the larger institutions.
10 In this paper, we do not deal with the issue of whether it makes sense to reward the KT activities of universities
Figure 2. Sensitivity of performance ranking to different types of indicators
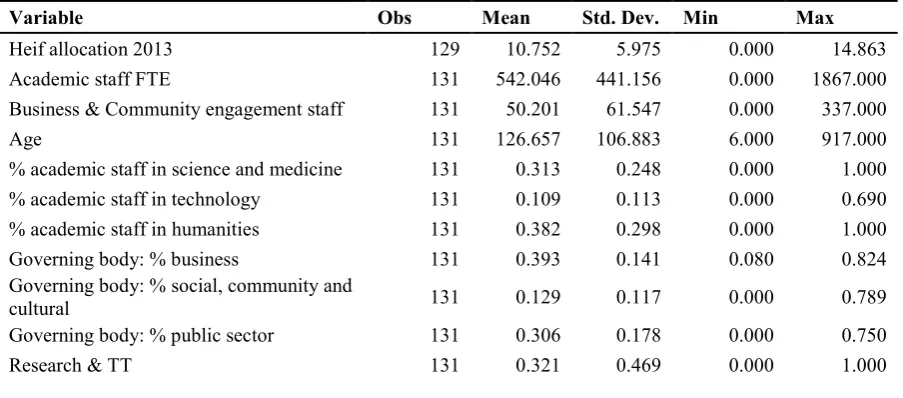
In order to capture the extent to which institutional KT profiles and characteristics (including subject mix and size) together might impact the universities’ ability to generate KT income, we run a regression analysis on the 131 universities. Our dependent variable is the HEIF funding allocation for 2013 (in natural logarithms). The independent variables, whose main descriptive statistics are reported in Table 5, capture some of the main institutional characteristics (size in terms of number of academic staff and of staff employed in Business and Community engagement functions; age of the university; shares of staff in different disciplines), some aspects of the institution’s mission (composition of the governing body) and KT profiles (whether the university belongs to one of the four clusters identified). The variables also capture what sectors are targeted in KT activities and the nature of the KT by the university, whether it is
characterized by large externalities – proxied by the share of income accruing from more “open
ended” and risky activities, i.e. collaborative research and regeneration programmes – or whether it is more appropriable in nature – proxied by the share of income accruing from activities leading to results that are more company-tailored, and therefore more appropriable, such as contract research, consultancy, facilities and equipment-related services. We control for the institution’s region. All the independent variables refer to 2010/11.
Table 5. Descriptive statistics of the variables used in the regression
Variable Obs Mean Std. Dev. Min Max
Heif allocation 2013 129 10.752 5.975 0.000 14.863
Academic staff FTE 131 542.046 441.156 0.000 1867.000
Business & Community engagement staff 131 50.201 61.547 0.000 337.000
Age 131 126.657 106.883 6.000 917.000
% academic staff in science and medicine 131 0.313 0.248 0.000 1.000 % academic staff in technology 131 0.109 0.113 0.000 0.690 % academic staff in humanities 131 0.382 0.298 0.000 1.000
Governing body: % business 131 0.393 0.141 0.080 0.824
Governing body: % social, community and
cultural 131 0.129 0.117 0.000 0.789
Governing body: % public sector 131 0.306 0.178 0.000 0.750
Research & TT 131 0.321 0.469 0.000 1.000
1 2 3 4 C on tr a ct r es ea rc h C on su lta nc y F a ci lit ie s a nd e q ui pm en t-re la te d se rv ic es C P D s C on tr a ct r es ea rc h C on su lta nc y F a ci lit ie s a nd e q ui pm en t-re la te d se rv ic es C P D s C on tr a ct r es ea rc h C on su lta nc y F a ci lit ie s a nd e q ui pm en t-re la te d se rv ic es C P D s C on tr a ct r es ea rc h C on su lta nc y F a ci lit ie s a nd e q ui pm en t-re la te d se rv ic es C P D s
Research and TT General Education Local
[image:16.595.64.516.594.793.2]Education 131 0.206 0.406 0.000 1.000
Local 131 0.191 0.394 0.000 1.000
Agriculture and mining 131 0.504 0.502 0.000 1.000
Manufacturing 131 0.740 0.440 0.000 1.000
Utilities 131 0.634 0.484 0.000 1.000
KIBS 131 0.878 0.329 0.000 1.000
Other services 131 0.870 0.337 0.000 1.000
Public sector 131 1.000 0.000 1.000 1.000
% income from collaborative research and
regeneration programmes 131 0.275 0.214 0.000 1.000
% income from contract research, consultancies and facilities & equipment
services 131 0.398 0.241 0.000 0.970
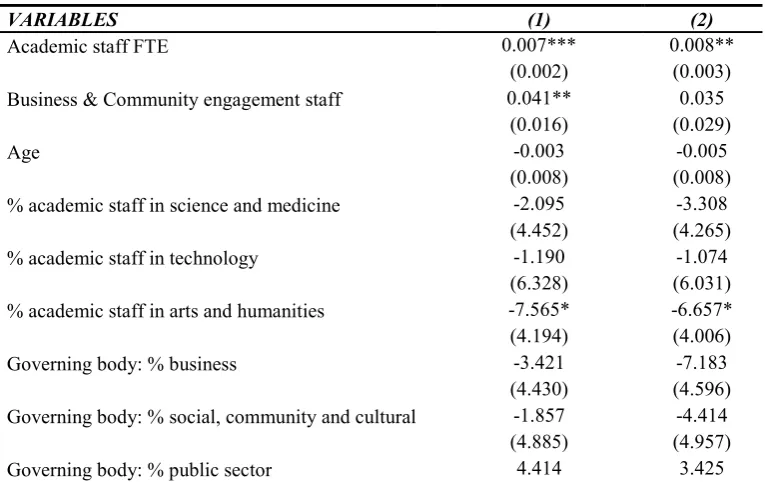
The next table presents the regression results. Due to the nature of the dependent variable we
estimate a tobit model with right censoring11. Model 1 reports the results of the tobit regression
[image:17.595.65.448.492.733.2]while Model 2 reports the results of a tobit instrumental variable (ivtobit) regression in which all the independent and control variables are the same, but the number of Business and Community engagement staff has been instrumented by the number of Business and Community engagement staff in 2005/06, to take care of possible endogeneity (if the higher income from KT allows universities to employ a higher number of Business and Community engagement staff). The number of observations in the regression is 129 because two English universities are not included in the 2013 HEIF funding allocation list (the Universtiy of Buckingham and the School of Pharmacy). The instrumental variable regression has only 122 observations due to missing values in the instrument.
Table 6. Regression results
VARIABLES (1) (2)
Academic staff FTE 0.007*** 0.008**
(0.002) (0.003) Business & Community engagement staff 0.041** 0.035
(0.016) (0.029)
Age -0.003 -0.005
(0.008) (0.008) % academic staff in science and medicine -2.095 -3.308
(4.452) (4.265)
% academic staff in technology -1.190 -1.074
(6.328) (6.031) % academic staff in arts and humanities -7.565* -6.657* (4.194) (4.006)
Governing body: % business -3.421 -7.183
(4.430) (4.596) Governing body: % social, community and cultural -1.857 -4.414
(4.885) (4.957)
Governing body: % public sector 4.414 3.425
11 We obtain similar results if we use as a dependent variable either (i) a variable with six categories representing
(3.193) (3.179)
Research & TT 0.731 1.019
(1.513) (1.633)
Education -3.303** -2.573
(1.613) (1.599)
Local -0.596 -0.686
(1.502) (1.506)
Agriculture and mining -0.051 0.134
(1.270) (1.328)
Manufacturing 5.635*** 4.310**
(1.853) (1.779)
Utilities 3.623** 2.780*
(1.529) (1.476)
KIBS -8.555*** -6.543**
(2.615) (2.568)
Other services 3.246 3.160
(2.133) (2.033) % income from collaborative research and
regeneration programmes 3.101 4.075
(2.971) (3.150) % income from contract research, consultancies and
facilities & equipment services 7.087** 7.109** (2.764) (2.990)
Constant 1.448 3.802
(5.819) (5.624)
Regional variables significant significant
Observations 129 122
LR Chi 2 155.67 135.38
Prob > chi2 0.000 0.000
Wald test of exogeneity: Chi2 0.10
Wald test of exogeneity: Prob>Chi2 0.7573
Standard errors in parentheses *** p<0.01, ** p<0.05, * p<0.1
The results confirm that the amount of HEIF allocation received by an institution, which depends on the income accrued from a range of KT activities, is strongly correlated with the size of the institution, and negatively correlated with the share of academic staff in the arts and humanities. The amount of Business and Community engagement staff becomes insignificant once it is instrumented (however the Wald test cannot reject the null hypothesis of exogeneity, suggesting that the instrumental variable approach is not necessary; while consistent, the ivtobit estimates may have larger standard errors). The KT profile of the university institution also matters, with institutions engaging with the manufacturing sector receiving higher funds. Instead, institutions that engage with knowledge-intensive business services (KIBS) and institutions in the ”Education” cluster receive lower funds. We find that the share of income accruing from activities leading to more appropriable outcomes is strongly linked to HEIF funding. Regional variables are also significant, with location in London and the South East positively related to HEIF funding.
manufacturing sector and that engage in projects with more appropriable outcomes, even though the former may be equally engaged in KT as the latter. Indeed, Hatakenaka (2005) highlighted that the volume of external income received by universities may reflect “the kind of clients the university serves rather than the intensity of demand or the success of the university” (p.15). The results also conform with the study by Teixeira and Koryakina (2013) who show that sector and institutional characteristics are important in generating funding.
4. Conclusion: going beyond current indicators
We have argued that university KT activities can unfold in many ways and can generate a variety of impacts, and that choosing indicators focused on a narrow range of activities and impacts might limit the ability of universities to accurately represent their KT performance,
especially in highly differentiated university systems where universities have different profiles of KT engagement. We have illustrated this with reference to the case of the UK. We have debated that the choice of indicators in the HE-BCI survey, while wider than in other surveys, is still not sufficiently broad in terms of the types of activities and types of impact considered. As a consequence, this raises issues of comparability between institutions, and potentially introduces undesirable behavioural incentives whereby universities may be encouraged to increase their involvement in KT activities where engagement and impact are measured appropriately, to the detriment of other KT activities which are not measured as well but which may be equally important. For example universities may be induced to shift their engagement towards research commercialisation activities, which are measured comprehensively, and away from activities involving student and staff placements in industry, which are not. This may reduce variety and possibly negatively affect the amount and quality of KT taking place.
These problems are reinforced by the adoption of criteria for funding allocation that reward the universities that accrue the highest levels of income. We have shown that English universities’ ability to accrue KT income is strongly influenced by their size, subject mix, KT profile (particularly in terms of the sectors they interact with) and the nature of the knowledge transferred (more or less appropriable). This implies that universities may accrue larger income because they are larger (although not necessarily more effective, if the resources they employ in KT are not more productive than those employed in smaller institutions) and engage in KT activities that are more remunerative (although not necessarily producing greater impacts). It must also be pointed out that when funding is entirely distributed on the basis of a formula, it is paramount that the data used to compute it are highly accurate and reliable. Some doubts have been raised about the HE-BCI data in this respect (Rae et al., 2012).
What are possible avenues for improvement? It would be appropriate to consider more
extent by government agencies to identify initial profiles of universities, and act as an initial step in profiling KT engagement.
Once we move away from indicators based on income only, aggregating indicators in order to obtain aggregate measures of KT performance (for example for the purpose to allocate third stream funding) becomes a complex problem too. It would be unwise to try and derive aggregate measures of performance when the units of measurement are not comparable, or when the measured activities are partly substitute or complementary with one another (Bonaccorsi and Daraio, 2008). Hence, there is a need for more flexibility also in the ways of aggregating performance indicators (Stirling, 2003; Grupp and Schubert., 2010). For example some authors are proposing the use of multidimensional measurements (van Vught and Ziegeleeds, 2012) and positioning indicators (Bonaccorsi and Daraio, 2008). Another way to introduce more flexibility and limit the biases implicit in formula funding could be to introduce, at least to some extent, competitive fund allocation mechanisms based on the relative merits of the various KT activities implemented by universities, measured on the basis of both quantitative and qualitative evidence.
Since the system of KT performance indicators adopted in the UK is one of the most comprehensive, the general problems we have discussed are very likely to affect even more strongly other measurement systems that focus on a narrower range of activities (such as technology commercialization or spinoff activities, in the case of the surveys promoted by AUTM in the US and Canada, and by other associations of KT professionals in Europe and elsewhere). Furthermore, many countries in South Asia and Europe are considering the implementation of data collection exercises similar to the HE-BCI. Due to the increasing relevance of this issue, more theoretical and empirical research is needed into the criteria for the selection of appropriate KT indicators and into the best ways to aggregate them in order to compare the KT performance of different universities.
5. References
Abreu, M., Grinevich, V., Hughes, A., Kitson, M. and Ternouth, P. 2008. Universities, Business
and Knowledge Exchange. Council for Industry and Higher Education and Centre for Business Research, London and Cambridge.
Andersen, B. et al., 2012. Intellectual Property (IP) Governance in ICT Firms: Strategic Value
Seeking through Proprietary and Non-Proprietary IP Transactions. Int. J. Intellectual
Property Management 5, no. 1.
Baghurst, D. and Pollard, T., 2009. A Literature Review on the Efficiency and Effectiveness of University Intellectual Property (IP) Models for the Generation, Identification and
Exploitation of “Soft” (Non-Patent and Non-Trademark) IP. SABIP Report.
Bekkers, R. and Bodas Freitas, I., 2008. Analysing Preferences for Knowledge Transfer Channels between Universities and Industry: To what Degree do Sectors also Matter?
Research Policy 37, no. 10:1837–53.
Boardman, P.G. and Ponomariov, B.L., 2009. University Researchers Working with Private
Companies. Technovation 29, no.2:142–153.
Bonaccorsi, A. and Daraio, C., 2008. The Differentiation of the Strategic Profile of Higher
Education Institutions. New Positioning Indicators Based on Microdata. Scientometrics 74,
Brouwer, E. and Kleinknecht, A., 1999. Innovative Output, and a Firm’s Propensity to Patent.
An Exploration of CIS Micro Data. Research Policy 28, no. 6:615–24.
Chalmers, D. 2008. Teaching and learning quality indicators in Australian universities.
OECD/IMHE Conference: Outcomes of higher education: Quality relevance and impact. 8e10 September 2008, Paris, France.
Cohen, W. M. and Levinthal, D. A. 1990. Absorptive Capacity: A New Perspective on Learning
and Innovation.Administrative Science Quarterly 35, no. 1: 128-152.
Davis, K.E., Kingsbury, B. and Merry, S.E., 2012. Indicators as a Technology of Global
Governance. Law and Society Review 46, no.1:71-104.
Dutrénit, G., De Fuentes, C. and Torres, A., 2010. Channels of Interaction Between Public
Research Organisations and Industry and Their Benefits: Evidence from Mexico. Science
and Public Policy 37, no. 7:513–526.
Etzkowitz, H and Leydesdorff , L., 2000. The dynamics of Innovation: From National Systems
and "Mode 2" to a Triple Helix of University-Industry-Government relations, Research
Policy 29, no.2:1098-123.
Fombrun, J. C 1995. Reputation: Realizing Value from the Corporate Image. Boston: Harvard Business Press Books
Grupp, H. and Schubert., T., 2010. Review and New Evidence on Composite Innovation Indicators for Evaluating National Performance. Research Policy 39, no. 1:67–78.
Harabi, N., 1995. Appropriability of Technical Innovations: An Empirical Analysis. Research
Policy 24, no. 6:981–992.
Hatakenaka, S., 2005. Development of third stream activity: Lessons from international
experience, Higher Education Policy Institute
HEFCE 2012. Strengthening the Contribution of English Higher Education Institutions to the
Innovation System: Knowledge Exchange and HEIF Funding, Available at:
http://www.hefce.ac.uk/media/hefce/content/whatwedo/knowledgeexchangeandskills/heif/ pacec-report.pdf [Access: 8th April 2013]
HEFCE, 2011. Opportunity, choice and excellence in higher education. Bristol.
HESA, 2012. Finance/HE-BCI Seminar, Birmingham, November 2012. Available at:
http://www.hesa.ac.uk/dox/datacoll/Support_Centre/FSR_HEBCI.ppt [Accessed 2nd Dec 2013]
Hughes, T. et al., 2011. Scholarship that matters: academic/practitioner engagement in business
& management. Management Learning 10, no. 1:40–57.
Jensen, P.H., Palangkaraya, A. and Webster, E., 2009. A Guide to Metrics on Knowledge
Transfer from Universities to Businesses and Industry in Australia,
Jensen, R., Thursby, J. and Thursby, M.C., 2010. University-Industry Spillovers, Government
Funding, and Industrial Consulting. NBER Working Papers 15732, Cambridge. MA:
Katz, J.S. 2000. Scale-independent Indicators and Research Evaluation. Science and Public Policy 27, no. 1:23-36.
Kelly, U. 2008. Exploring the Evidence Base: An Overview of the Literature on the Economic
Impact of Knowledge Transfer. Impact of Higher Education Institutions on Regional
Economies Initiative Discussion Paper, Economic and Social Research Council
Kingsley, G., Bozeman, B., and Coker, K 1996. Technology Transfer and Absorption:
an ‘R&D Value-Mapping’ Approach to Evaluation. Research Policy 25, no. 6:967-995.
Kitagawa, F and Lightowler, C. 2012. Knowledge exchange: A comparison of policies,
strategies, and funding incentives in English and Scottish higher education. Research
Evaluation 22, no. 1:1-14.
Lambert, R. 2003. Lambert Review of Business-University Collaboration, HM Treasury.
Langford, C.H., Hall, J., Josty, P., Matos, S., et al. 2006. Indicators and Outcomes of Canadian
University Research: Proxies Becoming Goals? Research Policy 35, no. 10:1586-1598.
Litan, R.., Mitchell, L. and Reedy, E.J., 2008. Commercializing University Inventions:
Alternative Approaches. In A. Jaffe, J. Lerner, & S. Stern, eds. Innovation Policy and the
Economy. pp. 31–57.
McLellan, D. Turok, I. and Botham, R. 2006. Final Report of the HERE Network University-to Industry-to Regional Economy Knowledge Transfer: A Literature Review
Meier, M. 2011. Knowledge Management in Strategic Alliances: A Review of Empirical
Evidence. International Journal of Management Reviews 13, no.1: 1–23.
Merry, S.E., 2011. Measuring the World: Indicators, Human Rights, and Global Governance:
With CA Comment by John M. Conley. Current Anthropology 52, no.3:83–95.
Molas-Gallart, J and Castro-Martinez, E. 2007. Ambiguity and Conflict in the development of
'Third Mission indicators, Research Evaluation 16, no.4:321-330.
Molas-Gallart, J., Salter,A., Patel, P., Scott, A., Duran, X., 2002. Measuring Third Stream
Activities, Final Report to the Russell Group of Universities, SPRU, April 2002
Mowery, D.C. 1983. Economic Theory and Government Technology Policy, Policy Science 16:
27–43.
PACEC, 2010. Synergies and Trade-offs between Research, Teaching and Knowledge
Exchange, A Report to HEFCE by PACEC and the Centre for Business Research,
University of Cambridge
Rae, D., Martin, L., Antcliff, V., and Hannon, P. 2012. Enterprise and Entrepreneurship in
English Higher Education: 2010 and Beyond, Journal of Small Business and Enterprise
Development 19, no. 3: 380-401.
Rafols, I. et al., 2012. Towards Indicators for “Opening up” Science and Technology Policy,
Available at
RCUK, 2007. Knowledge Transfer Categorisation and Harmonisation Project. Research Councils UK Final Report
Roberts, P and Dowling, G. 2002. Corporate Reputation and Sustained Superior Financial
Performance, Strategic Mangement Journal 23, no.12:1077–1093.
Romer, P., 1990. Human Capital and Growth: Theory and Evidence, Carnegie-Rochester
Conference Series on Public Policy 32, no. 1:251-286.
Rosli, A., Rossi, F., 2014. What Indicators to Assess Universities’ Knowledge Transfer Performance? Problems in the Transition from Theory to Practice, In Hilpert, U. (ed.) ‘Handbook on Politics and Technology’, Routledge, forthcoming
Sainsbury, 2007. The Race to the Top: A Review of Government's Science and Innovation
Policies, London, UK: HM Treasury. Available at:
http://www.hm-treasury.gov.uk/media/5/E/sainsbury_review051007.pdf [Accessed 2nd Dec 2013]
Sellenthin, M.O. 2006. Beyond the Ivory Tower: Do Patent Rights Regimes Impact on Patenting
Behaviour in Sweden and Germany, VEST Journal of Science and Technology Studies 19,
no.3-4:27 – 58.
Schmitz, C.C., 1993. Assessing the Validity of Higher Education Indicators, Journal of Higher
Education 64, no. 5:503-521.
Sharifi, H., Liu, W. and S. Ismail, H., 2013. Higher Education System and the “Open”
Knowledge Transfer: a View from Perception of Senior Managers at University Knowledge
Transfer Offices. Studies in Higher Education,1–25.
Sorensen, J, and Chambers, D. 2008. Evaluating Academic Technology Transfer Performance by
how Well Access to Knowledge is Facilitated - Defining an Access Metric”, Journal of
Technology Transfer, 33: 534-547.
Stirling, A., 2003. Risk, Uncertainty and Precaution: Some Instrumental Implications from the
Social Sciences. In I. Scoones, M. Leach, & F. Berkhout, eds. Negotiating Change:
perspectives in environmental social science. London: Edward Elgar, pp. 33–76.
Teixeira, P., and Koryakina, T. 2013. Funding Reforms and Revenue Diversification – Patterns,
Challenges and Rhetoric, Studies in Higher Education 38, no. 2: 174–191.
Ternouth, P. Garner, C., Wood, L. and P. Forbes, 2012. Key Attributes for Successful
Knowledge Transfer Partnerships, CIHE report.
University Alliance, 2011. University Alliance Response to HEFCE consultation – Higher
Education Innovation Funding 2011 – 15. Available from http://www.unialliance.ac.uk/wp-content/uploads/2011/05/Alliance-response-to-HEFCE-HEIF-consultation.pdf [Accessed Dec 2013]
Van Vught, F.A. and Ziegele, F. eds., 2012. Multidimensional Ranking. The Design and
Development of U-Multirank Higher Edu., Berlin: Springer.
Von Hippel, E. 1988. The Sources of Innovation. Oxford University Press.
Watermeyer, R. 2012. Issues in the Articulation of “Impact”: the Responses of UK Academics to
Witty report, 2013. Encouraging a Business invention revolution: Sir Andrew Witty’s Review of
Universities and Growth, Available at:
https://www.gov.uk/government/uploads/system/uploads/attachment_data/file/249720/bis-13-1241-encouraging-a-british-invention-revolution-andrew-witty-review-R1.pdf
[Accessed: 2nd Dec 2013]
Wright, M., Clarysse, B., Lockett, A. and Knockaert, M. 2008. Mid-range Universities’ Linkages
with Industry: Knowledge Types and the Role of Intermediaries. Research Policy 37,