R E S E A R C H A R T I C L E
Open Access
Defective response of CD4
+
T cells to retinoic
acid and TGF
b
in systemic lupus erythematosus
Eric S Sobel
1, Todd M Brusko
2, Ed J Butfiloski
1, Wei Hou
3, Shiwu Li
2, Carla M Cuda
1,4, Ariana N Abid
1,5,
Westley H Reeves
1and Laurence Morel
2*Abstract
Introduction:CD25+FOXP3+CD4+regulatory T cells (Tregs) are induced by transforming growth factor b(TGFb) and further expanded by retinoic acid (RA). We have previously shown that this process was defective in T cells from lupus-prone mice expressing the novel isoform of thePbx1 gene,Pbx1-d. This study tested the hypothesis that CD4+T cells from systemic lupus erythematosus (SLE) patients exhibited similar defects in Treg induction in response to TGFband RA, and that PBX1-d expression is associated with this defect.
Methods:Peripheral blood mononuclear cells (PBMCs) were collected from 142 SLE patients and 83 healthy controls (HCs). The frequency of total, memory and naïve CD4+T cells was measured by flow cytometry on fresh cells. PBX1 isoform expression in purified CD4+T cells was determined by reverse transcription polymerase chain reaction (RT-PCR). PBMCs were stimulated for three days with anti-CD3 and anti-CD28 in the presence or absence of TGFband RA. The expression of CD25 and FOXP3 on CD4+T cells was then determined by flow cytometry.In vitrosuppression assays were performed with sorted CD25+and CD25-FOXP3+T cells. CD4+T cell subsets or their expansion were compared between patients and HCs with two-tailed Mann-Whitney tests and correlations between the frequencies of two subsets were tested with Spearman tests.
Results:The percentage of CD25-FOXP3+CD4+(CD25-Tregs) T cells was greater in SLE patients than in HCs, but these cells, contrary to their matched CD25+counterparts, did not show a suppressive activity. RA-expansion of TGFb-induced CD25+Tregs was significantly lower in SLE patients than in HCs, although SLE Tregs expanded significantly more than HCs in response to either RA or TGFbalone. Defective responses were also observed for the SLE CD25-Tregs and CD25+FOXP3-activated CD4+T cells as compared to controls. PBX1-d expression did not affect Treg induction, but it significantly reduced the expansion of CD25- Tregs and prevented the reduction of the activated CD25+FOXP3-CD4+T cell subset by the combination of TGFband RA.
Conclusions:We demonstrated that the induction of Tregs by TGFband RA was defective in SLE patients and that PBX1-d expression in CD4+T cells is associated with an impaired regulation of FOXP3 and CD25 by TGFband RA on these cells. These results suggest an impaired integration of the TGFband RA signals in SLE T cells and implicate the PBX1 gene in this process.
Introduction
Systemic lupus erythematosus (SLE) is an autoimmune disease characterized by the production of pathogenic autoantibodies. Multiple studies have shown that these autoantibodies are T cell-dependent with autoreactive CD4+ T cells providing co-stimulatory signals and cyto-kines such as IL-4 and IL-21 to the autoreactive B cells
[1,2]. The CD4+ T cells of SLE patients present many functional defects, which include a reduced number of circulating cells that is associated with disease activity [3-5], impaired signaling [6] and increased spontaneous activation coupled with a hypo-responsiveness upon reactivation [7,8].
The status of CD4+ CD25+ FOXP3+regulatory T cells (Tregs) in lupus has been examined by numerous stu-dies. In the (NZB × NZW)F1 mouse model, Treg adop-tive transfers delay and attenuate the course of disease [9]. In SLE patients, findings have been mixed [10-12].
* Correspondence: morel@ufl.edu
2
Department of Pathology, Immunology, and Laboratory Medicine, University of Florida, 1600 Archer Road, Gainesville, FL 32610-0275, USA
Full list of author information is available at the end of the article
Most studies have reported either decreased numbers of circulating Tregs that were inversely correlated with dis-ease activity, or an abnormal suppressive activity. Other studies have, however, reported similar numbers or function of Tregs in SLE patients and healthy controls (HCs). A consensus has arisen that these discrepancies are most likely due to the lack of a rigorous definition of the markers used for Treg identification as well as to technical differences in Treg isolation. The CD4+CD25 -FOXP3+ cell population (CD25- Tregs) has been recently found to be expanded in SLE patients [13,14], but its origin and function are unclear [15]. One group working with newly diagnosed patients has suggested that CD25-Tregs correspond to activated T cells with-out suppressive activity [13]. The other group working with treated patients has shown that the CD25- Tregs retain a suppressive function, albeit incomplete, and have concluded that these cells represent an attempt to control active autoimmune activation [14].
The size of the Treg compartment results from the combined contribution of thymic-derived natural Tregs (nTregs) and peripherally induced Tregs (iTregs). Most of the studies in SLE patients have focused on circulat-ing Tregs in which the relative contribution of nTregs and iTregs is unknown. Murine studies have shown that the TGFb-dependent induction of iTregs is expanded by all-trans retinoic acid (RA) [16,17]. RA also expands the number of de novo TGFb-induced human iTregs and enhances their suppressive activity [18]. Recent studies have now reported that RA also expands the number and enhances the function of murine [19] and human [20] nTregs. Therefore, RA stands out as a major regu-lator of the size and function of the Treg compartment.
We have reported that the murine Sle1a.1lupus sus-ceptibility locus results in the production of activated and autoreactive CD4+ T cells, and in a reduction of the Treg pool [21,22]. In addition,Sle1a.1CD4+ T cells pre-sent a defective expansion of TGFb-induced iTregs in response to RA (Cudaet al., in revision). At the molecu-lar level,Sle1a.1 corresponds to an increased expression of a novel splice isoform of the pre-B cell leukemia homeobox 1 Pbx1 gene, Pbx1-d. PBX1 amino acid sequence and exon structure are entirely conserved between mouse and humans. We found that PBX1-d was expressed more frequently in the CD4+T cells from lupus patients than from HCs, and its presence in CD4+ T cells correlated with an increased central memory population. The current study was designed to investi-gate whetherin vitro induction of iTreg by TGFb and RA was impaired in SLE patients as compared to HCs, and to determine whether PBX1-d expression played a role in the size of the Treg pool relative to TGFb and RA exposure. We found that SLE patients with active renal disease have less Tregs than patients with inactive
disease or HCs. We also confirmed that SLE patients carry more CD25-FOXP3+ CD4+ (CD25-Tregs) than HCs, and found that while the CD25+ conventional Tregs showed variable levels of suppression, the CD25 -Tregs were uniformly non-suppressive (and, therefore, are not functionally speaking“Treg”). We found a defec-tive regulation of CD25 and FOXP3 expression in response to TGFb and RA in the CD4+ T cells from SLE patients as compared to HCs, with SLE CD25+ Tregs being more expanded by TGFb and less by RA than HC CD25+Tregs. Interestingly, the combination of TGFband RA greatly expanded SLE activated CD25+ FOXP3-T cells as compared to HCs. PBX1-d expression was associated with greater numbers of CD25- Tregs, but it significantly reduced their expansion by the com-bination of TGFb and RA. Moreover, PBX1-d expres-sion was associated with an impaired ability of TGFb and RA to reduce the activated CD25+FOXP3-CD4+T cell subset. Overall, we have demonstrated that the induction of Tregs by TGFb and RA was defective in SLE patients and that PBX1-d expression in CD4+ T cells impaired the regulation of FOXP3 and CD25 by TGFb and RA on these cells. These results suggest an impaired integration of the TGFband RA signals in SLE T cells and implicate the PBX1 gene in this process.
Materials and methods Study participants
T cell culture and flow cytometry
CD4+T cell subsets were analyzed by flow cytometry by staining with antibodies to CD3-PerCP (SP34-2; BD Biosciences, San Jose, CA, USA ), CD4-PC7 (SFCI12T4D11; Beckman Coulter, Brea, CA, USA), CD45RA-Pacific Blue (HI100; eBioscience, San Diego, CA, USA), CD45RO-F (UCHL1; BD Biosciences), CD62L-APC-AF70 (DREG56; eBioscience), FOXP3-APC (PCH101; eBioscience), or isotype controls. Anti-coagu-lated whole blood was incubated with the combination of antibodies at concentrations recommended by the manufacturer, subsequently lysed (BD FACS™; BD Bios-ciences) and fixed in 0.5% paraformaldehyde in PBS. In addition, gradient-purified (Ficoll; Sigma-Aldrich, St-Louis, MO, USA) PBMCs (5 × 10⁵ cells/ml) were cul-tured for three days on plates coated with a combina-tion of anti-CD3 (1 ug/ml), anti-CD28 (10 ug/ml) antibodies (BD Biosciences), and IL-2 (20μg/m) in the presence or absence of 5 nM RA (Sigma-Aldrich) and TGFb1 (Peprotech, Rocky Hill, NJ, USA). Cells were then stained with antibodies to CD3e (UCHT1; eBioscience), CD4-PC7 and CD25-PE (M-A251, BD Biosciences), followed by permeabilization (FOXP3
Fixation/Permeabilization Concentrate and Diluent; eBioscience) and staining for FOXP3-APC. Before using whole blood, the protocol was validated against isolated CD4+T cells, purified with RosetteSep (Stem Cell Tech-nologies, Vancouver, BC, Canada) by negative selection, as previously described (Cuda et al. in revision). In a subset of samples, freshly harvested cells were also stained for CD3, CD4, CD127-PE (eBioscience) and CD25. The red blood cells (RBCs) were then lysed, the cells permeabilized and stained for FOXP3.
T cell suppression assays
[image:3.595.56.290.111.438.2]CD4+ CD127-T cells were enriched by negative selec-tion from 6 ml of blood freshly collected in heparinized tubes following the manufacturer’s instructions (Rosette-Sep Human CD4+CD127low Regulatory T Cell Pre-Enrichment Cocktail; StemCell Technologies). A small aliquot was retained to verify purity (typically 70 to 80%), and the remaining cells were cultured for three days as described above for expansion of Tregs, using 20 ug TGFb. After culture, the cells were harvested and stained under sterile conditions with a cocktail of anti-CD4-PE-Cy7, anti-CD25-Pacific Blue, and anti-CD127-PE. The cells were then suspended in PBS supplemented with 2% FBS and sorted with a FACSAria (BD Bios-ciences) into two populations (CD4+ CD127-CD25+and CD4+CD127-CD25-). An aliquot was retained for intra-cellular staining for FOXP3, as described above. The remaining purified CD25+ and CD25- Tregs were each resuspended in 500 ul of PBS, as were an aliquot of fro-zen PBMCs used as standardized responder cells, and an aliquot of standardized umbilical cord-derived Tregs, both prepared as previously described [25]. The respon-der cells were incubated with carboxyfluorescein succi-nimidyl ester (CFSE), while the Treg preparations were incubated with CellTrace Violet, both following the manufacturer’s instructions (Invitrogen, Carlsbad, CA, USA). After quenching with FBS, 50,000 responder cells were added per well to a 96-well round-bottomed tissue culture plate pre-coated with anti-CD3 (2 μg/ml) and anti-CD28 (1μg/ml) as previously described [25]. Tregs were added in triplicate at serial dilutions of 1:4 to 1:64. Additional controls included wells without Tregs (posi-tive control) and wells without anti-CD3 and -CD28 sti-mulation (negative controls). Additional wells were prepared to which only Tregs were added. The cells were cultured for six days at 37°C, harvested, and stained with a combination of anti-CD3-PerCP, -CD4-PE-Cy7, and -CD8-APC. Cells were analyzed on a CyAn 9-color flow cytometer (Beckman Coulter). At least 2,500 events were collected in the lymphocyte gate and analyzed for CD8+T cell proliferation by FCS Express 4 RUO (DeNovo Software, Los Angeles, CA, USA). For evaluation of proliferation of Tregs, cells were gated for
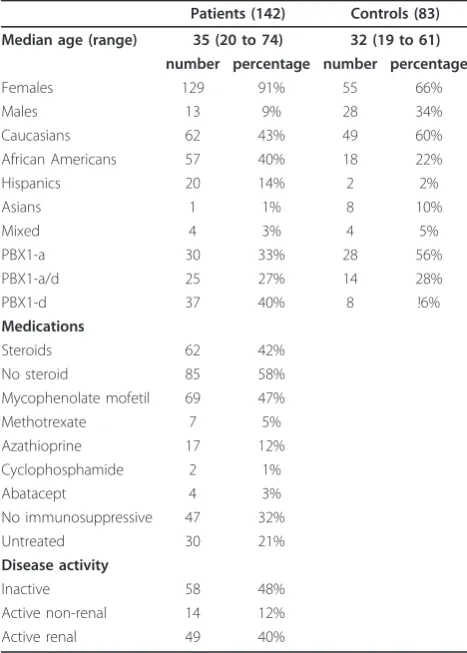
Table 1 Characteristics of human subjects used in this study
Patients (142) Controls (83)
Median age (range) 35 (20 to 74) 32 (19 to 61)
number percentage number percentage
Females 129 91% 55 66% Males 13 9% 28 34% Caucasians 62 43% 49 60% African Americans 57 40% 18 22% Hispanics 20 14% 2 2% Asians 1 1% 8 10% Mixed 4 3% 4 5% PBX1-a 30 33% 28 56% PBX1-a/d 25 27% 14 28% PBX1-d 37 40% 8 !6%
Medications
Steroids 62 42% No steroid 85 58% Mycophenolate mofetil 69 47% Methotrexate 7 5% Azathioprine 17 12% Cyclophosphamide 2 1% Abatacept 4 3% No immunosuppressive 47 32% Untreated 30 21%
Disease activity
CD4 and excluded all CFSE+events. Control responder cells without Tregs showed that the CFSE- and Cell Trace Violet populations did not merge. Proliferation indices, calculated as the ratios of the total gated cells at the end of culture over their initial number, and division indices, corresponding to CFSE dilution, were derived from the curve fitting data [26] and gave comparable results.
PBX1 isoform analysis
Peripheral blood CD4+T cells were isolated from whole blood, as described above. The quality of isolation was verified by flow cytometry and was typically 80 to 90%. cDNA was synthesized from the purified CD4+ T cells, andPbx1isoforms were detected with the following: 5’ -GAA GTG CGG CAT CAC AGT CTC- 3’ in exon 5, and 5’ - ACT GTA CAT CTG ACT GGC TGC - 3’ in exon 8.
Statistical analysis
Statistical analyses were performed using GraphPad Prism 4. Data were presented as means ± SEM or scat-ter plots. Comparisons between two cohorts were per-formed with two-tailed Mann-Whitney tests and Dunns’ multiple comparison tests when more than two groups were involved. Correlations were established using Spearman tests. Statistical significance obtained when P ≤0.05 is indicated in the figures.
Results
Differential distribution of the memory and naïve CD4+T
cell subsets between SLE patients and HCs
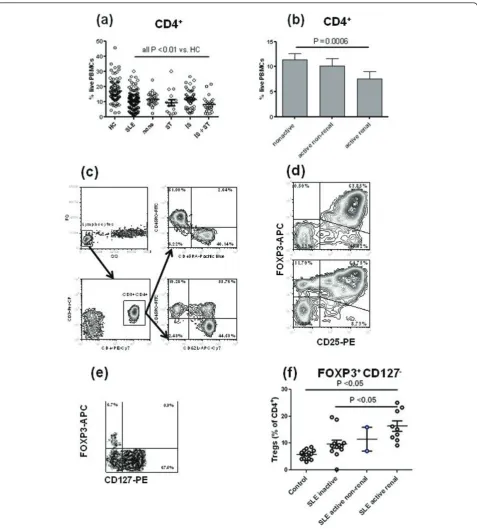
The percentage of CD4+T cells was significantly lower in the PBMCs of SLE patients than in HCs (Figure 1a). All patients, either untreated or treated with steroids, or immunosuppressive drugs or both, presented a signifi-cantly lower percentage of CD4+T cells than HCs, indi-cating that treatment was not the main cause for low CD4+ T cell counts. However, treatment was associated with a further decrease in the percentage of CD4+ T cells (untreated patients: 11.51 ± 0.80%, patients treated with both steroids and immunosuppressive drugs: 8.06 ± 1.00%,P < 0.009). We also observed a significantly lower percentage of CD4+T cells in patients with active renal disease as compared to patients with inactive disease (Figure 1b). This difference associated with disease severity was not due to treatment as there was no differ-ence between patients with inactive disease that were untreated or treated with either steroids or immunosup-pressive drugs (12.44 ± 1.12%, N = 16 vs. 10.81 ± 0.88%, N = 50, respectively, P = 0.21). Finally, patients with inactive disease had a significantly lower percentage of CD4+ T cells than in HCs (11.79 ± 0.80%, N = 52 vs. 17.12 ± 0.71%, N = 83, respectively, P< 0.0001). These
results confirm earlier reports [3-5] that SLE patients present with CD4+ T cell leucopenia correlated with dis-ease activity and showed that it is accentuated by steroid and immunosuppressive treatment, which is by itself associated with disease activity.
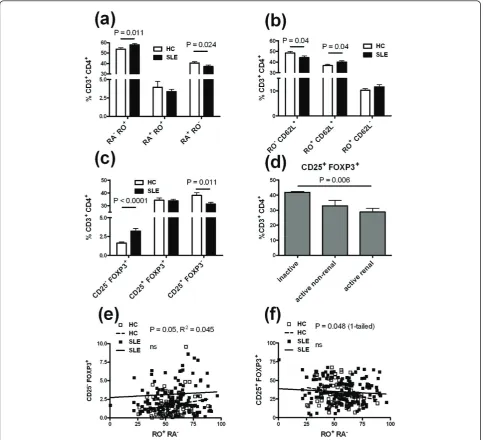
We compared the percentage of circulating CD45RA+ CD45RO-naïve and CD45RA-CD45RO+ memory CD4+ T cells, and among the latter, the percentage of CD62L+ CD45RO+ central and CD62L-CD45RO+ effector mem-ory T cells in the PBMCs of patients and HCs (Figure 1c). Patients presented significantly more memory T cells and less naïve CD4+ T cells (identified as either CD45RA+ CD45RO- or CD62L+ CD45RO-) than HCs (Figure 2a, b). Among memory T cells, it was the central but not the effector memory subset that was responsible for this difference (Figure 2b). Immunosuppressive treat-ment lowered the patients’memory/naïve CD4+ T cell (P = 0.03) and the central memory/naïve T cell (P = 0.06) ratios. However, there was no difference between patients with active and inactive disease, or between patients that were treated or non-treated with steroids (data not shown).
Differential distribution of expanded CD4+T cell subsets expressing CD25 and FOXP3 in SLE patients and HCs
FOXP3 and CD25 expression was quantified on CD4+T cells after three days of stimulation with anti-CD3 and anti-CD28 (Figure 1d). CD25+ FOXP3+ CD4+ Tregs were present at similar levels in patients and HCs (Fig-ure 2c). However, we found a significantly lower percen-tage of Tregs in patients with active renal disease than in patients with inactive disease, and patients with active non-renal disease presented an intermediate level (Fig-ure 2d). As for the numbers of total CD4+ T cells, we believe that these results represent an association between decreased Treg levels and disease severity, rather than a tissue-specific association. Patients with active renal disease presented also significantly less Tregs than HCs (30.15 ± 1.75%, N = 58 vs. 35.46 ± 1.93% N = 78, respectively, P = 0.026). This indicated that the similar level of Tregs between SLE patients and HCs seen in Figure 2c was largely due to patients with inactive disease.
Figure 1CD3+CD4+T cell leucopenia in systemic lupus erythematosus (SLE) patients. (a) Percentage of CD4+T cells in the peripheral blood mononuclear cells (PBMCs) of patients and healthy controls (HCs). CD4+T cell percentages was also compared between untreated
patients (none, N = 28) and patients treated with either steroids alone (ST, N = 15) or immunosuppressive drugs alone (IS, N = 53) or both (IS + ST, N = 32). Each patient group was compared to HCs using Dunns’multiple comparison tests. (b) Percentage of CD4+T cells in the PBMCs of
SLE patients according to their disease activity (non-active, active non-renal and active renal). (c) Representative PBMC fluorescence activated cell sorter (FACS) plots showing the CD45RO - CD45RA and CD45RO - CD62L stainings gated on CD3+CD4+lymphocytes. (d) Representative FACS
plots showing FOXP3 and CD25 staining gated on CD4+lymphocytes of two PBMC samples three days after stimulation with CD3 and
anti-CD28. (e) Freshly obtained blood was stained with a combination of antibodies to CD3, CD4, CD25, and CD127. Following red blood cell lysis, the cells were permeabilized and stained for FOXP3 expression. The FACS plot shows a representative profile gated on CD3+CD4+lymphocytes,
with the regulatory T cells (Tregs) being identified as FOXP3+CD127-. (f) Percentage of circulating Tregs identified as shown in (e) in HCs and
we saw very few CD25+ CD4+ cells in freshly stained blood, indicating that selection for CD25-T cells would have had little effect on our studies. More importantly, we also studied a subset of our freshly obtained samples for FOXP3 and CD4 co-expression. Because absence of CD127 has also been used as a marker of Tregs [27],
[image:6.595.57.541.89.529.2]this was also added to the staining strategy. As seen in Figure 1e, after gating on CD3+ CD4+ cells, the combi-nation of FOXP3 and CD127 showed good separation of phenotypes, with the Tregs being identified as FOXP3+ CD127-. A compilation of results showed that the start-ing population of Tregs was not decreased in our
Figure 2Differential CD3+CD4+T cell subset distribution between healthy controls and systemic lupus erythematosus patients
Distribution of CD45RA-CD45RO+(RA-RO+) memory T cells and CD45RA+CD45RO-(RA+RO-) naïve T cells (a), or CD45RO-(RO-) CD62L+naïve T
cells, CD45RO+(RO+) CD62L+central memory T cells and CD45RO+(RO+) CD62L-effector memory T cells in the peripheral blood mononuclear
cells (PBMCs) of SLE patients and HCs (b). (c) CD4+T cells activated for three days with anti-CD3 and anti-CD28 were compared between
patients and HCs according to their CD25 and FOXP3 expression. (d) Percentage of expanded CD25+regulatory T cells (Tregs) in SLE patients
according to their disease activity. (e) The percentage of CD25-Tregs was positively correlated with the percentage of memory CD45RO+
patient population compared to controls (Figure 1f). In fact, the active patients showed the highest starting levels, making it unlikely that our results with expanded T cells are due to a lower percentage of circulating Tregs.
We investigated whether there was a correlation between the level of CD45RA-CD45RO+ memory CD4+ T cells and the size of the Treg subsets. The percentage of CD25-Tregs was positively correlated with the per-centage of memory T cells in HCs but not in patients (Figure 2e). There was a trend negatively correlating the percentage of CD25+ Tregs cells with the percentage of memory T cells in HCs but not in patients (Figure 2f). Overall, these results show in HCs the expected positive correlation between CD25-Tregs and memory T cells and negative correlation between CD25+ Tregs and memory T cells. The fact that these correlations were not observed for FOXP3+ T cells in SLE patients sug-gests a defective homeostatic regulation of FOXP3 expression in SLE patients.
SLE CD25-Tregs do not suppress T cell proliferation
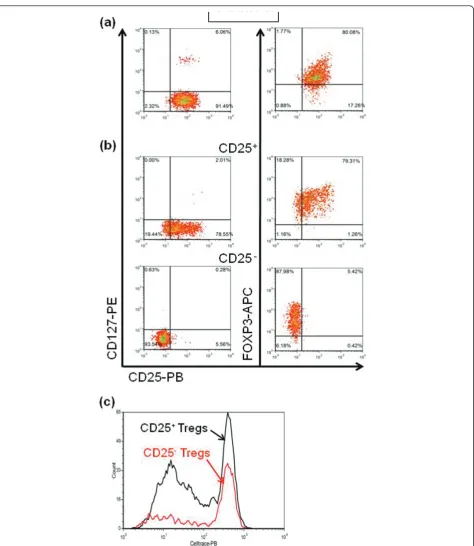
The function of the CD25-FOXP3+CD4+T cells that is expanded in SLE patients is controversial [13,14]. We, therefore, assessed the suppressive capacity of these cells comparatively to their CD25+ FOXP3+ CD4+ counter-parts in our SLE cohort. As a positive control, we used standardized Treg isolated from cord blood, which were, as expected, largely CD127-FOXP3+ CD25+cells (Fig-ure 3a). CD4+ CD127- cells isolated from patients’ PBMCs were expanded by stimulation with anti-CD3 and CD28, TGFband RA, then sorted into CD25+ and CD25-populations. As shown in Figure 3b, this protocol led to a good separation of CD127-FOXP3+CD25+and CD127-FOXP3+ CD25-populations. These cells were then used in standard T cell suppression assays. As expected, the cord blood standardized Tregs showed a robust suppression (Figure 4a). CD25+Tregs from lupus patients also showed strong suppression (Figure 4b, c, e), although to a lesser extent in some patients (data not shown), which is consistent with reports of altered Treg function in some SLE patients [28]. To the contrary, none of the CD25- Tregs isolated from six different patients showed any suppressive activity (Figure 4d, f). In one patient, the CD25-Tregs actually stimulated the CD8+ allogeneic T cells (Figure 4f). Furthermore, con-trary to the CD25+ Tregs, the CD25-Tregs proliferated poorly in the stimulated co-cultures with PBMCs (Fig-ure 3c). While the data depicted reflect proliferation of the CD8+PBMCs, comparable results were obtained for CD4+ PBMCs, although proliferation was less robust (data not shown). These results show that the CD25
-Tregs isolated from our cohort of SLE patients have lost their suppressive function.
Differential response of CD4+T cells to TGFb and retinoic acid in SLE patients and HCs
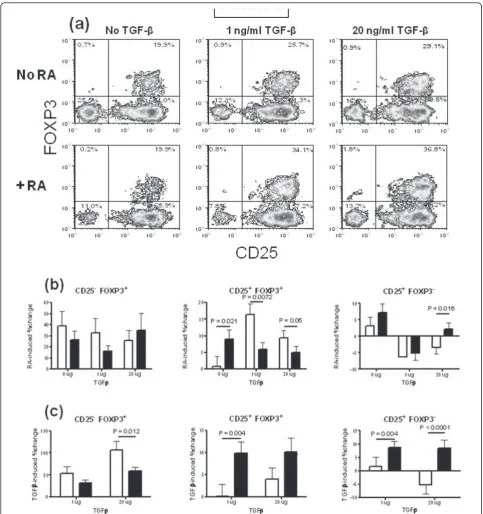
We systematically compared the effect of TGFband RA on CD25 and FOXP3 expression by CD4+ T cells from SLE patients and HCs stimulated with anti-CD3 and anti-CD28 (Figure 5a). As shown in Figure 5b, RA expanded CD25- Tregs to a similar level between HCs and patients. The effect of RA on CD25+ Treg expan-sion depended on the presence of TGFb: In the absence of TGFb, CD25+ Tregs were expanded by RA signifi-cantly more in patients than in HCs. In the presence of either 1 or 20 ug/ml of TGFb, the opposite result was observed, that is, RA expanded Tregs less in patients than in HCs. CD25+ FOXP3- CD4+ T cells were expanded by RA alone to a similar level in HCs and patients. In the presence of 1 ug/ml of TGFb, the per-centage of CD25+ FOXP3-CD4+ T cells was decreased by RA to a similar extent between HCs and patients. When the concentration of TGFbreached 20 ug/ml, RA still decreased the percentage of CD25+ FOXP3- CD4+ T cells in HCs but increased it in SLE patients, leading to a significant difference between the two cohorts.
In the absence of RA, TGFbalone expanded the CD4+ T cell subsets differently between HCs and SLE patients (Figure 5c). CD25- Tregs were expanded significantly less in SLE patients than in HCs by 20 ug/ml TGFb. To the contrary, TGFb expanded CD25+ Tregs more in patients than in HCs, and the difference was highly sig-nificant with 1 ug/ml TGFb (P < 0.01). TGFb also expanded CD25+ FOXP3- CD4+ T cells significantly more in patients than in HCs at both concentrations. Interestingly, 20 ug/ml of TGFb expanded CD25+ FOXP3- CD4+ T cells in patients while it shrunk this subset in HCs, as previously noted for RA in the pre-sence of the same amount of TGFb(Figure 5b). Overall, these results revealed a differential response of the CD4
+
T cell subsets to TGFband RA between SLE patients and HCs.
Memory CD4+T cells are associated with a lower Treg induction in SLE patients
Figure 3Representative fluorescence activated cell sorter (FACS) plots showing the regulatory T cell (Treg) populations used in the suppression assays(a) Standardized cord blood Treg used as positive controls, the great majority of which being CD127-CD25+FOXP3+. (b) Treg isolated from a systemic lupus erythematosus(SLE) patient as CD4+ CD127-, then sorted as CD25+or CD25-after stimulation and expansion with transforming growth factor beta (TGFb) and retinoic acid (RA). The CD25+-sorted population was approximately 80% FoxP3+
CD25+, while the CD25--sorted population was more than 80% FoxP3+CD25-. (c) Proliferation of CD25+and CD25-Treg isolated from a same
Figure 4CD25+but not CD25-regulatory T cells (Tregs) expanded from systemic lupus erythematosus (SLE) patients suppressed T cell proliferation. Standardized aliquots of peripheral blood mononuclear cells (PBMCs) were cultured for six days in the presence of
standardized Tregs (a), CD25+(c,e) or CD25-(d,f) Tregs expandedin vitrofrom the PBMCs of SLE patients in the presence of transforming growth factor beta (TGFb) and retinoic acid (RA). (c-d) and (e-f) CD25+and CD25-Tregs were obtained from a same patient. Representative
profiles of the CD8+PBMC proliferation in the presence of CD25+Tregs at the indicated dilutions are depicted (b). A varying amount of
suppression was mediated by the CD25+ population, while the CD25-population showed either no effect (top) or appeared to promote
Figure 5Differential induction of CD25 and FOXP3 expression by retinoic acid (RA) and (transforming growth factor beta (TGFb) in healthy controls (HCs) and systemic lupus erythematosus (SLE) patients. (a) Representative fluorescence activated cell sorter (FACS) plots showing FOXP3 and CD25 staining in CD4+gated peripheral blood mononuclear cells (PBMCs) after three days stimulation with anti-CD3 and anti-CD28 with or without RA and in the presence of 0, 1, or 20 ug/ml of TGFb. In the (b-d) panels, CD25-regulatory T cells (Tregs) are shown
on the left, Tregs in the middle, and CD25+FOXP3-CD4+T cells on the right. (b) RA-induced expansion in the presence of 0, 1, or 20 ug/ml of
CD45RO+ CD62L+ central memory or CD45RO+ CD62L-effector memory T cells. Similar results were obtained for total memory (Figure 6) and central mem-ory CD4+T cells (data not shown), but the significance was always higher for the total memory CD4+ T cells. We also investigated these correlations in the six combi-nations of RA and TGFbused in this study (Figure 5a), and we show only the most representative combinations that showed significant results.
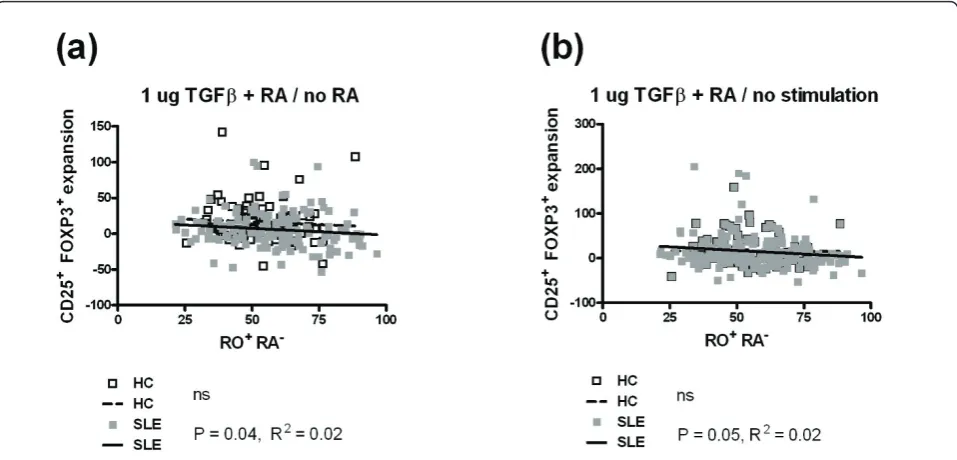
The expansion of Tregs by RA in the presence of 1 ug/ml of TGFb(Figure 6a) or by the combination of RA and 1 ug/ml of TGFb(Figure 6b) was negatively corre-lated with the percentage of memory CD4+ T cells in the PBMCs of SLE patients. There was a trend in the same direction for HCs, and the negative correlations were highly significant for the combined cohorts (data not shown). No correlation was observed between the expansion of CD25- Tregs by the combination of RA and 20 ug/ml of TGFb and the percentage of memory CD4+ T cells in the PBMCs of either SLE patients or HCs (data not shown).. Finally, the expansion of CD25+ FOXP3- CD4+ T cells by any combination of RA and TGFbwas not correlated with the percentage of mem-ory CD4+ T cells in either SLE patients or HCs (data not shown). Overall, these results suggest that the pre-sence of memory T cells interferes with the expansion
of Tregs by RA and TGFbmore in SLE patients than in HCs, possibility because of the higher frequency of the memory T cells in patients.
The expansion of the CD25 FOXP3 CD4+subsets by RA and TGFbis affected by expression of the PBX1-d isoform
Pbx1-d over-expression is associated with an increased CD4+ T cell activation and a reduced Treg number and function. Furthermore, we have shown that murine CD4
+
T cells expressing Pbx1-d and human Jurkat T cells transfected withPBX1-dpresented a defective response to RA (Cuda et al., in revision). PBX1-d was also expressed significantly more frequently in the CD4+ T cells from SLE patients than from HCs (Cuda et al., in revision). In the entire cohort combining SLE patients and HCs, PBX1-d expression was associated with CD4+ T cell leucopenia and higher ratios of memory to naïve CD4+ T cells. These results prompted us to examine whether the expansion of the CD25 FOXP3 CD4+ sub-sets by RA and TGFbwere affected by the expression of thePBX1isoforms.
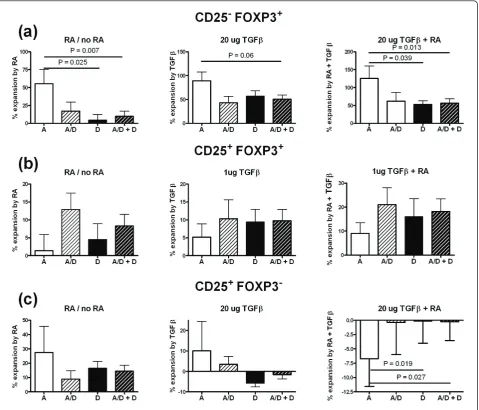
[image:11.595.59.538.89.319.2]The expression of the PBX1-d isoform was asso-ciated with a significantly decreased expansion of CD25- Tregs by RA alone or by the combination of RA and TGFb (Figure 7a). The same trend was observed for their expansion by TGFb alone. The
Figure 6Memory CD45RO+CD45RA-CD4+T cells are associated with a lower induction of FOXP3 by (transforming growth factor
beta) TGFband retinoic acid (RA) in systemic lupus erythematosus (SLE) patients. (a) Treg expansion by RA in the presence of 1 ug/ml of TGFbwas negatively correlated with the percentage of memory CD4+T cells in the peripheral blood mononuclear cells (PBMCs) of SLE patients
but not healthy controls (HCs). (b) Treg expansion by the combination of RA and 1 ug/ml of TGFbover the absence of both RA and TGFbwas negatively correlated with the percentage of memory CD4+T cells in the PBMCs of SLE patients but not HCs. HCs are represented by white
percentage of CD25- Tregs found prior to RA and TGFbexpansion was higher in the SLE patients than in HCs (Figure 2c). When the samples were partitioned according to the PBX1 isoform, individuals expressing the PBX1-d isoform presented significantly higher levels of CD25- Tregs prior to RA and TGFb expan-sion than individuals with only the PBX1-a isoform (3.38 ± 0.37% vs. 2.30 ± 0.34%, respectively, P = 0.0035). These results indicate that PBX1-d is asso-ciated with a higher level of CD25- Tregs, but to a decreased expansion of these cells in response to RA or TGFb. The PBX1 isoforms did not affect the expan-sion of Tregs by RA, TGFb, or the combination of the
[image:12.595.60.540.89.499.2]two (Figure 7b). The same result was obtained with all the combinations of RA and TGFb tested in this study (data not shown). Finally, the expansion of CD25+ FOXP3-CD4+ T cells by either RA or TGFbalone was not affected by PBX1 isoform expression (Figure 7c, left and center). However, the combination of RA or TGFbreduced the percentage of CD25+ FOXP3- CD4+ T only when these cells expressed PBX1-a, while the percentage of cells expressing PBX1-d was not changed by RA and TGFb (Figure 5c, right). Overall these results suggest that PBX1-d expression is involved in FOXP3 and CD25 expression, and that it may interfere with RA and TGFbsignals in CD4+ T cells.
Figure 7PBX1-D expression affects FOXP3 and CD25 induction by retinoic acid and (transforming growth factor beta). Combined CD4+
T cells from systemic lupus erythematosus patients (SLE) and healthy controls (HCs) were partitioned according to their expression of the PBX1-A (white), PBX1-D (black), co-expression of both PBX1-A and PBX1-D (A/D, light hatched) or either PBX1-D or PBX1-A/D (heavy hatched) isoforms. The expansion of CD25-regulatory T cells (Tregs) (a), Tregs (b) and CD25+FOXP3-CD4+T cells(c)is shown by retinoic acid (RA) alone (left
Discussion
Many studies have examined the number and function of Tregs in lupus patients, but to our knowledge none has examined the ability of iTregs from lupus patients to be induced and expanded in vitro as compared to HCs. Basic parameters of our lupus cohort confirmed previous findings, such as reduced numbers of CD4+ T cells, skewed memory to naïve CD4+ T cell ratios and a reduced CD25+ Treg compartment in patients with active renal disease. Mouse studies have shown a func-tional link between lymphopenia and Treg instability [30], and suggest that the CD4+T cell lymphopenia and reduced Treg numbers found in SLE patients may also be linked. We also confirmed the expansion of CD25 -Tregs in SLE patients, indicating that our study popula-tion was similar to most cohorts that have been recently used in the field. In vitroassays showed, however, that this FOXP3+ subset is not suppressive, while the matched CD25+ FOXP3+cells were suppressive to vari-able, but significant levels. These data support Yang et al.’s findings [13], indicating that the CD25- FOXP3+ population that is expanded in SLE patients corresponds to either activated T cells or to“ex-Treg” that have lost their suppressive activity. Further analyses, including the methylation status of the FOXP3 locus, will be necessary to distinguish these possibilities.
A defective homeostatic regulation of FOXP3 expres-sion in SLE CD4+ T cells was indicated by the absence of the correlations found in HCs. The inverse correla-tion between memory T cells and Tregs reported in our HC cohort corresponds to the reciprocal balance between immune suppression and inflammation [31]. The positive correlation that we observed between the percentage of CD25- Tregs and memory T cells in HCs could be interpreted either as these cells representing an activated non-regulatory subset [13] or a response to high levels of activation [14]. Nonetheless, these correla-tions between FOXP3 expressing T cells and memory T cells did not exist in lupus patients, while a positive cor-relation between CD25+ FOXP3- CD4+ T cells and memory T cells was maintained. This strongly suggests a defect in homeostatic regulation of FOXP3+T cells in lupus patients. A recent study has shown that the mechanisms involved in balancing Th1 and Th17 regu-lation are defective in lupus patients [32]. Given the plasticity of the CD4+ T cell subsets [33], future studies should determine whether the defective regulations of FOXP3+ T cells and Th1/Th17 T cells in lupus patients are functionally related.
As expected, RA expanded the TGFb induction of Tregs and decreased the proportion of CD25+ FOXP3 -CD4+ T cells in HCs. The effects of RA and TGFb on SLE T cells were, however, more complex, and different when considered singly or in combination. TGFb alone
expanded significantly more lupus Tregs than HC Tregs. Several studies have found decreased levels of TGFb in SLE patients [34] (although a recent one did not find any difference [32]), and the enhanced response that we observed in SLE Tregs may represent a conse-quence of a relativein vivo TGFbstarvation. RA alone also expanded SLE Tregs, while there was no expansion of HC Tregs. In the presence of TGFb, however, the benefit of RA exposure was significantly less for SLE Treg expansion than for HC Treg expansion. This sug-gests that the integration of the TGFband RA signals might be defective in lupus T cells, which will have to be investigated systematically at the cellular and molecu-lar levels. Several mechanisms have been proposed for RA expansion of TGBb-induced Tregs, including by enhancing Foxp3 transcription and counteracting IL-6 signaling [19,35], or blocking CD4+ CD44hi memory cells from inhibiting iTreg differentiation [29]. The negative correlation that we have found between the levels of memory T cells and Treg expansion by the combination of TGFband RA in SLE patients suggests that at least the latter mechanism is defective, either because there are too many memory T cells or they are refractory to RA inhibition. Interestingly, the CD25 -Tregs were also expanded by the combination of RA and TGBb, and these cells responded less to TGBband to the combination of TGBb and RA in SLE patients than HCs. Finally, the CD25+ FOXP3- CD4+ T cells responded to TGBb and RA in opposite directions between SLE patients and HC controls, with an expan-sion in the former and a reduction in the latter. Overall, these results suggest that the integration of the TGBb and RA pathways that are involved in the induction of CD4+ T cell subsets are defective in lupus patients. A pro-inflammatory role of RA has been recently discov-ered when it is expressed with high levels of IL-15 in the gut [36]. SLE patients express high levels of pro-inflammatory cytokines; therefore, creating a milieu that may promote RA pro-inflammatory role, a hypothesis that will have to be tested in future studies.
PBX1-d expression in the general population was asso-ciated with decreased CD4+ T cell numbers and increased levels of memory CD4+T cells (Cudaet al., in revision). In this study, we found that PBX1-d expres-sion had no effect of CD25+ Treg expansion by TGFb and RA. PBX1-d was however associated with a higher level of CD25-Tregs, but to a defective expansion of these cells in response to TGFband RA. The nature of the molecular events by which PBX1-d promotes CD25 -Treg expansion remains to be determined.
Conclusions
Overall, the expression of the PBX1-d isoform that is significantly associated with SLE in both murine and human T cells impacts the homeostasis of memory T cells (Cuda et al., in revision) and regulatory T cells, including that of CD25- Tregs that we have found to have lost their regulatory functions (this study). This represents a novel mechanism of auto-reactive T cell regulation that needs to be elucidated at the molecular level.
Abbreviations
CFSE: carboxyfluorescein succinimidyl ester; HCs: healthy controls; iTregs: induced Tregs; nTreg: natural Tregs; PBMCs: peripheral blood mononuclear cells; RA: all trans retinoic acid; SLE: systemic lupus erythematosus; SLEDAI: Systemic Lupus Erythematosus Disease Activity Index; Tregs: CD4+CD25+ FOXP3+regulatory T cells.
Acknowledgements
We thank the members of the Morel Laboratory for stimulating discussions, the staff of the UF lupus clinic for recruitment of the patients and HCs. This work was supported by grants from the Alliance for Lupus Research and the NIH R01-AI045050 (LM). Adriana Abid was the recipient of an undergraduate summer scholarship from the Howard Hughes Medical Institute.
Author details
1Department of Medicine, Division of Rheumatology and Clinical Medicine,
University of Florida, 1600 Archer Road, Gainesville, FL 32610-0275, USA.
2Department of Pathology, Immunology, and Laboratory Medicine, University
of Florida, 1600 Archer Road, Gainesville, FL 32610-0275, USA.3Department of Biostatistics, University of Florida, 1600 Archer Road, Gainesville, FL 32610-0275, USA.4Department of Medicine, Division of Rheumatology, Feinberg School of Medicine, Northwestern University, 240 East Huron Street, McGaw M360f, Chicago, IL 60611, USA.5School of Medicine, Emory University,101 Woodruff Circle, Woodruff Memorial Research Building, Suite 1315, Atlanta, GA 30322, USA.
Authors’contributions
ES and LM had full access to all of the data in the study and took responsibility for the integrity of the data as well as for the preparation of the manuscript. They designed the study and analyzed the data. TB participated in the design of the suppression assays and provided reagents. ES and WR recruited the patients. EB, AA and SW performed the
experiments. WH supervised the statistical analysis. CC participated in the study design. All authors have read and approved the manuscript.
Competing interests
The authors declare that they have no competing interests.
Received: 7 September 2010 Revised: 3 November 2010 Accepted: 27 June 2011 Published: 27 June 2011
References
1. Shlomchik MJ, Craft JE, Mamula MJ:From T to B and back again: positive feedback in systemic autoimmune disease.Nat Rev Immunol2001,
1:147-153.
2. La Cava A:Lupus and T cells.Lupus2009,18:196-201.
3. Messner RP, Lindstrom FD, Williams RC Jr:Peripheral blood lymphocyte cell surface markers during the course of systemic lupus erythematosus. J Clin Invest1973,52:3046-3056.
4. Glinski W, Gershwin ME, Steinberg AD:Fractionation of cells on a discontinuous Ficoll gradient. Study of subpopulations of human T cells using anti-T-cell antibodies from patients with systemic lupus erythematosus.J Clin Invest1976,57:604-614.
5. Rivero SJ, az-Jouanen E, Alarcon-Segovia D:Lymphopenia in systemic lupus erythematosus. Clinical, diagnostic, and prognostic significance. Arthritis Rheum1978,21:295-305.
6. Tsokos GC, Nambiar MP, Tenbrock K, Juang YT:Rewiring the T-cell: signaling defects and novel prospects for the treatment of SLE.Trends Immunol2003,24:259-263.
7. Murashima A, Takasaki Y, Ohgaki M, Hashimoto H, Shirai T, Hirose S:
Activated peripheral blood mononuclear cells detected by murine monoclonal antibodies to proliferating cell nuclear antigen in active lupus patients.J Clin Immunol1990,10:28-37.
8. Dawisha SM, Gmelig-Meyling F, Steinberg AD:Assessment of clinical parameters associated with increased frequency of mutant T cells in patients with systemic lupus erythematosus.Arthritis Rheum1994,
37:270-277.
9. Scalapino KJ, Tang Q, Bluestone JA, Bonyhadi ML, Daikh DI:Suppression of disease in New Zealand Black/New Zealand White lupus-prone mice by adoptive transfer ofex vivoexpanded regulatory T cells.J Immunol2006,
177:1451-1459.
10. Horwitz DA:Regulatory T cells in systemic lupus erythematosus: past, present and future.Arthritis Res Ther2008,10:227.
11. Bonelli M, Smolen JS, Scheinecker C:Treg and lupus.Ann Rheum Dis2010,
69:i65-i66.
12. La Cava A:The busy life of regulatory T cells in systemic lupus erythematosus.Discov Med2009,8:13-17.
13. Yang HX, Zhang W, Zhao LD, Li Y, Zhang FC, Tang FL, He W, Zhang X:Are CD4+CD25-Foxp3+ cells in untreated new-onset lupus patients regulatory T cells?Arthritis Res Ther2009,11:R153.
14. Bonelli M, Savitskaya A, Steiner CW, Rath E, Smolen JS, Scheinecker C:
Phenotypic and functional analysis of CD4+CD25-Foxp3+ T cells in patients with systemic lupus erythematosus.J Immunol2009,
182:1689-1695.
15. Horwitz D:Identity of mysterious CD4+CD25-Foxp3+ cells in SLE.Arthritis Res Ther2010,12:101.
16. Benson MJ, Pino-Lagos K, Rosemblatt M, Noelle RJ:All-trans retinoic acid mediates enhanced T reg cell growth, differentiation, and gut homing in the face of high levels of co-stimulation.J Exp Med2007,
204:1765-1774.
17. Bettelli E, Carrier Y, Gao W, Korn T, Strom TB, Oukka M, Weiner HL, Kuchroo VK:Reciprocal developmental pathways for the generation of pathogenic effector TH17 and regulatory T cells.Nature2006,
441:235-238.
18. Wang J, Huizinga TW, Toes RE:De novo generation and enhanced suppression of human CD4+CD25+ regulatory T cells by retinoic acid.J Immunol2009,183:4119-4126.
19. Zhou X, Kong N, Wang J, Fan H, Zou H, Horwitz D, Brand D, Liu Z, Zheng SG:Cutting Edge: All-trans retinoic acid sustains the stability and function of natural regulatory T cells in an inflammatory milieu.J Immunol2010,185:2675-2679.
20. Golovina TN, Mikheeva T, Brusko TM, Blazar BR, Bluestone JA, Riley JL:
Retinoic acid and rapamycin differentially affect and synergistically promote theex vivoexpansion of natural human T regulatory cells.PLoS ONE2011,6:e15868.
21. Chen Y, Cuda C, Morel L:Genetic determination of T cell help in loss of tolerance to nuclear antigens.J Immunol2005,174:7692-7702. 22. Cuda CM, Zeumer L, Sobel ES, Croker BP, Morel L:Murine lupus
23. Griffiths B, Mosca M, Gordon C:Assessment of patients with systemic lupus erythematosus and the use of lupus disease activity indices.Best Pract Res Clin Rheumatol2005,19:685-708.
24. Guy M, Borzomato JK, Newall RG, Kalra PA, Price CP:Protein and albumin-to-creatinine ratios in random urines accurately predict 24 h protein and albumin loss in patients with kidney disease.Ann Clin Biochem2009,
46:468-476.
25. Putnam AL, Brusko TM, Lee MR, Liu W, Szot GL, Ghosh T, Atkinson MA, Bluestone JA:Expansion of human regulatory T-cells from patients with type 1 diabetes.Diabetes2009,58:652-662.
26. Roederer M:Interpretation of cellular proliferation data: avoid the panglossian.Cytometry A2011,79:95-101.
27. Liu W, Putnam AL, Xu-Yu Z, Szot GL, Lee MR, Zhu S, Gottlieb PA, Kapranov P, Gingeras TR, Fazekas de St Groth B, Clayberger C, Soper DM, Ziegler SF, Bluestone JA:CD127 expression inversely correlates with FoxP3 and suppressive function of human CD4+ T reg cells.J Exp Med
2006,203:1701-1711.
28. Scheinecker C, Bonelli M, Smolen JS:Pathogenetic aspects of systemic lupus erythematosus with an emphasis on regulatory T cells.J Autoimmun2010,35:269-275.
29. Hill JA, Hall JA, Sun CM, Cai Q, Ghyselinck N, Chambon P, Belkaid Y, Mathis D, Benoist C:Retinoic acid enhances Foxp3 induction indirectly by relieving inhibition from CD4 + CD44hi cells.Immunity2008,29:758-770. 30. Zhou X, Bailey-Bucktrout S, Jeker LT, Bluestone JA:Plasticity of CD4(+)
FoxP3(+) T cells.Curr Opin Immunol2009,21:281-285.
31. Sakaguchi S, Ono M, Setoguchi R, Yagi H, Hori S, Fehervari Z, Shimizu J, Takahashi T, Nomura T:Foxp3+ CD25+ CD4+ natural regulatory T cells in dominant self-tolerance and autoimmune disease.Immunol Rev2006,
212:8-27.
32. Shah K, Lee WW, Lee SH, Kim SH, Kang SW, Craft J, Kang I:Dysregulated balance of Th17 and Th1 cells in systemic lupus erythematosus.Arthritis Res Ther2010,12:R53.
33. Murphy KM, Stockinger B:Effector T cell plasticity: flexibility in the face of changing circumstances.Nat Immunol2010,11:674-680.
34. Barreto M, Ferreira R, Lourenco L, Moraes-Fontes M, Santos E, Alves M, Carvalho C, Martins B, Andreia R, Viana J, Vasconcelos C, Mota-Vieira L, Ferreira C, Demengeot J, Vicente A:Low frequency of CD4+CD25+ Treg in SLE patients: a heritable trait associated with CTLA4 and TGFb gene variants.BMC Immunol2009,10:5.
35. Xiao S, Jin H, Korn T, Liu SM, Oukka M, Lim B, Kuchroo VK:Retinoic acid increases Foxp3+ regulatory T cells and inhibits development of Th17 cells by enhancing TGF-beta-driven Smad3 signaling and inhibiting IL-6 and IL-23 receptor expression.J Immunol2008,181:2277-2284. 36. DePaolo RW, Abadie V, Tang F, Fehlner-Peach H, Hall JA, Wang W,
Marietta EV, Kasarda DD, Waldmann TA, Murray JA, Semrad C, Kupfer SS, Belkaid Y, Guandalini S, Jabri B:Co-adjuvant effects of retinoic acid and IL-15 induce inflammatory immunity to dietary antigens.Nature2011,
471:220-224.
37. Qin P, Haberbusch JM, Zhang Z, Soprano KJ, Soprano DR:Pre-B cell leukemia transcription factor (PBX) proteins are important mediators for retinoic acid-dependent endodermal and neuronal differentiation of mouse embryonal carcinoma P19 cells.J Biol Chem2004,
279:16263-16271.
38. Chung EY, Liu J, Homma Y, Zhang Y, Brendolan A, Saggese M, Han J, Silverstein R, Selleri L, Ma X:Interleukin-10 expression in macrophages during phagocytosis of apoptotic cells is mediated by homeodomain proteins Pbx1 and Prep-1.Immunity2007,27:952-964.
doi:10.1186/ar3387
Cite this article as:Sobelet al.:Defective response of CD4+T cells to
retinoic acid and TGFbin systemic lupus erythematosus.Arthritis Research & Therapy201113:R106.
Submit your next manuscript to BioMed Central and take full advantage of:
• Convenient online submission
• Thorough peer review
• No space constraints or color figure charges
• Immediate publication on acceptance
• Inclusion in PubMed, CAS, Scopus and Google Scholar
• Research which is freely available for redistribution