© 2018, IRJET | Impact Factor value: 6.171 | ISO 9001:2008 Certified Journal | Page 2740
Study on Effect of the Center of Gravity on Vehicular Acceleration
Shreyas M
1, Shashank S P
2, Sayan Surendran
3, Gopal Krishna G V
4. 1Master of Technology, Machine Design.2Master of Technology, Production Engineering and System Technology. 3,4 Bachelor of Engineering, Mechanical Engineering
Mysuru city, Karnataka State, India-570012
---***---Abstract:
The most desirable dynamic characteristics ofany vehicle are stability at higher speeds and ease of handling at lower speed with minimal driver effort. These characteristics depend on center of gravity, mass, inertial parameters of vehicle and rolling/adhesive characteristics of tyres. The purpose of this work is to study the Indian cars (1250cc) for their acceleration performance and comparing the acceleration performance of different vehicles of same category namely Maruthi Suzuki Swift, Maruthi Suzuki Ritz, and Maruthi Suzuki Baleno under different conditions. Graphically we have shown the maximum achievable acceleration by varying the Coefficient of adhesion for different load conditions on various gradient.
Keywords: Center of Gravity, Acceleration, Coefficient of adhesion.
1. INTRODUCTION
In this era of transformation, four wheelers are nowadays an indispensable rather than symbol of status for every individual. It was in 1898 that the first motor car rode down India’s roads and until the First World War, about 4000 cars were directly imported to India from foreign countries. India holds the 15 positions in largest passenger car markets globally, by 2018 Indian expected to become top 10 markets internationally. After independence, many multinational manufacturers have set up their operations in India. The latest movement of new cars on the Indian road has led to the emergence of an entirely new market in the pre-owned cars segment. Also, the pre-owned car market is set to grow at a CAGR of 18-20% end of 2015. There cannot be a second opinion on the fact that the automobiles have become the indispensable part of our life. Today world over development of automobile is just beyond imagination these years. It is barely an indicator of country economy, but an individual’s development chart can be measured on the grounds of the automotive vehicles used by him for day to day work and also for delight, status and fashion as well. The vehicle industry in India is one of the largest in the world and one of the fastest growing globally. It is also considered as a most profitable industry worldwide. According to the reports of Society of Indian Automobile Manufacturers [SIAM], annual car sales are anticipated to attain 5 million vehicles by end of 2015 and more than 9 million by 2020. To trust New York Times reports, a number of automobile corporations like Nissan, Hyundai
Motors, Toyota, Suzuki and Volkswagen have expanded their manufacturing amenities due to India's strong engineering base and expertise in the manufacturing of cost-effective, in terms of fuel-efficient cars. [1]
Usually in INDIA and some other economically developing countries, the car consumers focus only on economical operations, low cost and better aesthetics and vehicle manufacturing companies also give much more importance to consumer requirements which are economical operation, low cost, better aesthetics and high speed by sacrificing the factors such as vehicle mass and other parameters which affects dynamic imbalance to car. The dynamic imbalance may be due to neglecting the mass of the vehicle, Tyres parameters, Variation in location of CG, Coefficient of adhesion(µ) and etc., when the vehicle accelerates/brakes or when vehicle taking turn on a curvature or when the vehicle moving up/ down the gradient. .
The purpose of this work is to study the Indian cars (1250cc) for their acceleration performance and comparing the acceleration performance of different vehicles of same category namely Maruthi Suzuki Swift, Maruthi Suzuki Ritz, and Maruthi Suzuki Baleno under different conditions.
2. ACCELARATION AND BRAKING
PERFORMANCE OF GROUND VEHICLE
The handling and acceleration/braking characteristics of road vehicles have been greatly improved in the past twenty years through the use of electronic devices. Anti-lock braking systems (ABS) and traction control systems (TCS) have been developed to prevent wheel lockup and spinning, which improve the acceleration/deceleration performance as well as directional stability of vehicles especially on slippery roads. Acceleration performance of road vehicle is to achieve maximum longitudinal acceleration without compromising the capability of following the curve and the driver safety. The maximum achievable acceleration of the ground vehicle is different at different operating conditions viz. when a vehicle moving on a level road or when a vehicle negotiating gradient, in that case weight shift occurs between front
and rear axles when the vehicle is
© 2018, IRJET | Impact Factor value: 6.171 | ISO 9001:2008 Certified Journal | Page 2741 performance, it is necessary to control each tyre according
to its capacity. When the vehicle is accelerating/decelerating in a curve, proper distribution of tyre forces is important to maintain vehicle stability. The tyre friction coefficient will be the most important factor affecting the maximum acceleration in any direction. At high speed the maximum longitudinal acceleration is usually limited by the amount of power available at the wheel.
2.1 Factor influences on acceleration and braking performance of ground vehicles
There are so many factors that influences on the performance of ground vehicles, those factors include the coefficient of adhesion (μ), co-efficient of rolling resistance (μR), Road or surface parameters, aerodynamic resistance, centre of gravity (CG) and driver response.
1) Coefficient of adhesion (μ)
One of the basic safety requirements on roadways is the skid resistance. It plays very important role especially during wet and rainy conditions. Friction on pavement surface plays an important role in keeping a vehicle safe on the pavement surface. It can dramatically influence braking distance and on acceleration with safety. It is defined as a friction force rising in a contact area of tyre and pavement created due to vehicle motion. It is concerned about tangential reaction of pavement serving for transfer of driving force or brake force on the perimeter of a wheel.
2) Factors influences on coefficient of adhesion (μ):
The most important factors that affect the friction coefficient are:
1. Road surface, 2. Tyre factors, 3. Weather conditions, 4. Vehicle speed
3) Coefficient of rolling resistance (μR)
Like coefficient of adhesion (μ) or grip, the rolling resistance of tyres is due to the viscoelasticity of the rubber, which implies an energy loss each time the material undergoes distortion. Like co-efficient of adhesion there are so many factors influence the rolling resistance of tyre, which are as follows.
1. Tyre parameters 2. Road surface and 3. Vehicle speed
3. Importance of the C.G
When making an analysis of the forces applied on the car, the C.G is the point to place the vehicle weight, and the centrifugal forces when the vehicle is turning or when accelerating or decelerating. Any force that acts through the C.G has no tendency to make the vehicle rotate. The center of mass height, relative to the track, determines load transfer, (related to, but not exactly weight transfer), from side to side and causes body lean. When tyres of a vehicle provide a centripetal force to pull it around a turn, the momentum of the vehicle actuates load transfer in a direction going from the vehicle's current position to a point on a path tangent to the vehicle's path. This load transfer presents itself in the form of body lean. Body lean can be controlled by lowering the center of weight; it can also be controlled by the springs, anti-roll bars or the roll center heights. The center of mass height, relative to the wheelbase, determines load transfer between front and rear. The vehicles momentum acts at its center of mass to tilt the vehicle forward or backward, respectively during braking and acceleration. Since it is only the downward force that changes and not the location of the center of mass, the effect on over/under steer is opposite to that of an actual change in the center of mass. A lower center of mass is a principal performance advantage of sports cars, compared to sedans and (especially) SUVs. Some cars have body panels made of lightweight materials partly for this reason.
4. MEASURING THE PARAMETERS THAT
INFLUENCES ON PERFORMANCE OF GROUND VEHICLES
© 2018, IRJET | Impact Factor value: 6.171 | ISO 9001:2008 Certified Journal | Page 2742 4.1 Horizontal Weighing:
1) Wheel base side (L)
Fig 1: Free body diagram of car resting on a level road (Wheel Base)
The procedure is to first perform a force balance in the vertical direction, thus
F= Wf+Wr-W=0……….(1) Then a moment balance around point A:
MA=Wr*L-W*l1=0…………..(2)
Forces Wf and Wr can easily be determined with a weighing scale. Equation (1) can be rearranged to yield
W= Wf+ Wr
Once W is known, equation (2) can yield distance a
l1=
l2=L-l1………(3)
So now, we know the horizontal distance from the front axle to the center of mass G. Similarly, we can find the horizontal distance from rear axle using equation (3).
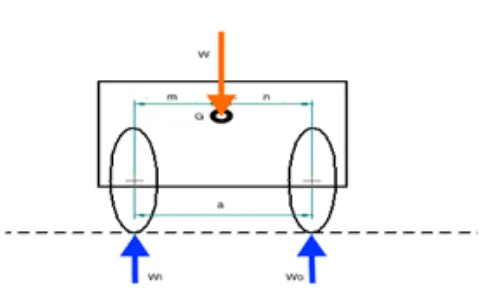
2) Wheel track side (a)
Fig 2: Free body diagram of car resting on a level road (Wheel Track)
The procedure is to first perform a force balance in the vertical direction, thus
F= Wi+Wo-W=0…………..(4)
Then a moment balance around points A:
MA=Wi*a-W*n=0….……..(5)
Forces Wi and Wo can easily be determined with a weighing scale. Equation (4) can be rearranged to yield
W= Wi+ Wo
Once W is known, equation (5) can yield distance a
n=
m=a-n………(6)
So now we know the horizontal distance from the from driver side wheel to the center of mass G. Similarly, we can find the horizontal distance from passenger side wheel using equation (6). Now for the vertical distance b from the front axle to the center of mass. This requires weighing of the rear tyre contact force on an angle.
[image:3.595.43.274.102.268.2]3) Angled Analysis
Fig: 3. Free body diagram of car resting on an angled surface.
Weight W is now known, and tire force Wr1 must be measured with a scale (don’t need Wf1). Also, angle must be known, although it can be computed from the measured height of the rear wheel.
b=( )
Since l1 is known from result (3), is a usable result. Finally, angle can be determined from a measurement of rear wheel height “h” and known wheel base L,
[image:3.595.315.555.387.560.2] [image:3.595.43.283.589.737.2]© 2018, IRJET | Impact Factor value: 6.171 | ISO 9001:2008 Certified Journal | Page 2743
5. LOCATION OF MASS CENTER (C.G):
[image:4.595.295.571.53.266.2]5.1 Comparison of Variation Horizontal Location of C.G from Inner Wheel
Table 1: Horizontal Location of C.G from Inner Wheel
Horizontal CG
(Distance from inner
wheel i.e. Driver side)
Swift Ritz Baleno
Empty 0.7224 0.7257 0.74906
With Driver 0.701 0.7012 0.720865
With Driver +
Passenger 0.7185 0.7176 0.74077
Track length 1.48 1.48 1.5
From chart 1 shown below, It is also observed that the horizontal location of C.G varies with weight on the vehicles. In Empty car condition, all three cars have almost the same location of C.G from the inner wheel. Swift and Ritz have almost the same value when compared with Baleno. But the total track length of Baleno is longer. Swift and Ritz are having same track length.
Chart 1: Horizontal location of C.G from inner wheel
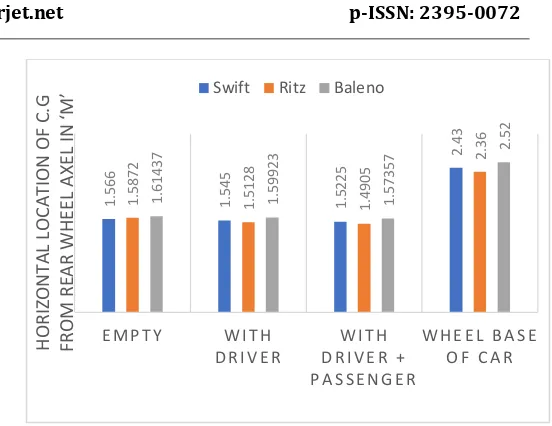
5.2 Comparison of variation Horizontal location of C.G from rear wheel axel
Table 2: Horizontal location of C.G from rear wheel axel
Chart 2: Horizontal location of C.G from rear wheel axel
From Chart 2, it is also observed that the horizontal location of C.G varies with weight on the vehicles. In Empty car condition, all three cars have almost the same location of C.G from the rear axle. Swift and Ritz have almost the same value when compared with Baleno. But the total wheel base of Baleno is higher followed by Swift. Ritz is having a smaller wheel base compared with the other two cars.
[image:4.595.36.283.400.588.2]5.3 Height of CG from Ground level
Table 3: Height of CG from Ground level
Height of CG from Ground level
Swift Ritz Baleno
Empty 0.6824 0.7387 0.6739
With Driver 0.7741 0.8297 0.7212
With Driver + Passenger 0.8447 0.918 0.77
Height of car 1.53 1.62 1.5
Chart 3: : Height of CG from Ground level
0 .7 2 2 4 0 .7 0 1 0 .7 1 8 5 1 .4 8 0 .7 2 5 7 0 .7 0 1 2 0 .7 1 7 6 1 .4 8 0 .7 4 9 0 6 0 .7 2 0 8 6 5 0 .7 4 0 7 7 1 .5
E M P T Y W I T H D R I V E R
W I T H D R I V E R + P A S S E N G E R
T R A C K L E N G T H
Swift Ritz Baleno
H or iz ont al loc at ion of C .G 1 .5 6 6 1 .5 4 5 1 .5 2 2 5 2 .4 3 1 .5 8 7 2 1 .5 1 2 8 1 .4 9 0 5 2.3 6 1 .6 1 4 3 7 1 .5 9 9 2 3 1 .5 7 3 5 7 2 .5 2
E M P T Y W I T H
D R I V E R
W I T H D R I V E R + P A S S E N G E R
W H E E L B A S E O F C A R
H OR IZ ON TAL LOC AT ION OF C .G FRO M RE AR W H EE L AXE L IN ‘M
’ Swift Ritz Baleno
0 .6 8 2 4 0 .7 7 4 1 0 .8 4 4 7 1.5 3 0 .7 3 8 7 0 .8 2 9 7 0 .9 1 8 1 .6 2 0 .6 7 3 9 0 .7 2 1 2 0 .7 7 1 .5
E M P T Y W I T H D R I V E R W I T H D R I V E R + P A S S E N G E R
H E I G H T O F C A R
Swift Ritz Baleno
HEI G HT O F C. G F R O M G R O UND LE V EL IN ' m '
Swift Ritz Baleno
Empty 1.566 1.5872 1.61437
With Driver 1.545 1.5128 1.59923
With Driver + Passenger 1.5225 1.4905 1.57357
[image:4.595.41.561.428.784.2]© 2018, IRJET | Impact Factor value: 6.171 | ISO 9001:2008 Certified Journal | Page 2744
6. MEASUREMENT OF COEFFICIENT OF ROLLING
RESISTANCE (R)
The coast-down method pinpoints all significant contributions to driving resistance, not merely the rolling resistance but also the aerodynamic resistance. The principle in coast-down measurement is to accelerate a vehicle to a certain speed and then let it roll freely in neutral gear or clutch down. As the car “coasts down,” velocity and time are measured as a minimum.
The Formula used to calculate rolling resistance
R = Ra + Rr
Ra = Cd V2
R = total resistance in N,
Ra = aerodynamics resistance in N,
Rr = rolling resistance in N
Cd = the aerodynamic coefficient
A = the frontal area in m2
V = the vehicle speed in Km/h
= the density of air
S = u t - a t2
u = the initial velocity of the vehicle (60kmph)
t = the time taken by the vehicle to stop by coasting down in sec.
S = the distance travelled by the vehicle in time t.
7. ACCELERATION PERFORMANCE OF
DIFFERENT VEHICLES
Many universities employ the experimental or analytical method to examine the acceleration and braking performance of any ground vehicles. But in our work, we employed an accurate, assumption based method i.e. an analytical method to examine the acceleration performance of different cars namely Maruthi Swift, Maruthi Ritz and Maruthi Baleno with the help of governing differential equations, these equations are derived based on some assumptions.
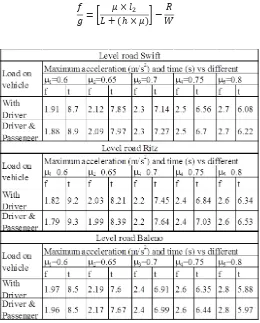
7.1 Governing Equations: Maximum achievable acceleration
1) Front wheel drive:
[image:5.595.330.556.79.217.2]a. When a vehicle moving on level road.
Fig.4: Free body diagram of car moving on a level road
[ ( )]
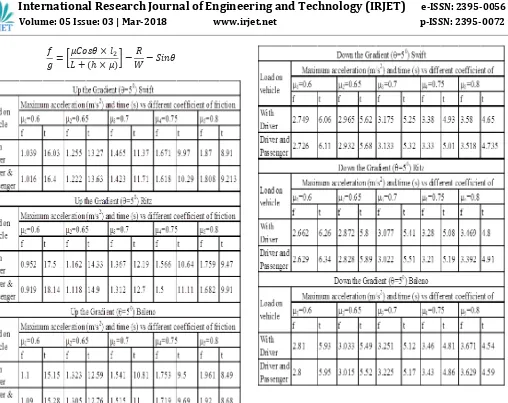
b. When a vehicle negotiating up the gradient
[image:5.595.308.568.243.566.2]© 2018, IRJET | Impact Factor value: 6.171 | ISO 9001:2008 Certified Journal | Page 2745 [
( )]
[image:6.595.50.558.37.440.2]c. When a vehicle negotiating down the gradient.
Fig.6:. Free body diagram of car moving down the gradient
[
( )]
8. RESULTS AND DISCUSSION
In this work, the factors influencing on acceleration and braking performance such as coefficient of adhesion, location of center of gravity (C.G), tyre pressure, and rolling resistance are studied experimentally, acceleration and braking performance of the vehicle is calculated with the help of governing equations. In the following section the details of the experimental results obtained for the above parameters are discussed.
8.1 Acceleration performance
© 2018, IRJET | Impact Factor value: 6.171 | ISO 9001:2008 Certified Journal | Page 2746
Chart 4: Variation of maximum achievable acceleration vs coefficient of adhesion of different vehicles on a level road
Chart.5: Variation of maximum achievable acceleration vs coefficient of adhesion of different vehicles on up the
gradient (=50)
Chart.6: Variation of maximum achievable acceleration vs coefficient of adhesion of different vehicles on down the
gradient (=50)
From Chart.4, Chart.5 and Chart.6 it is clearly seen that as the coefficient of adhesion increases the maximum achievable acceleration also increases for all the three road conditions i.e. level road, up the gradient and down the gradient. And is seen that Baleno has maximum achievable acceleration in all the three conditions of road. The maximum is at down the gradient at 3.671 m/s2. And minimum acceleration can be seen in Ritz that too in up the gradient at 1.759 m/s2. Swift maximum achievable acceleration is less than Baleno but more than that of Ritz. On down the gradient the acceleration is more and on level road it is intermediate and up the gradient having less acceleration.
Chart:.7 Variation of maximum achievable acceleration vs coefficient of adhesion of different vehicles on level road,
up the gradient (=50) and down the gradient (=50)
Chart.8 Variation of time vs coefficient of adhesion of different vehicles on level road, up the gradient (=50) and
down the gradient (=50) 0.5
0.7 0.9 1.1 1.3 1.5 1.7 1.9 2.1
0 . 5 5 0 . 6 5 0 . 7 5 0 . 8 5
ma
xi
mu
m a
ch
ie
va
b
le
a
cce
le
ra
ti
o
n
in
m/
s
2
coefficient of adhesion (𝜇)
Swift Ritz Baleno
0 0.5 1 1.5 2 2.5 3 3.5 4
0.55 0.65 0.75 0.85
max
imu
m
ach
iev
ab
le
acc
el
er
at
io
n
in
m/
s2
coefficient of adhesion (𝜇)
Swift Swift Swift
Ritz Ritz Ritz
0 2 4 6 8 10 12 14 16 18 20
0.55 0.6 0.65 0.7 0.75 0.8 0.85
ti
me
in
s
eco
n
d
s
coefficient of adhesion (𝜇)
Swift Swift Swift Ritz Ritz
© 2018, IRJET | Impact Factor value: 6.171 | ISO 9001:2008 Certified Journal | Page 2747 From Chart.7 and Chart.8 it is seen if coefficient of
adhesion increases the maximum achievable acceleration also increases. Whereas the acceleration time decreases with increase in coefficient of adhesion. The maximum acceleration time is for Ritz up the gradient at 17.5s and minimum acceleration time is for Baleno down the gradient at 4.54s.
Chart.9: Variation of maximum achievable acceleration vs coefficient of adhesion for different cars for different load
condition on level road.
Chart. 10: Variation of maximum achievable acceleration vs coefficient of adhesion for different cars for different
load condition on up the gradient road (=50).
Chart.11: Variation of maximum achievable acceleration vs coefficient of adhesion for different cars for different
load condition on down the gradient road (=50)
From Chart.9, Chart.10 and Chart.11 it is seen that maximum achievable acceleration of any car decreases with increase in load and time for acceleration increases with increase in load. For any car with driver has more maximum achievable acceleration than that of car with driver and passenger. Here also Baleno with only driver has maximum achievable acceleration (3.671 m/s2) on down the gradient than any other condition. Whereas Ritz up the gradient with the driver and passenger is having the minimum achievable acceleration (1.682 m/s2).
8.2 Effect of vertical distance of C.G from ground on maximum achievable acceleration
Chart.12: Variation of maximum achievable acceleration vs vertical distance of C.G from ground level
1.5 1.7 1.9 2.1 2.3 2.5 2.7 2.9
0.55 0.65 0.75 0.85
max
imu
m
ach
iev
ab
le
acc
el
er
at
io
n
in
m/
s2
coefficient of adhesion (𝜇)
Swift Swift Ritz
Ritz Baleno Baleno
0.5 0.7 0.9 1.1 1.3 1.5 1.7 1.9 2.1
0.55 0.65 0.75 0.85
max
imu
m
ach
iev
ab
le
acc
el
er
at
io
n
in
m/
s2
coefficient of adhesion (𝜇)
Swift Swift Ritz
2 2.2 2.4 2.6 2.8 3 3.2 3.4 3.6 3.8
0.55 0.65 0.75 0.85
max
imu
m
ach
iev
ab
le
acc
el
er
at
io
n
in
m/
s2
coefficient of adhesion (𝜇)
Swift Swift Ritz
Ritz Baleno Baleno
2.15 2.2 2.25 2.3 2.35 2.4 2.45 2.5
0.6 0.7 0.8 0.9
M
ax
im
um
ac
hi
evabl
e
ac
ce
le
rat
ion
in
m
/s
2
Vertical Distance of CG in "m"
Swift Ritz Baleno
© 2018, IRJET | Impact Factor value: 6.171 | ISO 9001:2008 Certified Journal | Page 2748
Chart.13: Variation of time vs vertical distance of C.G from ground level.
From Chart.12 and Chart.13 it is seen that as the vertical distance of C.G from the ground increases, the maximum achievable acceleration decreases and increases the time taken to accelerate. From the figure, we can observe that the acceleration is very much depended on height of C.G. Since, Baleno C.G height is less than the other two cars it achieves more acceleration and time taken is also less. Ritz C.G height is more than the other two cars it achieves less acceleration and time taken is also more.
8.3 Effect of horizontal distance of C.G from rear wheel on maximum achievable acceleration
Chart.14: Variation of maximum achievable acceleration vs horizontal distance of C.G from rear wheel
Chart.15: Variation of time vs horizontal distance of C.G from rear wheel.
From Chart.14 and Chart.15 it is seen that as the horizontal distance of C.G from rear increases, the maximum achievable acceleration increases and decreases the time taken to accelerate. From the figure, we can observe that the acceleration is very much depended on horizontal distance of C.G from rear. Since, Baleno horizontal distance of C.G from rear is more than the other two cars it achieves more acceleration and time taken is also less. Ritz C.G distance is less than the other two cars it achieves less acceleration and time taken is also more.
9 CONCLUSION
Based on the study results, the following conclusions are drawn,
1. The position of C.G in both vertical and horizontal direction influences acceleration in very large extent. Decreasing the height of C.G increases acceleration performance of the all three vehicles. This is same if we consider the overall stability criteria. This makes manufacturers to give importance on the location of C.G for acceleration performance and stability criteria’s.
2. Coefficient of tyre road adhesion makes very large difference in acceleration performance of all the vehicles. Increasing the coefficient of adhesion results in increasing the performance of the vehicles.
3. When the vehicle negotiating the gradient, the additional resistance comes in to play. Due to this additional resistance, the acceleration of the vehicles reduces when the vehicle negotiating up the gradient whereas it increases down the gradient than the level road.
6.6 6.8 7 7.2 7.4 7.6 7.8
0.6 0.7 0.8 0.9 1
Ti
me
in
s
eco
n
d
s
Vertical distance of C.G in "m"
Swift Ritz Baleno
Actual position of C.G
6 6.5 7 7.5 8 8.5
1.4 1.45 1.5 1.55 1.6 1.65 1.7
ti
m
e
in
secon
d
s
horizontal distance of C.G from rear wheel in
"m"
Swift Ritz Baleno
© 2018, IRJET | Impact Factor value: 6.171 | ISO 9001:2008 Certified Journal | Page 2749 4. Finally, based on the study we can conclude that
Maruti Suzuki Baleno has good acceleration performance among other vehicles namely Maruti Suzuki Swift and Maruti Suzuki Ritz.
REFERENCE
[1].Rakesh Kakkar et.al. “road traffic accident: retrospective study” issn: 2250-0138
[2].Dr. V V R L S Gangadhar. “Effect of tyre over load and inflation pressure on rolling loss” Professor, Department of mechanical engineering, Princeton college of Egg. & tech, Hydrabad, Telangana, INDIA.
[3].William H. bettes “Aero-dynamic drag of road vehicle”, Engineering &science, January 1982.
[4].Bharat Mohan redrouthu and Sidharth das, “Tyre modelling for rolling resistance” master’s thesis in automotive engineering. Department of Applied Mechanics Division of Vehicle Engineering and Autonomous System Vehicle Dynamics Group., Chalmers university of technology, Göteborg, Sweden 2014
[5].A handbook for the rolling resistance of pneumatic tires Clark, Samuel Kelly.
[6].Clark, S. (1977). Geometric effects on the rolling resistance of pneumatic tyres. In: Tire rolling losses and fuel economy.
[7].Wong, J. (1978)." Theory of ground vehicles. 1st ed. New York: Wiley.
[8].Eegin TÖnÖk, Y.Samim Ünluüsoy. “Prediction of automobile tire cornering force characteristics by finite element modeling and analysis” Department of Mechanical engineering, Middle east technical university, 06531 Ankara, Turkey.
[9].Filippo Donida, Gianni Ferretti, Sergio M. Savaresi, Francesco Schiavo, Mara Tanelli “Motorcycle Dynamics Library in Modelica” Politecnico di Milano, Italy Piazza Leonardo da Vinci 32, 20133 Milano.
[10]. Carlos canudas-de-wit, Panagiotis tsiotras , Efstathios velenis , Michel basset And Gerard Gissinger “Dynamic Friction Models for Road/Tire Longitudinal Interaction” Vehicle System Dynamics.39, No. 3, pp. 189–226 # Swets & Zeitlinger
NOMENCLATURE Af Frontal area.
A Front tyre contact area.
B Rear tyre contact area. b Height of CG from wheel hub. Cd Aerodynamic drag coefficient. f Acceleration in m/s2
g Acceleration due to gravity. F Tractive force.
Fv Vertical load on tyre.
Ff Front wheel tractive force (µ*Wf ) Fr Rear wheel tractive force (µ*Wr)
C.G Centre of gravity or mass position centre. h Height of C.G from ground level.
ha Height of point of application aerodynamic resistance above the ground.
hd Height of drawbar. I Mass moment of inertia. L Wheel base.
l1 Distance from front wheel to C.G. l2 Distance from rear wheel to C.G. Pr Inflation pressure in tyre. R Total resistance.
Ra Aerodynamic resistance. Rd Draw bar load.
Rg Grade resistance. Rr Total Rolling resistance.
Rrf Rolling resistance at front wheel. Rrr Rolling resistance at rear wheel. V Vehicle speed.
Wf Total normal reaction at front wheel. Wr Total normal reaction rear wheel.
Wf1 Total normal reaction at front wheel when rear wheel is lifted.
Wr1 Total normal reaction at rear wheel when rear wheel is lifted.
W Total weight of the vehicle. WE Equivalent weight (N) S Total distance travelled by car u initial velocity
t time taken by car a acceleration of car
Inertia force of the vehicle.
R0 Radius of curvature of road µ Coefficient of adhesion.
µr Coefficient of rolling resistance. Angle of inclination.