© 2018, IRJET | Impact Factor value: 6.171 | ISO 9001:2008 Certified Journal | Page 1037
STUDY OF P-DELTA EFFECT ON HIGH RISE RCC STRUCTURES
Shiwani Bharti
1, Amir
2, B.S.Tyagi
31M.Tech Student of Structural Engineering, RGEC Meerut, U.P, India, 2Assistant Professor, Neelkanth Institute of Technology, Meerut, U.P, India,
3 HOD Department of Civil Engineering RGEC Meerut, U.P, India.
---***---Abstract -
Nowadays with the increase in population and technology, the height of buildings is also increasing. To design high rise structure there should be advanced analysis procedures, P-Delta is one of them. P-Delta is a second order analysis in which the extra loads generated due to the deformation of structure are also included in addition to the applied lateral and vertical loads. This effect is not important for buildings up to a certain height but after a certain height and conditions this effect must be taken into account especially for areas with high risk of earthquake and wind loads. In this paper five models 10,15,20,25 and 30 storey buildings are taken for consideration and the effect of P-Delta is observed carefully.Key Words: P-Delta analysis, SAP 2000, linear static, nonlinear static, displacement, shear, moment, axial force.
1. INTRODUCTION
As first order analysis is very fast and famous method used by structural engineers that’s why P-Delta analysis is ignored by most of the engineers. The reason behind this ignorance is lack of awareness of structural response during earthquake. We should understand that the multi storey buildings don’t behave linearly during an earthquake so these buildings should be designed by a nonlinear analysis procedure. P-Delta effect is a kind of second order effect also called as geometric nonlinearity which is suitable for nonlinear analysis procedures.
A. Stable straight structure
B. Slightly displaced structure
C. Highly displaced structure
Fig -1: Showing three position of a structure
First order analysis gives smaller displacement values only up to point B but in actual the structure is displaced up to point C and P-delta analysis gives more accurate values of displacement near to point C. If this extra displacement demand (from B to C) is not fulfilled then structure may collapse during an Earthquake. To fulfill this demand P-Delta analysis is required. First order analysis involving linear static analysis is done by considering small deflection behavior in which the resulting forces,
stresses, moments, shear, and displacement does not account the additional effect generated due to deformation of the structure.
1.1 Meaning of p delta effect
P-Delta is coined by two terms, P and delta (Δ), P is applied axial load and Δ is horizontal displacement by lateral loads. It occurs when additional loads are generated by an axial load (P) when a vertical member is displaced by a lateral load (Earthquake load or wind load). Since EQ loads are more dominant than wind loads so this study is limited for EQ loads only.
P- Δ is more adverse in moment resisting frames than shear core or braced system because moment frames are not so stiff, they are soft system which tends to deflect more due to lateral loads which gives more value of delta and hence more deflection. Whereas in case of shear core and braced system the structure is very stiff so this type of structure are not so much influenced by P- Δ effect.
2. OBJECTIVES
1. In depth study of P-Delta effect on a high rise RCC buildings.
2. To analyse buildings with linear and nonlinear methods using SAP 2000 V 20.0.0.
3. To compare the results obtained with linear static analysis and nonlinear static analysis i.e. P-Delta analysis.
4. With the help of the results, obtain a height after which P-Delta is important according to the model’s condition.
3. MODEL CONFIGURATION
Five building models of 10,15,20,25 and 30 storey are created with the following data
Plan area = 900 m2
No. of Bays in X&Y Dir. = 5 @ 6m c/c
Height of each storey = 3m
Beam M25 = 450 × 400 mm
Column M30 = 550 × 550 mm
© 2018, IRJET | Impact Factor value: 6.171 | ISO 9001:2008 Certified Journal | Page 1038 DESIGN OF BUILDINGS - RCC frame is designed according
to IS 456:2000. Seismic analysis is done according to IS 1893- 2016. Beam- slab building type is used. All other data is taken as default according to IS codes and SAP 2000 V 20.0.0.
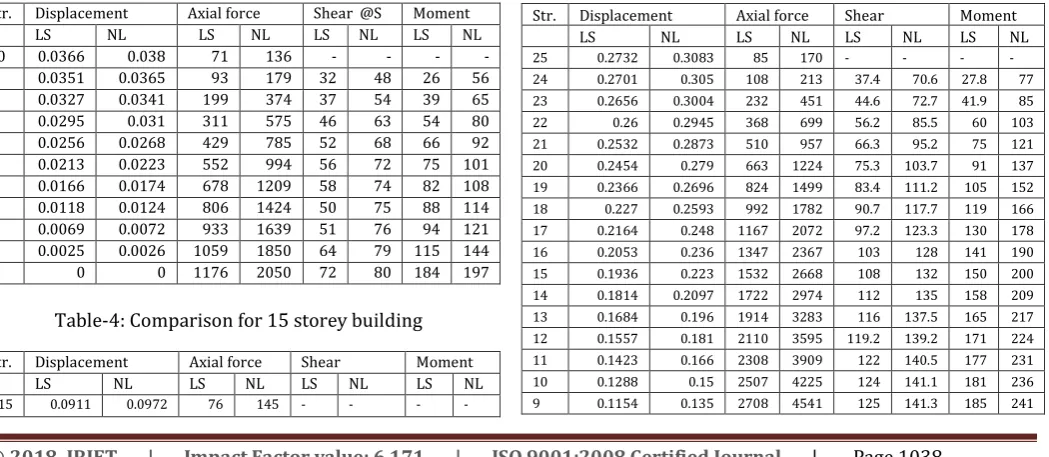
[image:2.595.42.566.281.528.2]Common parameter of all buildings - Displacement and axial force values are selected from each storey @ X-Z, Y=0 from extreme left edges. Axial force (-ve) values are selected from each storey @ X-Z, Y=0 from extreme left edges from the beam diagram and highest value was chosen for comparison. Shear values were chosen @ S 2-2, and selected from each storey @ X-Z, Y=0 from extreme left columns. Moment values were chosen @ M 3-3 and selected from each storey @ X-Z, Y=0 from extreme left columns.
Table-1: Load cases that are used in SAP
Dead Type -Linear static (Dead × 1) EQX Type -Linear static (EQX × 1)
LS Type -Linear Static (Dead ×1 +EQX ×1) Dead PD Type -Nonlinear static with P-Delta (Dead × 1) NL
(P-Delta)
Type -Nonlinear static with P -Delta with Initial conditions continue from state at end of nonlinear case –Dead PD ( Dead ×1 +EQX×1)
Table -2: Various Parameters
Frame type Special Moment Resisting Frame Response reduction
factor, R
5
Seismic zone factor, Z 0.36 (V)
Soil type II (Medium soil) Importance factor 1
Time period Programme calculated
Ecc ratio 0.05
4. COMPARISON OF RESULTS OBTAINED
Table-3: Comparison for 10 storey building
Str. Displacement Axial force Shear @S 2-2
Moment @M3-3 LS NL LS NL
PD
LS NL PD
[image:2.595.28.571.282.526.2]LS NL PD 10 0.0366 0.038 71 136 - - - - 9 0.0351 0.0365 93 179 32 48 26 56 8 0.0327 0.0341 199 374 37 54 39 65 7 0.0295 0.031 311 575 46 63 54 80 6 0.0256 0.0268 429 785 52 68 66 92 5 0.0213 0.0223 552 994 56 72 75 101 4 0.0166 0.0174 678 1209 58 74 82 108 3 0.0118 0.0124 806 1424 50 75 88 114 2 0.0069 0.0072 933 1639 51 76 94 121 1 0.0025 0.0026 1059 1850 64 79 115 144 0 0 0 1176 2050 72 80 184 197
Table-4: Comparison for 15 storey building
Str. Displacement Axial force Shear Moment @M3-3
LS NL LS NL LS NL LS NL
15 0.0911 0.0972 76 145 - - - -
14 0.0891 0.0953 99 191 35 65 26 62
13 0.0861 0.0921 211 400 41 61 39 71
12 0.0819 0.0879 331 617 51 72 56 87
11 0.0769 0.0827 460 842 59 80 71 102
10 0.0711 0.0767 595 1074 65 86 83 115
9 0.0647 0.0699 736 1311 71 91 94 126
8 0.0577 0.0625 881 1553 75 94.5 103 136
7 0.0504 0.0547 1029 1797 78 97 110 143
6 0.0427 0.0465 1180 2044 81 98.6 116 149
5 0.0348 0.038 1332 2291 82 99.3 120 153
4 0.0268 0.0293 1484 2538 83 99.5 123 156
3 0.0188 0.02053 1637 2785 84 99.3 127 160
2 0.0109 0.01191 1788 3028 85 99.3 135 169
1 0.0039 0.0042 1935 3266 89 104.17 165 205
0 0 0 2069 3486 104 112.7 280 304
Table -5: Comparison for 20 storey building
Str. Displacement Axial force Shear Moment @M3-3 LS NL LS NL LS NL LS NL
20 0.1682 0.1844 82 158 - - - -
19 0.1658 0.1819 104 203 36.7 73.4 27 70
18 0.1621 0.1782 222 427 43.3 67.6 41 76
17 0.1574 0.1732 350 660 54.4 79.8 58 96
16 0.1515 0.1671 487 902 63.7 88.7 74 118
15 0.1447 0.16 632 1158 71.7 96.3 88 126
14 0.1371 0.1519 784 1410 78.7 102.7 101 141
13 0.1287 0.1431 943 1674 84.7 108.1 113 153
12 0.1197 0.1334 1106 1944 89.9 112.4 123 163
11 0.1103 0.1232 1274 2217 94.2 115.8 131 172
10 0.1003 0.1125 1445 2494 97.7 118.4 138 180
9 0.0901 0.1013 1618 2773 100.6 120.24 144 187
8 0.0796 0.0897 1794 3054 102.8 121.35 149 192
7 0.0688 0.07781 1970 3336 104.5 121.8 153 196
6 0.058 0.0657 2148 3617 105.7 121.79 156 200
5 0.0471 0.0534 2325 3899 106.5 121.3 158 202
4 0.0361 0.0409 2502 4179 107.02 120.5 161 205
3 0.0253 0.0286 2679 4457 107.5 119.7 164 209
2 0.0147 0.0165 2853 4731 108.7 120.06 174 221
1 0.0052 0.0057 3022 4997 114.5 126.55 214 267
0 0 0 3173 5239 136.4 143.71 372 410
Table -6: Comparison for 25 storey building
Str. Displacement Axial force Shear Moment @M3-3
LS NL LS NL LS NL LS NL
25 0.2732 0.3083 85 170 - - - -
24 0.2701 0.305 108 213 37.4 70.6 27.8 77
23 0.2656 0.3004 232 451 44.6 72.7 41.9 85
22 0.26 0.2945 368 699 56.2 85.5 60 103
21 0.2532 0.2873 510 957 66.3 95.2 75 121
20 0.2454 0.279 663 1224 75.3 103.7 91 137
19 0.2366 0.2696 824 1499 83.4 111.2 105 152
18 0.227 0.2593 992 1782 90.7 117.7 119 166
17 0.2164 0.248 1167 2072 97.2 123.3 130 178
16 0.2053 0.236 1347 2367 103 128 141 190
15 0.1936 0.223 1532 2668 108 132 150 200
14 0.1814 0.2097 1722 2974 112 135 158 209
13 0.1684 0.196 1914 3283 116 137.5 165 217
12 0.1557 0.181 2110 3595 119.2 139.2 171 224
11 0.1423 0.166 2308 3909 122 140.5 177 231
10 0.1288 0.15 2507 4225 124 141.1 181 236
[image:2.595.42.567.560.788.2]© 2018, IRJET | Impact Factor value: 6.171 | ISO 9001:2008 Certified Journal | Page 1039
8 0.1012 0.119 2909 4859 127.2 141 188 245
7 0.0872 0.103 3111 5176 128.2 140.3 191 248
6 0.0733 0.086 3313 5492 128.9 140 193 251
5 0.0593 0.07 3514 5808 129.4 138 196 253
4 0.0455 0.054 3715 6121 129.8 136 197 255
3 0.0317 0.0373 3914 6432 130 135 200 260
2 0.0186 0.022 4111 6739 132 136 213 276
1 0.0066 0.0075 4301 7035 139 145 262 335
[image:3.595.45.548.36.702.2]0 0 0 4469 7299 168 173 464 521
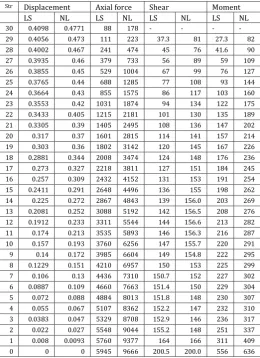
Table -7: Comparison for 30 storey building
Str
. Displacement LS NL Axial force LS NL Shear LS NL Moment @M3-3 LS NL
30 0.4098 0.4771 88 178 - - - -
29 0.4056 0.473 111 223 37.3 81 27.3 82
28 0.4002 0.467 241 474 45 76 41.6 90
27 0.3935 0.46 379 733 56 89 59 109
26 0.3855 0.45 529 1004 67 99 76 127
25 0.3765 0.44 688 1285 77 108 93 144
24 0.3664 0.43 855 1575 86 117 103 160
23 0.3553 0.42 1031 1874 94 134 122 175
22 0.3433 0.405 1215 2181 101 130 135 189
21 0.3305 0.39 1405 2495 108 136 147 202
20 0.317 0.37 1601 2815 114 141 157 214
19 0.303 0.36 1802 3142 120 145 167 226
18 0.2881 0.344 2008 3474 124 148 176 236
17 0.273 0.327 2218 3811 127 151 184 245
16 0.257 0.309 2432 4152 131 153 191 254
15 0.2411 0.291 2648 4496 136 155 198 262
14 0.225 0.272 2867 4843 139 156.0
2
203 269
13 0.2081 0.252 3088 5192 142 156.5
6
208 276
12 0.1912 0.233 3311 5544 144 156.6
6
213 282
11 0.174 0.213 3535 5893 146 156.3
8
216 287
10 0.157 0.193 3760 6256 147 155.7
4
220 291
9 0.14 0.172 3985 6604 149 154.8 222 295
8 0.1229 0.151 4210 6957 150 153 225 299
7 0.106 0.13 4436 7310 150.7 152 227 302
6 0.0887 0.109 4660 7663 151.4 150 229 304
5 0.072 0.088 4884 8013 151.8 148 230 307
4 0.055 0.067 5107 8362 152.2 147 232 310
3 0.0383 0.047 5329 8708 152.9 146 236 317
2 0.022 0.027 5548 9044 155.2 148 251 337
1 0.008 0.0093 5760 9377 164 166 311 409
0 0 0 5945 9666 200.5
5 200.0
1
556 636
Note- Since all buildings are symmetric so direction of seismic force is taken only in direction X and default units during designing in SAP are KN,m,c. and in tables str. stands for storey number.
LS- Linear static
NL- Nonlinear static means P-Delta analysis.
Displacement values are taken @ U1 translation in direction 1.
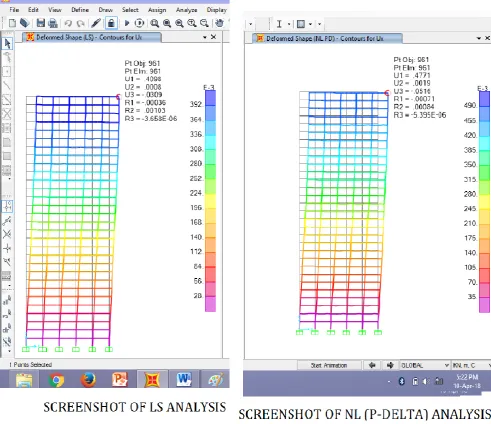
[image:3.595.31.292.215.574.2]© 2018, IRJET | Impact Factor value: 6.171 | ISO 9001:2008 Certified Journal | Page 1041
Fig -3: Screenshot of LS and NL P-Delta analysis showing displacement at top storey further results are tabulated in Table7.
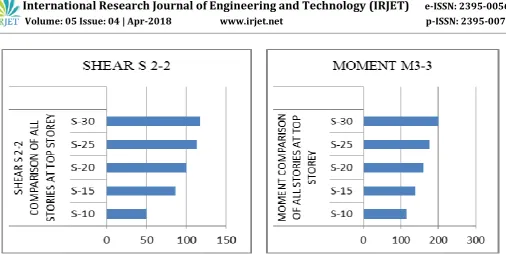
© 2018, IRJET | Impact Factor value: 6.171 | ISO 9001:2008 Certified Journal | Page 1042 Chart-3: Percentage change between LS and NL (P-Delta) analysis for shear and moment of all buildings.
5. RESULT
[image:6.595.44.551.38.292.2]The percentage change between LS and NL analysis keeping LS as initial value the changes for different stories are as follows-
Table- 8: Percentage comparison
Storey 10 15 20 25 30
Percentage change in
displacement of top storey 3.8 6.7 9.6 12.5 16.4 Percentage change in axial
force of top storey 90 91 92 100 103 Percentage change in
shear of top storey 50 86 100 113 117 Percentage change in
moment of top storey 115 138 159 177 200
6. CONCLUSION
1. The study shows that the effect of P-Delta is not significant in lower storey and for economical reasons it can be neglected but for models with storey more than 15 the change in displacement is above 9.6% so it is mandatory to include this effect.
2. The change in moment in some columns were so high that it reaches up to 200% in 30 storey model so it is very important to consider this effect.
7. FUTURE SCOPE
The models can also be analysed for large P-Delta analysis and for dynamic nonlinear case. Both of them will give larger displacement and is useful for buildings with larger plan area and slender buildings. Also non-symmetric and
irregular buildings can also be analysed which will provide even higher variation.
8. ACKNOWLEDGEMENT
My first thank is for God and my parents, and then my HOD Mr. B.S.Tyagi who helped me in selecting this topic which was a very difficult task. Then I would like to thank Mr. Amir who helped me at various stages during this study. I would also like to thank all those who are mentioned in reference section and all those unknown thousands of people who post, run and upload useful educational content and videos on Websites specially YouTube from where I learnt how to include P-Delta effect in SAP and so many things. And apart from these things I want to thank my teacher during B.Tech who taught me how to make a proper and well edited report because in the end the quality of your work’s presentation matters the most.
REFERENCES
[1] Prashant Dhadve, Alok Rao, Atul Rupanvar, Deokate K “Assessment of P-Delta Effect on High Rise Buildings” International Journal on Recent and Innovation Trends in Computing and Communication, May 2015.
[2] Duggal S. “Earthquake Resistant Design of Structures”, Oxford publication.
[3] B.J. Davidson, R.C. Fenwick and B.T. Chung, “P-delta effects in multistorey structural design”.
© 2018, IRJET | Impact Factor value: 6.171 | ISO 9001:2008 Certified Journal | Page 1043 [5] Rizwan Akhter, Shree Prakash, Mirza Aamir Baig
“P-Delta Effect on High Rise Building Subjected to Earth Quake and Wind Load”.
[6] Pushparaj J. Dhawale Prof. G. N. Narule “Analysis of p-delta effect on high rise buildings”.
[7] Rupali Bondre, Sandeep Gaikwad “Analysis of structures with Respect to linear static analysis Using p-delta effect”, 2016.
[8] Bhavani Shankar Dheekshith K., Naveen Kumar “Study on effects of p-delta analysis on RC structures”, 2017.
[9] IS 1893 (Part 1):2002 CRITERIA FOR EARTHQUAKE RESISTANT DESIGN OF STRUCTURES PART 1 GENERAL PROVISIONS AND BUILDINGS (Fifth Revision).