http://dx.doi.org/10.4236/ajor.2014.46035
Using Multi-Attribute Decision Methods in
Mathematical Modeling to Produce an Order
of Merit List of High Valued Terrorists
William P. Fox
Department of Defense Analysis, Naval Postgraduate School, Monterey, USA Email: [email protected]
Received 3 September 2014; revised 28 September 2014; accepted 15 October 2014
Copyright © 2014 by author and Scientific Research Publishing Inc.
This work is licensed under the Creative Commons Attribution International License (CC BY). http://creativecommons.org/licenses/by/4.0/
Abstract
The authors present a methodology and an example of preparing an order of merit list to rank terrorist based upon decision maker weights. This research used an old terrorist data set as our base data to keep the information unclassified. This data is used to demonstrate this methodology. The authors perform numerical iterative criteria weight sensitivity analysis to show the effects on the model’s outputs in changes in the weights. Through their analysis the most critical criterion is identified.
Keywords
Ranking Terrorists, TOPSIS, AHP, Criteria Weights, Pairwise Comparisons, Sensitivity Analysis
1. Introduction
The United States of America is fighting a war against terrorism. The National Strategy for Combating Terror (NSCT) [1] states that the United States Government’s (USG) intent is to obtain victory in the long war against terror, and that the goal and objective in that intent is to defeat terrorists and their organizations. The United States (US) has termed this strategy as the Global War on Terror (GWOT) and the targeting of terrorist organi-zations’ key personnel is an integral part of this effort.
According to Department of Defense (DoD) doctrine in Army FM 34-8-2 [2]:
inter-ference with friendly Course of Action (COAs).
Human-targeting, the process of selecting a human target exists as a subset of this more general targeting doc-trine. This human targeting research is being applied to terrorists.
A common misconception is that human-targeting denotes either a hard-power and soft-power strategy that involves either kinetic or non-kinetic power. Human-targeting is instead intent or objective neutral. It does not specify the type of action taken nor the counterterrorism (CT) objective desired. Human-targeting, rather, re- presents an analytical process that assigns a heuristic value to a target. This assignment of value allows for the prioritization of multiple targets and this prioritization permits CT organizations to direct efforts and allocate resources. Consequently, every government agency, unit, or official whose function serves to counter terrorism remains dependent on the human-targeting process [3].
To mitigate this risk of terrorist, we propose the development of a systematic method for the conduct of hu-man targeting. We test the proposition using mathematical modeling and multi-attribute decision making tools. These methods are extensively tested and used for finding key network nodes, [4] [5], and ranking phase target-ing of terrorist activities [6] [7] as well as commercial disciplines. These methods may be successfully applied to prioritize human targeting. This research is a preliminary example of this concept.
The current targeting process involves numerous complex and dynamic interactions filled with ambiguities. Minor variations in the process dramatically affect human-targeting decisions producing essentially unpredicta-ble results. In other words, CT organizations may be targeting the wrong (or a less valuaunpredicta-ble) terrorist. This inef-ficiency is not only a misuse of intelligence, but wastes limited national resources, which inevitably places lives unnecessarily at risk. Left unaddressed, this critical USG decision-making process with systemic problems could result in a catastrophic intelligence failure [3].
In previous work by Twedell and Edmonds [8], they used a series of six linear regression models to ultimately model and obtain a series of terrorist rank orderings. We believe this proposed methodology is better suited to obtain a rank ordering.
2. Proposed Methodology: The Technique of Order Preference by Similarity
to Ideal Solution (TOPSIS)
TOPSIS was the result of research and work done by Yoon and Hwang [9]. TOPSIS has been used in a wide spectrum of comparisons of alternatives including: item selection from among alternatives, ranking leaders or entities, remote sensing in regions, data mining, and supply chain operations. TOPSIS is chosen over other me-thods because it orders the feasible alternatives according to their closeness to an ideal solution [10].
Napier [11] provided some analysis of the use of TOPSIS for the department of defense in industrial base planning and item selection. For years the military used TOPSIS to rank order the systems’ request from all the branches within the service for the annual budget review process as well as being taught again in as part of deci-sion analysis. Current work is being done to show the ability of TOPSIS to rank order nodes of a dark or social network across all the metrics of social network analysis.
In manufacturing analysis, Wang [12] proposed two methods to improve TOPSIS for multi-response optimi-zation using Taguchi’s loss function. Ozturk and Batuk [13] used TOPSIS for spatial decisions and then linked to geographical information systems (GIS) operations for flood vulnerability. Olson and Wu [14] have shown how TOPSIS may be used for data mining and analysis in credit card score data. Olson and Wu [14] presented a comparison of weights (centroid weights, equal weights, and weights by linear regression) in TOPSIS models using baseball data where their conclusion is that accurate weights in TOPSIS are crucial to success.
In a business setting it has been applied to a large number of application cases in advanced manufacturing processes [15]-[17], purchasing and outsourcing [18] [19], and financial performance measurement [20].
2.1. TOPSIS Methodology
We describe the TOPSIS process is carried out through the following steps.
Step 1
Create an evaluation matrix consisting of m alternatives and n criteria, with the intersection of each alter- native and criteria given as xij, giving us a matrix
( )
ijm n×
1 2 3
11 12 13 1
1
21 22 23 2
2
31 32 33 3
3
1 2 3
n
n n n
m m m mn
M
x x x x
x x x x
A
x x x x
A
x x x x
A
x x x x
A = D Step 2
The matrix shown as D above then normalized to form the matrix
( )
ijm n×
=
R R
using the normalization method
2 for 1, 2 , ; 1, 2, ,
ij ij ij i x r x
m j n
= = =
∑
Step 3
Calculate the weighted normalized decision matrix. First we need the weights. Weights can come from either the decision maker or by computation.
Step 3(a)
Use either the decision maker’s weights for the attributes x x1, 2,,xn or compute the weights through the use Saaty’s (1980) AHP’s decision maker weights method to obtain the weights as the eigenvector to the attributes versus attribute pair-wise comparison matrix.
1 1 n j j w = =
∑
The sum of the weights over all attributes must equal 1 regardless of the method used.
Step 3(b)
Multiply the weights to each of the column entries in the matrix from Step 2to obtain the matrix, T .
( )
ij( )
j ij , 1, 2, ,m n m n
t w r i m
× ×
= = =
T
Step 4
Determine the worst alternative
( )
Aw and the best alternative( )
Ab : Examine each attribute’s column and select the largest and smallest values appropriately. If the values imply larger is better (profit) then the best al-ternatives are the largest values and if the values imply smaller is better (such as cost) then the best alternative is the smallest value.(
)
(
)
{
max 1, 2, , , min 1, 2, ,}
{
1, 2, ,}
w ij ij wj
A = t i= m j∈J− t i= m j∈J+ ≡ t j= n
(
)
(
)
{
min 1, 2, , , max 1, 2, ,}
{
1, 2, ,}
wb ij ij bj
A = t i= m j∈J− t i= m j∈J+ ≡ t j= n
where,
{
1, 2, ,}
J+ = j= n j associated with the criteria having a positive impact, and
{
1, 2, ,}
J− = j= n j associated with the criteria having a negative impact.
We suggest that if possible make all entry values in terms of positive impacts.
Step 5
Calculate the L2-distance between the target alternative i and the worst condition Aw
(
)
21 , 1, 2, ,
n
iw j ij wj i
d =
∑
= t −t = mand the distance between the alternative i and the best condition Ab
(
)
21 , 1, 2, ,
n
ib j ij bj i
where diw and dib are L2-norm distances from the target alternative i to the worst and best conditions, re-spectively.
Step 6
Calculate the similarity to the worst condition:
(
iw)
, 0 1, 1, 2, ,iw iw
iw ib
d
s s i m
d d
= ≤ ≤ =
+
1 iw
S = if and only if the alternative solution has the worst condition; and
0 iw
S = if and only if the alternative solution has the best condition.
Step 7
Rank the alternatives according to their value from Siw
(
i=1, 2,,m)
.2.2. Sensitivity Analysis
Since AHP, at least in the pairwise comparisons, is based upon subjective inputs using the 9 point scale then sensitivity analysis is extremely important. Leonelli [21] in his master’s thesis, outlines procedures for sensitivity analysis to enhance decision support tools including numerical incremental analysis of a weight, probabilistic simulations, and mathematical models. How often do we change our minds about the relative importance of an object, place, or thing? Often enough that we should alter the pairwise comparison values to determine how robust our rankings are in the AHP process. We suggest doing enough sensitivity analysis to find the “break-point” values, if they exist, of the decision maker weights that change the rankings of our alternatives. Since the pairwise comparisons are subjective matrices compiled using the Saaty’s method, we suggest as a minimum a “trial and error” sensitivity analysis using the numerical incremental analysis of the weights.
Chen [22] grouped sensitivity analysis into three main groups: numerical incremental analysis, probabilistic simulations, and mathematical models The numerical incremental analysis, also known as One-at-a-time (OAT) or “trial and error” works by incrementally changing one parameter at a time, finding the new solution and showing graphically how the ranks change. There exist several variations of this method [23] [24]. Probabilistic simulation employs Monte Carlo simulation [25] that allows random changes in the weights and simultaneously explores the effect on the ranks. Modeling may be used when it is possible to express the relationship between the input data and the solution results.
The decision weights are subject to sensitivity analysis to determine how the affect the final ranking. Sensitiv-ity analysis is essential to good analysis. Additionally, Alinezhad [26] suggests sensitivity analysis for TOPSIS for changing an attribute weight. Equation (1) was developed for adjusting weights based upon a single weight change that we used is:
(
)
(
11)
pj j
p
w
w w
w ′ − ′ =
− (1)
where w′j is the future weight of criteria j, wp the current selected weight to be changed, wp′ the new
value of the selected weight, wj is the current weight of criteria j.
3. Application to Ranking Terrorist
A CT analyst produced both target lists (blue and green) between 2004-2005 [8]. After refinement, the blue target list consisted of 21 terrorists rank-ordered in importance. Additionally, the blue target list assigns the 21 indi-viduals into “Tier” 1 through 5. After refining the second list, the green target list, it contained 31 rank ordered terrorists.
3.1. Criteria Variables: Terrorist Attributes
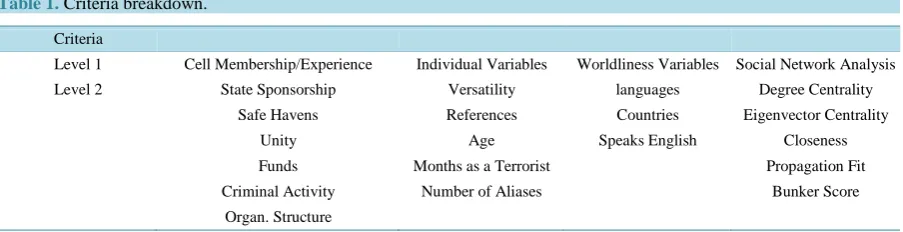
we tried to consolidate and refine the number of variables to consider. We felt that initially concentrating on the decision criteria might provide useful information. To maintain organization, we subdivided the criteria into four main categories: Cell Membership/Experience Variables; Other Individual Variables; Worldliness Variables; and SNA/Graph Measures Variables that we refer to as Level 1 criteria. We then broke each of these into sub-criteria with their own respective data that we refer to as Level 2 criteria. The Level 2 criteria were used in the OML process. This is highlighted inTable 1.
We further propose a hierarchy for our analysis. Objective: Find the Most Dangerous Terrorist Alternatives: List of terrorists active in 2008 Criteria: Level 1: Level 2 breakdown
Step 1. Obtaining the decision maker weights by level.
Level 1: Priorities: Social Network Analysis, Individual Variables, Cell membership/experience, Worldliness. A begin the pairwise comparisons using our Excel template.
Element
A Compared with B More Important Intensity (1 - 9) Social Network Individual Variables A 3
Cell membership A 4 Worldliness A 5 Individual Variables Cell membership A 2 Worldliness A 4 Cell Membership Worldliness A 4
The decision matrix is
Social Networks Individual Variables Cell Membership Worldliness Social Networks 1 3 4 5 Individual Variables 1/3 1 2 4 Cell Membership 1/4 1/2 1 4 Worldliness 1/5 1/4 1/4 1
The consistency ratio, CR = 0.0372, which is less than 0.1 implies the decision matrix is consistent. The deci-sion weights for Level 1 are:
Eigenvector Criterion Weights
Social Network 0.55728387 Individual Variables 0.21319939 Cell/Organizational Variables 0.14475047 Worldliness 0.08476628
[image:5.595.88.540.604.720.2]Next, we proceed to do similar analyses for Level 2. We will take each set of Level 2 variables and obtain their respective weights. In show how we did this in more detail for only one of the Level 1 criteria, Social Networks.
Table 1. Criteria breakdown.
Criteria
Level 1 Cell Membership/Experience Individual Variables Worldliness Variables Social Network Analysis Level 2 State Sponsorship Versatility languages Degree Centrality
Safe Havens References Countries Eigenvector Centrality Unity Age Speaks English Closeness Funds Months as a Terrorist Propagation Fit Criminal Activity Number of Aliases Bunker Score
For example, we start with the breakdown of Level 1 social network into specific Level 2 criteria shown to be valid variables and follow the same methods to obtain our decision weights.
The decision maker matrix for these sub-criteria based upon pairwise comparisons is
Degree Closeness Eigenvector Bunker Propagation
Degree 1 2 3 4 5
Closeness 1/2 1 2 3 4 Eigenvector 1/3 1/2 1 2 3 Bunker 1/4 1/3 1/2 1 2 Propagation 1/5 1/4 1/3 1/2 1
The resulting weights were found and above matrix is consistent (CR = 0.00318).
Degree 0.43799368 Closeness 0.24613871 Eigenvector 0.14836386 Bunker 0.09752303 Propagation 0.06998072
We multiply these by the Level 1 weight of 0.55728387 to obtain the weights to be used in our TOPSIS mod-el of
Degree 0.24405008 Closeness 0.13714849 Eigenvector 0.08266834 Bunker 0.05433983 Propagation 0.03899326
We followed this technique this for all Level 2 variables. We present the results only by criteria main level. Individual Variables (CR = 0.011)
Versatility 0.032969674 Number of Alias 0.022282055 Months as a Terrorist 0.076963373 Number References 0.008325744 Age 0.014376266
Cell Membership/Experience (CR = 0.02753)
Type 0.006426886 Structure 0.0489001 State Sponsor 0.013992024
Safe Havens 0.009257188 Funds 0.007394782 Criminal Activity 0.025117386 Unity 0.033661635 Leader 0.047679325 Logistics 0.010593563
Worldliness (CR = 0.003)
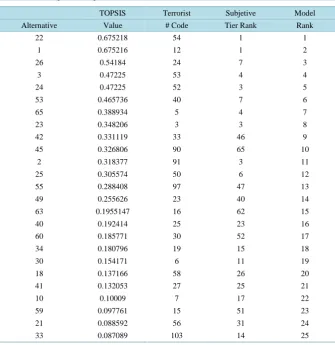
We apply the TOPSIS seven steps as described in Section 2 with the data collected for our terrorists. We present our top 25 terrorist ranking inTable 2.
3.2. Sensitivity Analysis
We apply sensitivity analysis. The sensitivity analysis should be applied to the decision maker weights because they result from subjective pairwise comparison using Saaty’s 9 point process.
We used the suggested sensitivity approach suggested by Alinezhad [26]. In their article they present mathe-matical formulas for many sensitivity results. We only use the incremental adjusted weights and with the speed of our computer template we quickly changed the weights and obtained new ranking. The formula used is re-peated here:
1
1
p j j
p
w
w w
w ′ − ′ =
−
where w′j is the new weight and wp is the original weight of the criterion to be adjusted and w′p is the value after the criterion was adjusted. We plotted the top 10 alternatives using several major adjustments in criteria weighting each time insuring a different criterion was the most heavily weighted. It is seen from the graph,
Figure 1, that the top 2 did never changed positions.
A complete sensitivity analysis would concern each decision weight being incrementally changed and finding the range over which changes in ranking did or did not occur.
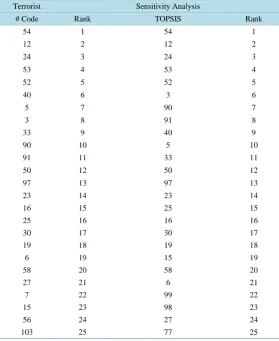
[image:7.595.144.480.376.722.2]We present a side by side comparison showing the top 25 are still about the same with order adjustments. The top5 are identical and the top 10 are still the top 10 with only terrorist #42, #55, #25 having slight ranking changes as shown in Table 3.
Table 2. Ranking of the top 25 terrorists.
TOPSIS Terrorist Subjetive Model Alternative Value # Code Tier Rank Rank
22 0.675218 54 1 1 1 0.675216 12 1 2 26 0.54184 24 7 3 3 0.47225 53 4 4 24 0.47225 52 3 5 53 0.465736 40 7 6 65 0.388934 5 4 7 23 0.348206 3 3 8 42 0.331119 33 46 9 45 0.326806 90 65 10
0 0.1 0.2 0.3 0.4 0.5 0.6 0.7 0.8 0.9
1 2
T12 T91 T53 T54 T3 T52 T24 T90 T40
[image:8.595.171.451.292.634.2]Figure 1. Sensitivity analysis for OML of one decision weight.
Table 3. Updated ranking of terrorists.
Terrorist Sensitivity Analysis
# Code Rank TOPSIS Rank
54 1 54 1
12 2 12 2
24 3 24 3
53 4 53 4
52 5 52 5
40 6 3 6
5 7 90 7
3 8 91 8
33 9 40 9
90 10 5 10
91 11 33 11 50 12 50 12 97 13 97 13 23 14 23 14 16 15 25 15 25 16 16 16 30 17 30 17 19 18 19 18
6 19 15 19
58 20 58 20
27 21 6 21
7 22 99 22
15 23 98 23 56 24 27 24 103 25 77 25
This does indicate the model results are sensitive to the decision maker’s pairwise comparisons that are used to find the decision maker weights.
4. Discussion
metho-dology, we first recommend that additional research be conducted in the form of applying this methodology to an active target set that can serve as a further proof of concept. Once our methodology can be verified and validated, we recommend integration into the targeting process of both counter-terrorist focused units and the larger force. We provide a conceptual framework for developing decision support tools for all types of decision problems beyond just the target prioritization problem. We envision an eventual suite of decision support tools and larger decision support systems to assist decision makers with a wide range of problems.
This process provides leadership at all levels with a methodology to produce a key target list among terrorist and terrorist organizations based upon quantitative analysis. We feel that having a quantitative process is better than either a totally subjective approach or a linear regression modeling approach offered by Twedell and Ed-mond’s research.
References
[1] National Strategy for Combating Terror (NSCT) (2006) Washington DC.
http://www.cbsnews.com/htdocs/pdf/NSCT0906.pdf,accessed
[2] Field Manual, FM 34-8-2 (1998) Intelligence Officers Handbook, HQ Department of the Army, Washington DC.
[3] Ormond, B. and Williams, A. (2014) Using Multi-Attribute Decision Making and Comparative Evidence to Improve Counter-Terrorist Decisions. Master’s Thesis, NPS, June 2014.
[4] Fox, W. and Everton, S. (2014) Mathematical Modeling in Social Network Analysis: Using Data Envelopment Analy-sis and Analytical Hierarchy Process to Find Node Influences in a Social Network. Journal of Defense Modeling and Simulation 2014 publication, 2014, 1-9. (published on line, journal due in summer 2014)
[5] Fox, W. and Everton, S.F. (2014) Using Mathematical Models in Decision Making Methodologies to Find Key Nodes in the Noordin Dark Network. American Journal of Operations Research,1-13 (on-line).
[6] Fox, W. and Thompson, M.N. (2014) Phase Targeting of Terrorist Attacks: Simplifying Complexity with Analytical Hierarchy Process. International Journal of Decision Sciences, 5,58-64.
[7] Thompson, N. and Fox, W. (2014) Phase Targeting of Terrorist Attacks: Simplifying Complexity with TOPSIS. Jour-nal of Defense Management, 4, 1. http://dx.doi.org/10.4172/2167-0374.1000116
[8] Twedell, P. and Edmonds, W. (2008) Countermetrics System (CMS): Using Data and Comparative Evidence to Im-prove Human-Targeting Decisions. Master’s Thesis, Naval Postgraduate School.
[9] Hwang, C.L. and Yoon, K. (1981) Multiple Attribute Decision Making: Methods and Applications. Springer-Verlag, New York. http://dx.doi.org/10.1007/978-3-642-48318-9
[10] Malczewski, J. (1996) GIS-Based Approach to Multiple Criteria Group Decision-Making. International Journal of Geographical Information Science - GIS, 10, 955-971. http://dx.doi.org/10.1080/02693799608902119
[11] Napier, J. (1992) Industrial Base Program Item Selection Indicators Analytical Enhancements. Department of Defense Pamphlet, DLA-93-P20047.
[12] Wang, Y. and He, Z. (2008) Improved TOPSIS Methods for Multi-Response Optimization. IEEE.
http://ieeexplore.ieee.org/stamp/stamp.jsp?arnumber=04721521
[13] Ozturk, D. and Batuk, F. (2011) Technique for Order Preference by Similarity to Ideal Solution (TOPSIS) for Spatial Decision Problem. Proceedings ISPRS. http://www.isprs.org/proceedings/2011/Gi4DM/PDF/PP12.pdf
[14] Olson, D. and Wu, D. (2005) Decision Making with Uncertainty and Data Mining. In: Li, X., Wang, S. and Dong, Z., Eds., Lecture Notes in Artificial Intelligence, Springer, Berlin, 1-9.
[15] Agrawal, V., Kohli, V. and Gupta, S. (1991) Computer Aided Robot Selection: The Multiple Attribute Decision Mak-ing Approach. International Journal of Production Research, 29, 1629-1644.
http://dx.doi.org/10.1080/00207549108948036
[16] Parkan, C. and Wu, M.L. (1999) Decision-Making and Performance Measurement Models with Applications to Robot Selection. Computers & Industrial Engineering, 36, 503-523. http://dx.doi.org/10.1016/S0360-8352(99)00146-1
[17] Parkan, C. and Wu, M.L. (1997) On the Equivalence of Operational Performance Measurement and Multiple Attribute Decision Making. International Journal of Production Research, 35, 2963-2988.
http://dx.doi.org/10.1080/002075497194246
[18] Kahraman, C., Engin, O., Kubak, O. and Kaya, L. (2009) Information Systems Outsourcing Decisions Using a Group Decision-Making Approach. Engineering Applications of Artificial Intelligence, 22, 832-841.
http://dx.doi.org/10.1016/j.engappai.2008.10.009
Modelling, 44, 749-761. http://dx.doi.org/10.1016/j.mcm.2005.04.018
[20] Feng, C.M. and Wang, R.T. (2001) Considering the Financial Ratios on the Performance Evaluation of Highway Bus Industry. Transport Reviews, 21, 449-467. http://dx.doi.org/10.1080/01441640010020304
[21] Leonelli, R. (2012) Enhancing a Decision Support Tool with Sensitivity Analysis. Master’s Thesis, University of Manchester, Manchester.
[22] Chen, H.Y. and Kocaoglu, D. (2008) A Sensitivity Analysis Algorithm for Hierarchical Decision Models. European Journal of Operational Research, 185, 266-288. http://dx.doi.org/10.1016/j.ejor.2006.12.029
[23] Baker, T. and Zabinsky, Z. (2011) A Multicriteria Decision Making Model for Reverse Logistics Using Analytical Hierarchy Process. Omega, 39, 558-573. http://dx.doi.org/10.1016/j.omega.2010.12.002
[24] Hurly, W.J. (2001) The Analytical Hierarchy Process: A Note on an Approach to Sensitivity Which Preserves Rank Order. Computers and Operations Research, 28, 185-188. http://dx.doi.org/10.1016/S0305-0548(99)00125-2
[25] Butler, J., Jia, J. and Dyer, J. (1997) Simulation Techniques for the Sensitivity Analysis of Multi-Criteria Decision Models. European Journal of Operational Research, 103, 531-546. http://dx.doi.org/10.1016/S0377-2217(96)00307-4