http://dx.doi.org/10.4236/abb.2015.64030
A New Method for Cardiac Diseases
Diagnosis
Ridha Ben Salah
1, Tareq Alhadidi
1, Sofienne Mansouri
2, Mounir Naouar
11College of Applied Medical Sciences, Department of Medical Equipment Technology, Prince Sattam Bin
Abdulaziz University, Al-Kharj, KSA
2Higher Institute of Medical Technologies of Tunis, Laboratory of Biophysics, University of Tunis El Manar,
Tunis, Tunisia
Email: istmtrbs@yahoo.fr
Received 22 March 2015; accepted 20 April 2015; published 24 April 2015
Copyright © 2015 by authors and Scientific Research Publishing Inc.
This work is licensed under the Creative Commons Attribution International License (CC BY).
http://creativecommons.org/licenses/by/4.0/
Abstract
The objective of this work is to perform automatic diagnosis using a non invasive method which consists on the bioimpedance signal processing. Bioimpedance signal (BIS) represents the aorta impedance variation during the heart cycle activity. BIS is detected by mean of two electrodes lo-cated at the level of the ascendant aorta. Automatic diagnosis method consists on preparing, first, a data base with a set of cepstral parameters of different BIS according to normal case and differ-ent cardiac diseases. This data base is composed from n classes Yk corresponding to n diseases. The classification of anonymous individuals is based on the determination of Fisher distance be-tween anonymous disease and class Yk using Fischer formula. Our method permits to calculate seven relevant cepstral parameters. The application of Fisher method has allowed us to perform the diagnosis of five anonymous cases. The major interest of this method is its especially useful for the exploration of cardiovascular system anomalies for emergency cases, children, elderly and pregnant women who can’t support surgical operations especially at the level of the heart.
Keywords
Signal Processing, Cepstral Parameters, Bioimpedance, Cardiac Diseases, Automatic Diagnosis
1. Introduction
tar-description of the bioimpedance method, then we describe the signals cepstral approach [8]. The method of dis-criminant analysis [8] will enable us to confirm the relevance of the cepstral parameters in the cardiovascular diseases diagnosis. Cepstral parameters will be used then for the automatic diagnosis.
2. Material and Method
2.1. Bioimpedance Method
The method used in this study consists of applying a low level rectangular current and high frequency (1 mA, 30 kHz), through a pair of electrodes placed respectively in the front and above the leading edge of the heart [12]-[15]. Another pair of electrodes, placed on the chest of the patient at the level of aorta 2 or 3 cm apart, per-mit perception of bioimpedance signal [BIS] representing impedance variation ∆Z of the explored thoracic re-gion. Figure 1, shows the electrode configuration for the measurement of the bioimpedance signal.
The aim of this bioimpedance signal analysis is the diagnosis of cardiac diseases by means of cepstral processing of this signal using Fisher theory [16]-[18].
2.2. Cepstral Analysis
Cepstral method consists on considering that bioimpedance signal y(t) is the response of left ventricle aorta sys-tem to a cardiac excitation signal x(t) and the aorta pulsatile response h(t) (Figure 2):
Then:
( )
( ) ( )
y t =x t ⋅h t (1)
(Temporal convolution product)
Cepstral analysis consists on the determination of excitation signal x(t) and pulsatile response h(t), in order to describe, separately, anomalies, respectively, in heart and aorta. Computation is carried out at the minimum phase (Φ = 0).
Let:
( )
(
( )
)
(
( ) ( )
)
1
Y f =FFT y t =FFT x t ⋅h t (2)
( )
(
( )
)
(
( )
)
( ) ( )
1
[image:2.595.157.493.447.718.2]Y f =FFT x t ⋅FFT h t =X f ⋅H f (3)
Figure 2. Cepstral model.
where:
( )
(
( )
)
X f =FFT x t (4)
( )
(
( )
)
H f =FFT h t (5)
( )
2( )
2( )
21
Y f = X f ⋅H f (6)
Let:
( )
( )
( )
( )
2 Ln 1 Ln Ln
Y f = Y f = X f + H f (7)
( )
1(
( )
)
( )
( )
1 2 1 1
y t =FFT− Y f =x t +h t (8)
y1(t) is the Cepstre C1 where:
( )
1(
( )
)
1 Ln
x t =FFT− X f (9)
( )
1(
( )
)
1 Ln
h t =FFT− H f (10)
Let:
( )
(
( )
)
1 1
X f =FFT x t (11)
( )
(
( )
)
1 1
H f =FFT h t (12)
( )
(
( )
)
1 Exp 1
X f = X f (13)
( )
(
( )
)
1 Exp 1
H f = H f (14)
Let:
( )
1(
( )
)
1 ˆ
x t =FFT− X f (15)
( )
ˆ
x t is the Cepstre C2
( )
1(
( )
)
1 ˆ
h t =FFT− H f (16)
( )
ˆh t is the Cepstre C3.
( )
ˆ
x t and h tˆ
( )
are considered as the original signal provided, respectively, by heart and aorta. Figure 3, shows the different steps of the cepstral algorithm.3. Result and Discussion
3.1. Temporal, Spectral and Cepstral Parameters
Early, a statistical study, using the discriminant method analysis, has been performed [17] [18]. This study con-sists to use 15 parameters: five temporal variables from bioimpedance signal and its derivative (A, C, O, X, S), 3 spectral parameters (r1, r2, r3) and seven cepstrals variables (U, M, N, F, I, G, LF) (Figure 4 and Figure 5) and (Table 1).
[image:3.595.71.546.82.588.2]Figure 3. Cepstral analysis.
Figure 4. Temporal parameters.
using Fisher’s test. Cesptres C2 and C3 permit to provide these seven relevant parameters: U, M, N, F, I, G, LF (Table 2).
3.2. Discriminant Analysis Method
The principle of discriminant analysis is based on FISCHER theory and the criteria of “Step by Step”. The rele-vant plethysmographic parameters represent the set of parameters which allows having the maximum of matrix product T−1 E. Where T is whole covariance matrix, E is the interclass covariance matrix. The classification of anonymous individuals is based on the use of the FISHER formula [16]:
(
, k) (
k)
cov(
k)
d a Y = a−y ′⋅T ⋅ a−y (17)
(
, k)
d a Y is the Fisher distance between an anonymous individual and class Yk, a is the anonymous individual
Figure 5. C2 and C3 cepstral parameters.
Table 1. Temporal, spectral and cepstral parameters.
Temporal parameters
A
Wave amplitude of the bioimpedance derivate signal C
O X
S Bioimpedance signal maximum amplitude
Spectral parameters
r1 Spectral parameters
harmonic amplitude fundamental amplitude
i
i r=
r2
r3
Cepstral parameters
U
Cepstral parameters
(cardiac excitation amplitude: cepstral C2) M
N F
Cepstral parameters
(impulsional response amplitude: cepstral C3) I
G
LF LF is the normalized width of wave F (aortic cepstral): =
L T ,
T is the cardiac period and L is the width of the wave F.
Table 2. Cepstral parameters.
Cepstral parameters U M N F I G LF
Number 1 2 3 4 5 6 7
Computed algorithms are expressed by a MAHAL 3 program [5]. The determination of the best discriminant parameters is carried out at each step from a basic sample (normal and cardiovascular diseases) with a dimen-sion N calculated as follows with an error risk of 5% [8] [17]:
2.25 8.7 25
represents the normalized width LF of the aortic cepstral. Therefore, the parameter number 7 is the best discri-minant plethismographic parameter. The best classified percentage of individual is then 64.29% (Table 3).
At steps number 2, 3 and 4, the program choose, respectively, parameters number 7, 5, 6 and 4 corresponding respectively to the parameters: LF, I, G and F. The classified percentage is then 86.01%. At step 5, the percen-tage of classification reaches 93.66% the parameters are 7, 5, 6, 4, and 3 corresponding to the parameters: LF, I, G, F and N. Finally at step number 6 and 7 the program choose parameters 2 and 1 corresponding to M and U respectively with the percentage 94.1% and 95.4%.
The total 7 independent parameters (Table 4), gives 99.4% degree of best classification. Therefore Bioim-pedance cepstral parameters with best discrimination are: 7(Lf), 5(I), 6(G), 4(F), 3(N), 6(M), and 7(U).
3.3. Automatic Diagnosis
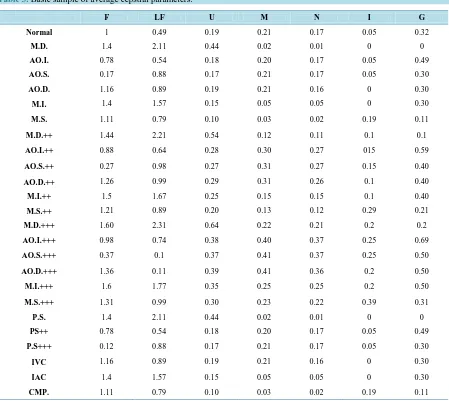
[image:6.595.89.538.297.698.2]Automatic diagnosis method consists on preparing, first, a data base with a set of the seven cepstral parameters
Table 3. Basic sample of average cepstral parameters.
F LF U M N I G
Normal 1 0.49 0.19 0.21 0.17 0.05 0.32
M.D. 1.4 2.11 0.44 0.02 0.01 0 0
AO.I. 0.78 0.54 0.18 0.20 0.17 0.05 0.49
AO.S. 0.17 0.88 0.17 0.21 0.17 0.05 0.30
AO.D. 1.16 0.89 0.19 0.21 0.16 0 0.30
M.I. 1.4 1.57 0.15 0.05 0.05 0 0.30
M.S. 1.11 0.79 0.10 0.03 0.02 0.19 0.11
M.D.++ 1.44 2.21 0.54 0.12 0.11 0.1 0.1
AO.I.++ 0.88 0.64 0.28 0.30 0.27 015 0.59
AO.S.++ 0.27 0.98 0.27 0.31 0.27 0.15 0.40
AO.D.++ 1.26 0.99 0.29 0.31 0.26 0.1 0.40
M.I.++ 1.5 1.67 0.25 0.15 0.15 0.1 0.40
M.S.++ 1.21 0.89 0.20 0.13 0.12 0.29 0.21
M.D.+++ 1.60 2.31 0.64 0.22 0.21 0.2 0.2
AO.I.+++ 0.98 0.74 0.38 0.40 0.37 0.25 0.69
AO.S.+++ 0.37 0.1 0.37 0.41 0.37 0.25 0.50
AO.D.+++ 1.36 0.11 0.39 0.41 0.36 0.2 0.50
M.I.+++ 1.6 1.77 0.35 0.25 0.25 0.2 0.50
M.S.+++ 1.31 0.99 0.30 0.23 0.22 0.39 0.31
P.S. 1.4 2.11 0.44 0.02 0.01 0 0
PS++ 0.78 0.54 0.18 0.20 0.17 0.05 0.49
P.S+++ 0.12 0.88 0.17 0.21 0.17 0.05 0.30
IVC 1.16 0.89 0.19 0.21 0.16 0 0.30
IAC 1.4 1.57 0.15 0.05 0.05 0 0.30
CMP. 1.11 0.79 0.10 0.03 0.02 0.19 0.11
of different bioimpedance signal according to different cardiac diseases and the formula (18). This data base is composed from n classes Yk corresponding to 25 cases (normal and cardiac disease).
The classification of anonymous individuals is based on the use of FISHER formula (8). Minimum dm dis-tance, between a and the Yk, classes provides the kind of cardiac disease. Investigation has concerned a data base of 25 kinds of signal: one normal and 24 pathological cases (Table 3). The number of cross indicates the severity of the disease.
[image:7.595.90.537.206.328.2]Three cases of anonymous signals are used (a1: AO.S+), (a2: M.S++) and (a3: M.S+++). The diagnosis of these three anonymous cases is confirmed by Echo-Doppler method. Table 5 shows affectation of these cases.
Table 4. Step by step analysis.
Steps Parameters Percentage
1 7 64.29%
2 7, 5 81.71%
3 7, 5, 6 83.52%
4 7, 5, 6, 4 86.01%
5 7, 8, 6, 4, 3 93.66%
6 7, 8, 6, 4, 3, 2 94.10%
7 7, 8, 6, 4, 3, 2, 1 95.40%
Table 5. Anonymous individual affection.
25 classes d(a1) d(a2) d(a3)
Normal 100 99.70 99.50
M.D.+ 55.30 66.23 62.39
AO.I.+ 22.23 77.32 88.36
AO.S.+ 0.10 55.11 55.22
AO.D.+ 12.22 53.78 45.36
M.I.+ 55.88 26.33 12.66
M.S.+ 77.23 2.22 1.33
M.D.++ 88.22 44.23 23.78
AO.I.++ 55.99 88.66 88.77
AO.S.++ 2.33 55.88 77.11
AO.D.++ 4.66 69.58 88.55
M.I.++ 54.99 22.30 22.99
M.S.++ 55.21 0.10 1.59
M.D.+++ 88.22 3.44 6.33
AO.I.+++ 5.99 88.66 66.77
AO.S.+++ 3..66 55.66 44.45
AO.D.+++ 5.55 55.77 64.23
M.I.+++ 45.66 28.99 34.54
M.S.+++ 55.22 2.99 0.02
P.S. 77.32 54.88 88.52
PS++ 75.41 55.66 66.25
P.S+++ 88.23 74.36 67.99
IVC 90.23 95.24 89.99
IAC 79.99 92.32 88.99
[image:7.595.86.537.325.721.2]previous work using 15 bioimpedance parameters: 94.64% of percentage of correctly classified.
The results found in this work indicate that the seven cepstral parameters defined above are sufficient to per-form the automatic diagnosis of the cardiovascular system abnormalities.
The effectiveness of the cepstral parameters classification is confirmed by the exact allocation of 3 anonym-ous individuals. Indeed our results demonstrate that patients a1, a2, a3 have been allocated respectively to the previous classes: AO.S+ (d = 0.1), M.S.++ (d = 0.1), and D.M.+++ (d = 0.02).
4. Conclusion
Automatic quantification of cardiac diseases has been carried out using discriminant analysis method based on the processing of bioimpedance signal. The discrimination uses analysis of seven cepstral parameters. Classifi- cation has been performed using e fundamental data base composed of 25 classes (one normal and 24 cases of diseases). “Step by step” method gives an excellent degree of discrimination 954%. The intelligent method per-formed in this study permits to confirm the classification of three anonymous patients. Quantification results obtained by the bioimpedance signals analysis are confirmed by those obtained with Echo-Doppler method. Re-searches are actually orientated for the investigation of peripheral cardiovascular system with the use of hemo-dynamic bioimpedance and ECG parameters.
References
[1] Yan, J.Y., Lu, Y., Liu, J. and Wu, X.Y. (2010) Intelligent Diagnosis of Cardiovascular Diseases Utilizing ECG Signals.
International Journal of Information Acquisition, 07, 81. http://dx.doi.org/10.1142/S0219878910002087
[2] Kumaravel, N., Sridhar, K.S. and Nithiyanandam, N. (1996) Automatic Diagnosis of Heart Diseases Using Neural Net- work. Biomedical Engineering Conference, Dayton, 29-31 March 1996, 319-322.
http://dx.doi.org/10.1109/SBEC.1996.493214
[3] Hong, B., Kai, J., Ren, Y., Han, J., Zou, Z., Ahn, C.H. and Kang, K.A. (2008) Highly Sensitive Rapid, Reliable, and Automatic Cardiovascular Disease Diagnosis with Nanoparticle Fluorescence Enhancer and Mems. Advances in Expe-rimental Medicine and Biology, 614, 265-273. http://dx.doi.org/10.1007/978-0-387-74911-2_30
[4] Scherhag, A.W., et al. (2013) Continuous Measurement of Hemodynamic Alterations during Pharmacologic Cardi-ovascular Stress Using Automated Impedance Cardiography. The Journal of Clinical Pharmacology, 37, 21S-28S. [5] Fortin, J., et al. (2006) Non-Invasive Beat-To-Beat Cardiac Output Monitoring by an Improved Method of
Transtho-racic Bioimpedance Measurement. Computers in Biology and Medicine, 36, 1185-1203.
http://dx.doi.org/10.1016/j.compbiomed.2005.06.001
[6] Kubicek, W.G., Karnegis, J.N., Patterson, R.P., Witsoe, D.A. and Mattson, R.H. (1966) Development and Evaluation of an Impedance Cardiac Output System. Aerospace Medicine, 37, 1208-1212.
[7] Bizouarn, P., Blanloeil, Y. and De La Coussaye, J.E. (1996) Conférences d’actualisation “Méthodes de mesure du débit cardiaque en réanimation”. Elsevier, Paris, et Société Française d’Anesthésie et de Réanimation (SFAR), 377-398. [8] Ben Salah, R. (1988) Pléthysmographie électrique thoracique localisée. Application à la détermination des paramètres
cardiovasculaires et au diagnostic des cardiopathies. Ph.D. Faculté des sciences de Tunis.
[9] Chemam, M.N. (1983) Analyse automatique des signaux pléthysmographiques. Application à la mesure du débit sanguin et à la reconnaissance des cardiopathies. Ph.D. Dissetation, ENIT, Tunis.
[10] Collete, M., Leftheriotis, G. and Humeau, A. (2009) Modeling and Interpretation of the Bioelectrical Impedance Signal for the Determination of the Local Arterial Stiffness. Medical Physics, 36, 4340-4348.
http://dx.doi.org/10.1118/1.3213084
[11] Ivorra, A. (2002) Bioimpédance Monitoring for Physicians: An Overview. Centre Nacional de Microelectrònica, Bar-celona, Spain.
[12] Kubicek, W.G., Patterson, R.P. and Witsoe, D.A. (1970) Impedance Cardiography as a Non Invasive Method of Mon-itoring Cardiac Function and Other Parameters of the Cardiovascular System. Annals of the N. Y. Academy of Sciences,
170, 724-732. http://dx.doi.org/10.1111/j.1749-6632.1970.tb17735.x
Bio-Impedance Signal. Journal of Biophysics and Structural Biology, 2, 009-015.
[14] Mansouri, S., Mahjoubi, H. and Ben Salah, R. (2009) FPGA-Based Derivative Module for Bioimpedance Signal. In-ternationalJournal of Computer Science and Network Security, 9, 16-20.
[15] Mansouri, S. (2011) Conception d’un système de détermination non invasive des paramètres biorhéologiques cardiova- sculaire par la méthode de bioimpédance périphérique. Ph.D. Faculté des sciences de Tunis.
[16] Romeder, J.M. (1973) Méthode et programme d’analyse discriminante, Dunod.
[17] Ben Salah, R., et al. (1988) Temporal, Spectral and Cepstral Analysis of Plethysmographic Signal. Application to Au-tomatic Diagnosis of Cardiac Diseases. Signal Processing IV. Thories and Applications. Elsevier Science Publishers B. V., North Holland.