© 2017, IRJET | Impact Factor value: 5.181 | ISO 9001:2008 Certified Journal | Page 1094
Comparision of Base Shear Capacity of RC Frame By IDA And SPA
Vinod Tiwari
1, Dr. Ashok Kasnale
21
PG student,Department of Civil Engineering Dr. D. Y. Patil School of Engineering& Technology, Pune-412105,India
2Principal, Dr. D. Y. Patil School of Engineering& Technology, Pune-412105,India
---***---Abstract -
Structures subjected to force like earthquakemust be resisted by structure as they are dynamic in nature. It causes unsafe condition. Performance based analysis of structure is required. This can be achieved by incremental dynamic analysis (IDA) which can be done by SAP ( static pushover analysis) but in Incremental Dynamic analysis is more accurate. Incremental dynamic analysis involves different intensity of ground motion which is selected for complete collapse. In present work increment dynamic analysis of reinforced concrete G+ 7 and G+ 11 building is carried out buildings susceptible is check, inter story drift ratio from IS 1893 : 2002 is checked. Basic base shear capacity of G+ 7 and G+ 11 are calculated base shear curve of top displacement is compared with SPA (static pushover analysis).pushover analysis is of two types Force control and displacement control. Force control in which lateral loads are applied in small increment. Distance by which structure is proportional to horizontal translation.This paper deals with the Incremental Dynamic analysis of G+7 and G+11 building.
Key Words: IDA; SAP; Earthquake analysis
1. INTRODUCTION
In this chapter, building capacity is found out by using both incremental dynamic analysis and static pushover analysis. Graph of base shear to top displacement from incremental dynamic analysis is compared with that of static pushover analysis. Capacity base shear from both the methods are compared for G+7 and G+11 building.
1.1 Methodology
We have applied number of time histories to the structure and their acceleration data points are scaled from zero up to up to collapse of the structure. For every scaling factor of every time history data, base shear and top displacement are found out and graph of base shear to top displacement is plotted for earthquake in X and Y direction. From the IDA curve, we have calculated the yield and collapse stages of the structure with respect to peak ground acceleration. Base shear at yield acceleration will be base shear at yielding stage of the structure and base shear atcollapse acceleration will be a base shear at collapse stage of the structure. Then the base shear to top displacement graph for every time history is combined into one generalized graph for both the direction. In this way, final collapse base shear of the structure by incremental dynamic analysis is found out.
1.2. Incremental Dynamic Analysis of G+7 Building
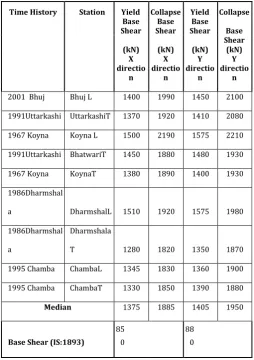
Above procedure is followed to find out the collapse base shear of G+7 building by using incremental dynamic analysis. Table 1 shows the yield and collapse base shear of G+7 building from incremental dynamic analysis
It is observed that yield and collapse base shear both are more than designed base shear which indicates that building can retain more shear force than the shear for which building was actually designed for. Figure 6.1 shows the base shear response of the building for various time histories.
.Table : 1 Yield and collapse base shearG+7 Building
Time History Station Yield Collapse Yield Collapse Base
Shear Shear Base Shear Base Base
(kN) (kN) (kN)
Shear (kN) X directio n X directio n Y directio n Y directio n
2001 Bhuj Bhuj L 1400 1990 1450 2100
1991Uttarkashi UttarkashiT 1370 1920 1410 2080
1967 Koyna Koyna L 1500 2190 1575 2210
1991Uttarkashi BhatwariT 1450 1880 1480 1930
1967 Koyna KoynaT 1380 1890 1400 1930
1986Dharmshal
a DharmshalL 1510 1920 1575 1980
1986Dharmshal
a
Dharmshala
T 1280 1820 1350 1870
1995 Chamba ChambaL 1345 1830 1360 1900
1995 Chamba ChambaT 1330 1850 1390 1880
Median 1375 1885 1405 1950
Base Shear (IS:1893)
85 0
88 0
[image:1.595.307.562.379.740.2]© 2017, IRJET | Impact Factor value: 5.181 | ISO 9001:2008 Certified Journal | Page 1095
2. Building Plan
Fig1: Plan of building G+7
Fig2 ETABS model
Fig 3: SeismoStructmodel of G+7 Building
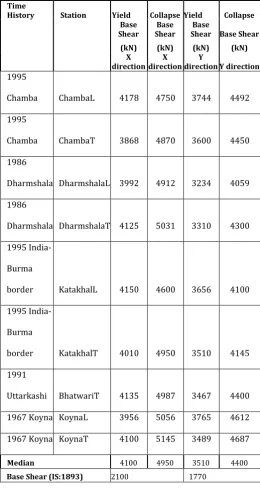
2. Incremental Dynamic Analysis of G+11
building
[image:2.595.47.556.46.763.2]To calculate the base shear capacity of G+11 building, same procedure is followed as that for G+7 building. Table 2 shows the yield and collapse base shear of G+11 building .
[image:2.595.64.556.357.725.2]© 2017, IRJET | Impact Factor value: 5.181 | ISO 9001:2008 Certified Journal | Page 1096 Fig5: ETABS model of G+11 building
[image:3.595.308.569.121.613.2]Fig 6: SeismoStructModel of the building of G+11 building
Table: 2 Yield and collapse base shear of G+11 building
Time
History Station Yield Collapse Yield Collapse Base
Shear Shear Base Shear Base Shear Base (kN) (kN) (kN) (kN)
X
direction direction X direction Y direction Y
1995
Chamba ChambaL 4178 4750 3744 4492
1995
Chamba ChambaT 3868 4870 3600 4450
1986
Dharmshala DharmshalaL 3992 4912 3234 4059
1986
Dharmshala DharmshalaT 4125 5031 3310 4300
1995
India-Burma
border KatakhalL 4150 4600 3656 4100
1995
India-Burma
border KatakhalT 4010 4950 3510 4145
1991
Uttarkashi BhatwariT 4135 4987 3467 4400
1967 Koyna KoynaL 3956 5056 3765 4612
1967 Koyna KoynaT 4100 5145 3489 4687
Median 4100 4950 3510 4400
Base Shear (IS:1893) 2100 1770
3. Static Pushover Methodology
© 2017, IRJET | Impact Factor value: 5.181 | ISO 9001:2008 Certified Journal | Page 1097 analysis is the ability to assess seismic demands and
capacities with a reasonable degree of certainty.
Capacity: The overall capacity of a structure depends on the strength and deformation capacity of the individual components of the structure. In order to determine the capacities beyond elastic limits, some form of nonlinear analysis, such as the pushover procedure, is required. This procedure uses a series of sequential elastic analysis, superimposed to approximate a force displacement capacity diagram of the overall structure. A lateral force distribution is again applied until additional components yield. This process is continued until the structure becomes unstable or until a predetermined limit is reached.
Demand: Ground motion during an earthquake produces complex horizontal displacementpatterns in the structures. It is impractical to trace this lateral displacement at each time-step to determine the structural design parameters. The traditional design methods use equivalent lateral forces to represent the design condition. For nonlinear methods it is easier and more direct to use a set of lateral displacements as the design condition. For a given structure and ground motion, the displacement demand is an estimate of the maximum expected response of the building during the ground motion. Once, a capacity curve and demand displacement, are defined, a performance check can be done. 4. Comparison between Incremental Dynamic
Analysis (IDA) and Static Pushover Analysis (SPA).
Base shear capacity from incremental dynamic analysis is compared with that of static pushover analysis of both the G+7 and G+11 building.Table 3:
Collapse base shear capacity (kN)
Building Collapse base shear (kN) Collapse base shear (kN) X
direction direction Y
IDA SPA
Base Shear
IDA SPA
Base Shear
(IS: 1893) (IS: 1893)
G+7 1885 2200 850 1950 2300 880
G+11
4950 5640 2100 4400 5200 1770
Building base shear capacity by both the methods is more than base shear for which the building was actually designed as per the load combinations given in IS 1893: 2000.Base shear capacity by IDA method is observed to be lesser than that of SPA method
.
5. Future Scope
In this work, different earthquakes are applied to building, earthquake data is incremented and response of building is plotted at each time. Yielding and collapse stages of the building are plotted with respect to peak ground acceleration of the considered earthquake.For the building location considering zone of earthquake, time histories should be selected and response spectrum curve should be plotted for each time history. Now, this curve can be incremented and response can be studied. Yielding and collapse stages to be plotted will be with respect to spectral acceleration. Demand curve and capacity curve can be plotted and performance point can be identified for various time histories by incremental dynamic analysis. Same curve can be plotted by static pushover analysis and compared with that of IDA. In this way, building capacity can be found out using both the methods
Conclusion
Static pushover analysis gives higher values of base shear than from incremental dynamic analysis. Incremental dynamic analysis is tedious and very much time consuming, if the structure is of much importance and high accuracy is needed, then only incremental dynamic analysis is preferred.
Acknowledgement
This work is synergetic product of many minds. I am Grateful for the inspiration and wisdom of many thinkers and for the trans-generational sources and the roots. I hereby take this opportunity to express my profound gratitude and deep regards to my guide Dr. Ashok Kasnale
Principal DYPSOET and staff for their exemplary guidance, monitoring and constant encouragement throughout the course of this work.
References
1. Camilleri M. (2010) “Structural Analysis” Nova Science Publishes, New York
2. Dolsek M. (2009) “Incremental dynamic analysis with consideration of modelling uncertainties” Earthquake Engineering and Structural Dynamics, 38(6), 805-825.
3. FEMA P-58-1, Volume 1– Methodology (2012) “Seismic Performance Assessment of Buildings”.
4. FEMA P-58-2, Volume 2– Implementation Guide (2012) “Seismic Performance Assessment of Building”
© 2017, IRJET | Impact Factor value: 5.181 | ISO 9001:2008 Certified Journal | Page 1098 4. Somes, N.F. and Corley, W.G. (1974). Circular openings in
webs of continuous beams Shear in Reinforced Concrete, special Publication SP-42, American Concrete Institute, Detroit, 359-398.
5. IS 1893:2002.’Seismic Analysis” -Code of practice.’
6. IS 456:2000.’Plain and Reinforced concrete-Code ofpractice.’
BIOGRAPHIES
Vinod Tiwari(ME 2nd Year Student)
Department of Civil Engineering Dr. D. Y. Patil School of Engineering& TechnologyDr. D. Y. Patil School of Engineering& Technology.
Dr. Ashok Kasnale(Guide & Principal) Department of Civil Engineering Dr. D. Y. Patil School of Engineering& TechnologyDr. D. Y. Patil School of Engineering& Technology