How to cite this paper: Al-Salim, S.H.F., Al-Edelbi, R., Aljbory, F. and Saleh, M.M. (2016) Evaluation of the Performance of Some Rice (Oryza sativa L.) Varieties in Two Different Environments. Open Access Library Journal, 3: e2294.
http://dx.doi.org/10.4236/oalib.1102294
Evaluation of the Performance of Some Rice
(
Oryza sativa
L.) Varieties in Two Different
Environments
Salih Hadi Farhood Al-Salim
1, Reem Al-Edelbi
2, Falah Aljbory
3, Maysoun Mohamed Saleh
31Ministry of Agriculture, Agriculture Directorate of Dhi-Qar, Al-Nassiriya, Iraq 2Faculty of Agriculture, Damascus University, Damascus, Syria
3General Commission for Scientific Agricultural Research (GCSAR), Damascus, Syria
Received 7 January 2016; accepted 22 January 2016; published 25 January 2016
Copyright © 2016 by authors and OALib.
This work is licensed under the Creative Commons Attribution International License (CC BY).
http://creativecommons.org/licenses/by/4.0/
Abstract
A field experiment was carried out in Iraq, during the season 2014, in order to evaluate the per-formance of different ten genotypes of bread rice under irrigated field conditions, according to the design of randomized complete block with three replications (5 var × 2 sites × 3 rep). The results indicated the existence of genetic variability, in a significant manner (at the level 5%). Responses of the studied genotypes to the conditions of the field for all of the traits are such as Plant height (cm), Panicle length (cm), Number of grains per plant, 1000-grains weight (g), Number of tillers per plant, Number of productive tillers per plant and grain yield (g∙m−2). The site Al-Mishkab was lower in Grain yield than the site Dhi-Qar. The general mean over locations revealed that Yasmeen was the best with the highest grain yield (71.2 g∙m−2) followed by Mishkab (641.3 g∙m−2). The study showed the importance of the Panicle Length due to its positive and high significant correla-tion with the grain yield (0.544**), so it can be used as indicator of suitable selection for the devel-opment of high-yielding genotypes. Results also showed that correlation between grain yield and plant height was negative and significant (−0.830**).
Keywords
Rice, Genotypes, Correlation, Grain Yield
Subject Areas: Agricultural Science
1. Introduction
OALibJ | DOI:10.4236/oalib.1102294 2 January 2016 | Volume 3 | e2294
the world’s rice is grown in the Asian continent and constitutes a staple food for 2.7 billion people worldwide [3] [4]. The world’s rice production has doubled during the last 25 years, largely due to the use of improved tech-nology such as high yielding varieties and better crop management practices [5].
In rice breeding, improvement of yield is always one of the most important objectives for breeders. Therefore, many studies have focused on the improvement and inheritance of agronomically important yield-related traits for achieving higher yield [6]. Variation for a given agronomic trait is not only determined by the variety, but also affected by environment and variety × environment (G × E) effects. [7] have studied Variety × environment interactions (GEI) in rice (Oryza sativa). GEI results from a change in the relative rank of variety performance or a change in the magnitude of differences between variety performance from one environment to another. GEI affects breeding progress because it complicates the demonstration of superiority of any variety across environ-ments and the selection of superior varieties [8]. Therefore, the magnitude and nature of GEI determine the fea-tures of a selection and testing program. Varieties × environment interactions reveal the need for development of varieties that should be tested and selected for specific growing environments [9]. Often, plant breeders want to develop broadly-adapted varieties for a wide range of environments. However, it is often not possible to identify varieties that are superior in yield and yield components in all environments. Furthermore, the same genetic sys-tem may not control yield over a diverse set of environments [10]. Therefore, breeders often develop varieties for a particular environment to take advantage of specific adaptations [11][12].
Grain yield (GY) in cereals is one of the most important and complex traits in plant breeding experiments. Continued improvement of GY remains the top priority in most of the breeding programs [13].
In rice, GY depends on various growth and component traits, and is the final outcome of a combination of different yield components, such as the Panicle number per plant, the filled grain number per Panicle, and the weight per grain [14]. Grain yield of rice is determined by sink size (Paniclelets per unit land area), Paniclelet filling percentage and grain weight. Sink size is considered as the primary determinant of the rice yield, and it can be increased either by increasing Panicle number or Panicle size (Paniclelets per Panicle) or both [15][16].
Yield is a complex quantitative character and is greatly influenced by environmental fluctuations; hence, the selection for superior varieties based on yield per se at a single location in a year may not be very effective. Thus, evaluation of varieties for stability of performance under varying environmental conditions for yield has become an essential part of any breeding programme. An understanding of the causes of variety × environment interaction can help in identifying traits and environments for better cultivar evaluation.
The success of any plant breeding program depends on many factors; one of the most important factors is the understanding and selection of suitable test locations [17]. An efficient test location is discriminating, so that differences among varieties can be easily detected using few replications, and is representative of the target en-vironments for the cultivars to be released. The representation of the location for the target environment should be repeatable so that varieties selected in each year will have superior performance in future years [17]. There-fore, knowledge of target environment for breeding for locally adapted variety is important and, also, it requires a subdivision of the target locations into mega-environments.
The objectives of this research were to 1) investigate the performance of the several Iraqi rice varieties under different environments (DHi -Qar and AL-Mishkab) by defining the difference in the morphological and quan-tity traits between the studied varieties, 2) evaluate the influence of variety, environment and variety × environ-ment interaction on yield of rice varieties, 3) to estimate the correlation between studied traits to identify the best varieties to be exploited in breeding programs.
2. Materials and Methods
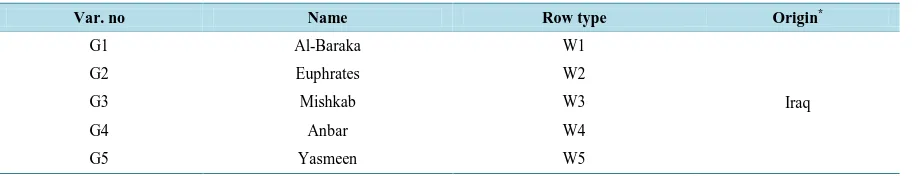
The field experiments were conducted at two environmental sites: The first one, a farm in the province of Dhi-Qar which far away about 26 km from Southern west of AL-Nasiriyah city. The second one, the rice re-search station of Agricultural Rere-search Centerin Mishkab region in Al-Najav province during the summer sea-son 2014 to evaluate five diverse Iraqi rice (Oryza sativa L.) varieties which were planted under well-watered con-ditions. They are: Mishkab, Euphrates, Anbar, Yasmeen and Al-Baraka. Seeds were obtained from the Gene-Bank of the Rice Research Station in Mishkab of the Office of Agricultural Research/the Ministry of Agriculture in Iraq. The tested varietiesused in this study are presented in Table 1.
OALibJ | DOI:10.4236/oalib.1102294 3 January 2016 | Volume 3 | e2294 Table 1.List of studied rice varieties with their origin.
Var. no Name Row type Origin*
G1 Al-Baraka W1
Iraq
G2 Euphrates W2
G3 Mishkab W3
G4 Anbar W4
G5 Yasmeen W5
*Ministry of agriculture/directorate of search agricultural/rice research station in Mishkab.
follows: Plant Height (PH) in (cm); Panicle Length(PL) in (cm), number of grains per plant(NG), 1000-grains weight (TGW) in (g) measured after final harvest of the plots, Number of tillers per plant (NT); number of pro-ductive tillers per plant(NPT), and grain yield (GY) in(g∙m−2).
3. Experimental Design
The experiment was laid out in a Randomized Complete Block Design (RCBD) with three replications. In each replication each variety was grown in a plot of 6 rows with a distance of 20 cm between two rows and the area of each experimental unit was 6 m2. The recommended agronomical practices were followed to raise good crop in the season. The soil was fertilized by the composite fertile (100 kg∙ha−1) which was added at once through the tillage and Urea was used (46% N) at a rate of 150 kg∙N∙ha−1 in two equal doses; the first dose was applied through sowing and the second dose at thirty days after planting.
Soil samples were taken from depth 0 - 20 cm. The physico-chemical properties of the soil in the two differ-ent sites are presdiffer-ented in Table 2.
4. Statistical Analysis
The analysis of variance (ANOVA) for the data collected for growth, yield and yield components was conducted by Genstat.7, While Correlation coefficients between each pairs of traits computed by SPSS.17). Means were
se-parated using Fisher LSD.
5. Results and Discussions
Analysis of variance (ANOVA) results for 7 studied traits revealed significant differences among varieties and environments (Table 3). The variety variance was highly significant at levels (P ≤ 0.001) and (P ≤ 0.01). Highly
significant mean squares (P ≤ 0.001) due to variety × environment (V × E) interaction for plant height (PH) and
grain yield (GY) which revealed that the varieties interacted considerably with environmental conditions, but the environment variance for some traits such as Panicle Length (PL), Number of Grains per plant (NG) and 1000-grains weight (TGW) were insignificant (Table 3).
The tallest rice variety was Anbar at the both of sites Dhi-Qar and AL-Mishkab (145.33, 144.00 cm) respec-tively. While the lowest one was Mishkab at the both of sites (91.33, 98.67 cm) respectively and the mean plant height was (114.60 cm) at Dhi-Qar and (125.47 cm) at AL-Mishkab.
Variety Yasmeen displayed the highest Panicle length (28.67, 29 cm) at Dhi-Qar and AL-Mishkab respec-tively. while variety Al-Baraka and Anbar showed lower Panicle length (25.67, 24.67 cm) at the both of sites respectively and the mean Panicle length was 26.57 cm under irrigated condition (Table 4). The difference in the length trait among studied varieties perhaps because of the genetic variability [18].
OALibJ | DOI:10.4236/oalib.1102294 4 January 2016 | Volume 3 | e2294 Table 2. The physico-chemical properties of the site soil.
Ions% Components
EC des/m PH Soil Type Traits
Site
P K N Clay Silt Sand
0.52 1.14 0.61 31 46 23 3.61 7.6 Loamy Clay Dhi-Qar*
0.41 1.02 0.54 31 51 18 3.23 7.2 Loamy Clay Al-Najav*
*
[image:4.595.88.543.379.498.2]These results were taken in Labor of water and soil in Agriculture Directorate of Dhi-Qar.
Table 3.ANOVA (mean square and L.S.D at 0.05) for different traits.
Source D.f Mean Sum of Square
PH PL NG TGW NT NPT GY
V 4 2302.37*** 17.550** 198454*** 12.050*** 5976** 5776** 73891***
E 1 885.63*** 1.633 27908 0.033 8367* 10491** 28398***
V × E 4 242.80*** 4.217 7941 6.783** 1042 1159 12680***
L.S.D V 4.360 2.128 188.5 1.478 41.79 41.33 47.25
L.S.D E 2.758 1.346 119.2 0.935 26.43 26.14 29.88
L.S.D V × E 6.166 3.009 266.6 2.091 59.10 58.45 66.82
C.V% 3.0 6.6 9.8 5.6 11.9 11.9 6.8
*, **, *** indicate significances at the 0.05, 0.01 and 0.001 levels respectively. V : Variety; E: Environment; DF, Degree of freedom; PH: plant height, PL: Panicle Length, NG: Number of Grains per Plant, TGW: 1000-grains weight, NT: Number of Tillers per plant, NPT: Number of Productive Til-lers per plant, GY: grain yield.
Table 4. Analysis of variance of studied traits in irrigated condition.
Trait PH
Mean PL Mean NG Mean
Var E1 E2 E1 E2 E1 E2
Al-Baraka 133.67b 135.00b B 134.33 25.33 26.00 25.67 C 1710 1726 A 1718
Euphrates 104.00c d 121.33 C 112.67 29.33 26.33 27.83 Ab 1871 1693 A 1782
Mishkab 91.33e 98.67e D 95.00 25.33 26.33 25.83 Bc 1627 1606 AB 1616
Anbar 145.33a 144.00a A 144.67 25.33 24.00 24.67 C 1470 1414 Bc 1442
Yasmeen 98.67d 128.33c C 113.50 28.67 29.00 28.83A 1385 1318 C 1352
Mean 114.60 125.47 120.03 26.80 26.33 26.57 1613 1552 1582
KEY: PH: plant height, PL: Panicle Length, NG: Number of Grains per plant, GY: grain yield. E1: Dhi-Qar E2: AL-Mishkab.
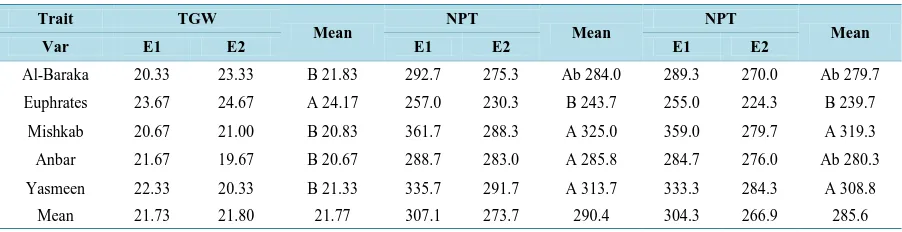
Table 5. Analysis of variance of studied traits in irrigated condition.
Trait TGW
Mean NPT Mean NPT Mean
Var E1 E2 E1 E2 E1 E2
Al-Baraka 20.33 23.33 B 21.83 292.7 275.3 Ab 284.0 289.3 270.0 Ab 279.7
Euphrates 23.67 24.67 A 24.17 257.0 230.3 B 243.7 255.0 224.3 B 239.7
Mishkab 20.67 21.00 B 20.83 361.7 288.3 A 325.0 359.0 279.7 A 319.3
Anbar 21.67 19.67 B 20.67 288.7 283.0 A 285.8 284.7 276.0 Ab 280.3
Yasmeen 22.33 20.33 B 21.33 335.7 291.7 A 313.7 333.3 284.3 A 308.8
Mean 21.73 21.80 21.77 307.1 273.7 290.4 304.3 266.9 285.6
KEY: TGW: 1000-grains weight, NT: Number of Tillers per plant, NPT: Number of Productive Tillers per plant, E1: Dhi-Qar E2: AL-Mishkab.
[image:4.595.87.538.536.652.2]OALibJ | DOI:10.4236/oalib.1102294 5 January 2016 | Volume 3 | e2294
The grain yield of rice fluctuates considerably with the change in environmental conditions. Hence, partition-ing of variety × environment interaction revealed highly significant difference and these are very important for determining V × E interaction. A significant V × E interaction indicated a considerable interaction of varieties with environmental conditions that existed at different locations of Iraq. These results were in conformity with reports on rice [19][20].
6. Correlation Analysis
Yield is a complex trait controlled by many genes. The knowledge about relationship between yield and its con-tributing characters is needed for an efficient selection strategy.
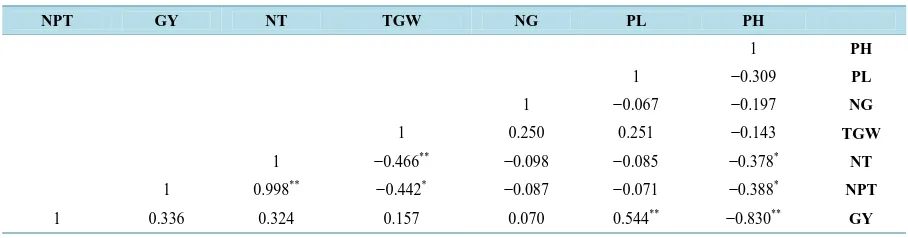
The correlation coefficients among studied traits in two different sites are listed in Table 7. In the present study Panicle length showed highly significant positive correlation with grain yield (0.544**). Number of Grains per plant, 1000-grains weight, number of productive tillers per plant and Number of Tillers per plant related po-sitively and insignificant with grain yield. Whereas there was a highly significant negative correlation among grain yield with plant height. These results did not match the findings of [21]-[24] who reported significant cor-relation of grain yield per plant with plant height. That indicates to the effect of genetic variation and environ-mental factors on grain yield and food production in different sites and genotypes.
Plant height revealed significant and highly significant negative correlations to all traits such as panicle length, number of tillers per plant and number of productive tillers per plant. These findings are in disagreement with the findings of [25]. Number of grains per plant showed insignificant positively association with 1000-grains weight. Similar findings were reported by [6][26] and [27]. Negative correlation with Number of Grains per plant and Panicle length. [28] reported similar results in their experiment during 1995. There was positive and high significant correlation between number of tillers per plant and number of productive tillers per plant (0.998**), Whereas there were negative and significant associations were recorded for number of Productive til-lers per plant with plant height and 1000-grains weight (−0.388*, −0.442*), similar to the results of [25].
[image:5.595.87.538.426.544.2]Grain yield per plant was observed to be positively and significantly associated with Panicle Length and posi-tively with1000-grains weight, Number of Tillers per plant and number of Productive tillers per plant, indicating
Table 6. Analysis of variance of grain yield in irrigated condition.
Trait GY
Mean
Var. E1 E2
Al-Baraka 442.3 506.3 C 474.3
Euphrates 694.0 536.7 B 615.3
Mishkab 721.0 584.7 Ab 652.8
Anbar 432.7 427.3 C 430.0
Yasmeen 714.0 641.3 A 677.7
Mean 600.8 539.3 C 474.3
GY: grain yield. E1: Dhi-Qar, E2: AL-Mishkab.
Table 7. Simple Correlation coefficients between studied traits in rice varieties in both sites.
PH PL NG TGW NT GY NPT PH 1 PL −0.309 1 NG −0.197 −0.067 1 TGW −0.143 0.251 0.250 1 NT −0.378* −0.085 −0.098 −0.466** 1 NPT −0.388* −0.071 −0.087 −0.442* 0.998** 1 GY −0.830** 0.544** 0.070 0.157 0.324 0.336 1
[image:5.595.85.539.582.701.2]OALibJ | DOI:10.4236/oalib.1102294 6 January 2016 | Volume 3 | e2294
the importance of Panicle Length as selection critera in yield enhancement programs. The results are in line with the findings of [29].
7. Conclusion
The present study provided an evaluation of genotypic and environmental performance of five varieties over tow environments. Significant differences among the varieties and environments for yield trait suggested the pres-ence of wide variability. Significant differpres-ences among the varieties and environment for yield trait suggested the presence of wide variability. Both components of varieties × environment interaction were significant.
References
[1] Emani, C., Jiang, Y., Miro, B., Hall, T.C. and Kohli, A. (2008) Transgenic Cereals and Forage Grasses. In: Kole, C. and Hall, T.C., Eds., Compendium of Transgenic Crop Plants, 1-234.
[2] Jiang, S.H., Zhou, H., Lin, D.Z., Dong, Y.J., Ye, S.H. and Zhang, X.M. (2013) Identification and Gene Mapping of a Thermo-Sensitive Leaf-Color Mutant at Seedling Stage in Rice. Chinese Journal of Rice Science, 27, 359-364. [3] Salim, M., Akram, M., Akhtar, M.E. and Ashraf, M. (2003) Rice, A Production Hand Book. Pakistan Agricultural
Re-search Council, Islamabad, 70.
[4] Paranthaman, R., Alagusundaram, K. and Indhumathi, J. (2009) Production of Protease from Rice Mill Wastes by
As-pergillus niger in Solid State Fermentation. World Journal of Agricultural Sciences, 5, 308-312.
[5] Byerlee, D. (1996) Knowledge-Intensive Crop Management Technologies: Concepts, Impacts, and Prospects in Asian Agriculture. International Rice Research Conference, Bangkok, 3-5 June 1996.
[6] Samonte, S.O.P.B., Wilson, L.T. and McClung, A.M. (1998) Path Analyses of Yield and Yield-Related Traits of Fif-teen Diverse Rice Genotypes. Crop Science, 38, 1130-1136.
http://dx.doi.org/10.2135/cropsci1998.0011183X003800050004x
[7] Haryanto, T.A.D., Suwarto and Yoshida, T. (2008) Yield Stability of Aromatic Upland Rice with High Yield Ability in Indonesia. Plant Production Science, 11, 96-103. http://dx.doi.org/10.1626/pps.11.96
[8] Ebdon, J.S. and Gauch Jr., H.G. (2002) Additive Main Effect and Multiplicative Interaction Analysis of National Turfgrass Performance Trials: I. Interpretation of Genotype 3 Environment Interaction. Crop Science, 42, 489-496.
http://dx.doi.org/10.2135/cropsci2002.0489
[9] Fehr, R.F. (1987) Genotype × Environment Interaction. Principles of CultivarDevelopment, Vol. 1, MacMillan Pub-lishing Company, New York, 525 p.
[10] Ceccarelli, S. and Grando, S. (1993) From Conventional Plant Breeding to Molecular Biology. In: Buxton, D.R., et al., Eds., International Crop Science I, CSSA, Madison, 533-537.
[11] Annicchiarico, P. (2002) Genotype × Environment Interactions: Challenges and Opportunities for Plant Breeding and Cultivar Recommendations. FAO Plant Production and Protection Paper No. 174, FAO, Rome.
[12] Samonte, S.O., Wilson, L.T., McClung, A.M. and Medley, J.C. (2005) Targeting Cultivars onto Rice Growing Envi-ronments Using AMMI and SREG GGE Biplot Analyses. Crop Science, 45, 2414-2424.
http://dx.doi.org/10.2135/cropsci2004.0627
[13] Yan, W., Hunt, L.A., Johnson, P., Stewart, G. and Lu, X. (2002) On-Farm Strip Trials vs Replicated Performance Tri-als for Cultivar Evaluation. Crop Science, 42, 385-392. http://dx.doi.org/10.2135/cropsci2002.0385
[14] Yoshida, S (1983) Rice. In: Smith, W.H. and Banta, S.J., Eds., Potential Productivity of Field Crops under Different
Environments, International Rice Research Institute, Los Baños, 103-127.
[15] Kropff, M.J., Cassman, K.G., Peng, S., Matthews, R.B. and Setter, T.L. (1994) Quantitative Understanding of Yield Potential. In: Cassman, K.G., Ed., Breaking the Yield Barrier, International Rice Research Institute, Los Baños, 21-38. [16] Ying, J., Peng, S., He, Q., Yang, H., Yang, C., Visperas, R.M. and Cassman, K.G. (1998) Comparison of High-Yield
Rice in Tropical and Subtropical Environments. I. Determinants of Grain and Dry Matter Yields. Field Crops Research,
57, 71-84. http://dx.doi.org/10.1016/S0378-4290(98)00077-X
[17] Yan, W., Pageau, D., Frégeau-Reid, J. and Durand, J. (2011) Assessing the Representativeness and Repeatability of Test Locations for Genotype Evaluation. Crop Science, 51, 1603-1610. http://dx.doi.org/10.2135/cropsci2011.01.0016
[18] Jaballa, O.R. (1995) Response of Upland Rice Varieties to Nitrogen Fertilization and Intercropping. Ph.D. Thesis, Phillippiines Univ. Los Banos Laguna (Phillippines). 114 Leaves. Thesis (Ph.D. in Agronomy).
[19] Roy, A. and Panwar, D.V.S. (1994) Phenotypic Stability of Some Indian and Exotic Genotypes of Rice (Oryza sativa
OALibJ | DOI:10.4236/oalib.1102294 7 January 2016 | Volume 3 | e2294
[20] Sreedhar, S., Dayakar, Reddy, T. and Ramesha, M.S. (2011) Genotype × Environment Interaction and Stability for Yield and Its Components in Hybrid Rice Cultivars (Oryza sativa L.). International Journal of Plant Breeding and
Genetics, 5, 194-208. http://dx.doi.org/10.3923/ijpbg.2011.194.208
[21] Thirumeni, S. and Subramanian, M. (1999) Character Association and Path Analysis in Saline Rice. Vistas of Rice Res, 192-196.
[22] Chakraborty, S., Das, P.K., Guha, B., Barman, B. and Sarmah, K.K. (2001) Coheritibility, Correlation and Path Analy-sis of Yield Components in Boro Rice. Oryza, 38, 99-101.
[23] Yogamenakshi, N.N. and Ambularmathi, J. (2004) Correlation and Path Analysis on Yield and Drought Tolerant Attributes in Rice (Oryza sativa L.) under Drought Stress. Oryza, 41, 68-70.
[24] Seyoum, M., Alamerew, S. and Bantte, K. (2012) Genetic Variability, Heritability, Correlation Coefficient and Path Analysis for Yield and Yield Related Traits in Upland Rice. Journal of Plant Sciences, 7, 13-22.
http://dx.doi.org/10.3923/jps.2012.13.22
[25] Babu, V.R., Shreya, K., Dangi, K.S., Usharani, G. and Shankar, A.S. (2012) Correlation and Path Analysis Studies in Popular Rice Hybrids of India. International Journal of Scientific and Research Publications, 2, 1-5.
[26] Shanthakumar, G., Mahadevappa, M. and Rudraradhya, M. (1998) Studies on Genetic Variability, Correlation and Path Analysis in Rice (Oryza sativa L.) over Seasons. Karnataka Journal of Agricultural Sciences, 11, 67-72.
[27] Zeng, L. and Shannon, M.C. (2000) Salinity Effects on Seedling Growth and Yield Components of Rice. Crop Science,
40, 996-1003.http://dx.doi.org/10.2135/cropsci2000.404996x
[28] Yolanda, J.L. and Das, L.D.V. (1995) Correlation and Path Analysis in Rice (Oryza sativa L.). The Madras
Agricul-tural Journal, 82, 576-578.
[29] Nayak, A.R., Chaudhury, D. and Reddy, J.N. (2001) Correlation and Path Analysis in Scented Rice. Indian Journal of