Munich Personal RePEc Archive
School Performance Evaluation under
the Voucher System: the Case of Chile
Bronfman, Javier
Universidad Adolfo Ibáñez
1 April 2007
Online at
https://mpra.ub.uni-muenchen.de/63264/
School Performance Evaluation under the Voucher System: the Case
of Chile
Javier Bronfman
Abstract
I. Introduction
Increasing economic resources for schools is the most commonly implemented
approach to improving educational outcomes. However, studies have shown that this
strategy does not always work efficiently. For instance, a meta-analysis by the World
Health Organization (WHO) of over 400 student achievement studies concludes that there
is no consistent evidence supporting the direct relationship between increasing resources
and enhancing student performance.1 Other studies have analyzed discrepancies in school
outcomes by focusing on how different approaches to school administration and financing
influence results.
In 1962, Milton Friedman proposed subsidizing the cost of education by issuing
vouchers.2 His framework was designed to introduce market-based competition to increase
educational quality among schools. The lack of conclusive support for this theory
necessitates an evaluation of the Chilean voucher system that provides policymakers with
evidence on the level of success or failure of the system. This study aims to contribute to
the understanding of the voucher system and education policy in Chile.
Contreras (2001) and Contreras, Arzola and Bronfman (2001) use standardized
tests, specifically the Sistema de Medición de la Calidad de la Educación (SIMCE)3 dataset
for the year 1999, as a proxy of achievement and school quality to establish whether or not
the Chilean voucher system delivers better educational results than the public schools. This
article applies their methodology to the latest available SIMCE dataset (2003) for
second-year high school students. This paper’s contribution lies in its analysis of empiric evidence
from Chilean schools at the national level to further explore how free choice and market
forces facilitate better outcomes and a higher quality of education.
Information about the student, his or her family, and the school’s characteristics
from the SIMCE dataset was used to develop variables for an analysis of individual results
on the Language & Communication and Math tests. The model used is based on the
equation below:
Y
i=
β
0X
0+
β
1X
1+
β
2X
2+
ε
i1 (Hanushek 1986)
2
(Friedman 1962)
Yi is the individual test score for each of the tests. X0 corresponds to individual
characteristics, and X1 to family characteristics. X2 represents school information.
β
n arethe associated parameters and
ε
iis the error term.When using ordinary least-square (OLS) regressions, a number of problems
typically arise. Some issues involve the estimation of the parameters. In other cases,
important variables are omitted and some included variables are endogenous, or have
values determined by the states of other variables in the system. One of the most critical of
these variables is school choice. First, I will estimate an OLS model and then a two-stages
least-squares (TSLS) model. In the TSLS model, I will predict the probability of enrolling
in a public, private subsidized or private-paid school, based on availability at a community
level, then include predicted probability into the first model to address selection bias.
The TSLS model used by Contreras (2001) and later Contreras, Arzola and
Bronfman (2001) deals effectively with the problem of endogenous variables. This method
is groundbreaking because it addresses selection bias by using instrumental variables to
predict a probability of attending each of the different school types. By using instrumental
variables and a predicted probability for the endogenous variable that captures the school
decision, the new model remedies the bias problem.
II. Chilean Education System
Since the establishment of Chile as a nation, widespread education has been a high
priority for its government. Under colonial rule, the Catholic Church administered the
education system and the availability of formal schooling was limited and directly related
to wealth and socioeconomic status. The 1833 Constitution later consigned the government
with responsibility of the education system. Schools and universities were managed by the
state and had very low enrollment. President Gabriel Gonzáles Videla (1946-1952) initiated
a program to improve educational outcomes through the provision of monetary subsidies
that covered half of the tuition at some private schools. Subsequent administrations focused
on expanding access to education and mandatory length of years of enrollment rather than
Prior to 1980, the government defined curricula and supervised administration of more than
80% of schools.4 Chile instituted an educational voucher system in the early 1980’s under
Augusto Pinochet’s military regime. The vouchers consisted of a monetary subsidy that
varied in value depending upon whether students were attending primary or secondary
school. After families designated schools for their children, the schools received the
subsidy directly. As part of this reform, control over school administration shifted from the
central government to municipalities. Chile’s current education system consists of three
types of schools that grew out of these reforms: public schools, subsidized private schools,
and private schools. Generally, low-income families choose between public schools and
subsidized private schools. Private schools draw students primarily from medium-high- and
high-income families.
III.
Evaluation Measures
Chile began using standardized tests in 1983 as a proxy to evaluate the performance
of schools. Test results enable the government to assess school performance and provide
families with important information on the quality of the schools available to them. Since
the initial voucher reforms, the production function model has been the most common way
to analyze school performance. This model uses standardized test results along with family
and school characteristics to explain each individual’s achievement.
Starting in 1987, the government began to administer the Measurement System of
Quality of Education (SIMCE) annually to all fourth-, eighth-, and tenth-grade students. Its
primary objective is to generate reliable indices that can guide policy to improve the quality
of education, and give information to families about student performance both within and
across schools.
IV. Literature Review
When looking at the available literature analyzing school success, the results of the
voucher system are inconclusive. Educational voucher studies using OLS models suggest
that the per-student subsidy increases student achievement, but its impact is small. Other
studies have focused on the role of alternative factors, such as parental education and
school type, in determining educational outcomes.5
A central shortcoming of OLS models is the selection bias produced by endogenous
variables. School selection is an endogenous variable because it varies depending on family
preference, resources, religious beliefs, and school availability thus, the OLS model, will be
biased. This bias problem is addressed in Contreras (2001) and Contreras, Arzola and
Bronfman (2001). Both studies identify school choice as an endogenous factor and use a
supply-side instrument to model this decision. The instrument used is the accessibility of
the three school types to the community. Using the 1998 academic achievement test (PAA)
results, Contreras (2001) finds vouchers to have a significant and positive impact on
student achievement. However, using the same methodology over the SIMCE dataset for
1999, Contreras, Arzola and Bronfman (2001) do not find the same results. Their study
finds that vouchers have a positive yet non-significant impact on educational outcomes and
concludes that subsidized schools do not perform better than public schools.
Rodríguez (1988) uses a sample of 281 schools located in Santiago and the results
of the PER test, a standardized test used prior to SIMCE that measures results of the
Chilean education system during 1984. The study concludes that the educational gap
between schools is statistically significant by 7 to 8 points, favoring the private ones
(Rodríguez 1988). Aedo and Larrañaga (1994) employ a broader dataset than Rodríguez,
sampling 500 schools and using the 1990 and 1991 SIMCE dataset. This study also
includes socioeconomic information from the National Socioeconomic Characteristics
Survey (CASEN, 1990). Aedo and Larrañaga find similar evidence to Rodriguez: students
at subsidized schools obtain higher average test scores than do public school students.
Using a SIMCE panel data set for the years 1988 and 1996, Carnoy and McEwan (1998)
analyzes the impact of voucher-induced competition on the Chilean education system,
measuring the impact of competition based on the change in student distribution across
different school types. This study finds that competition reduces the overall SIMCE test
result.
On average, these studies find a difference of roughly 7% in test scores across
public, subsidized and private schools. However, these findings are not consistent when
using different datasets and school levels, and the explanation for this difference changes
when a greater number of control variables is included. Significant control variables
include class size, teacher/student ratio, mother’s level of education, school revenue,
poverty index, and a rate of failing years of school. All other studies relied on OLS models
since there was no instrumental variable available to address the bias problem.
V. Methodology
Estimation of a standard OLS model will be presented and contrasted with results of
the instrumental variable (IV) and two-stages least-square (TSLS) models. However, such
estimation and modeling have limitations: some of the variables are correlated; and the
dataset does not permit inclusion of some relevant variables that may help to better
understand the task at hand. The TSLS model included in this paper is set up in the
following way: In the first stage, an estimate of a Multinomial Logit model is used to
predict the probability of choosing one of the three different schools types using the public
schools as a reference. This model assumes that school selection is a function of family
income, as well as some other restrictions such as availability of schools at the community
level, and control variables. Availability is used as an instrument under the assumption that
this variable is correlated with the decision of enrollment but not with student capacities.
Therefore, this model addresses the bias problem by estimating a probability of enrollment
that is not determined by the state of the other variables on the model.
VI. Data and Analysis
This study uses the SIMCE test for the year 2003, administered on a national level
to students in their second year of high school. Initially, an estimation of an OLS model
will determine whether there is a selection bias when regressing the scores of both tests by
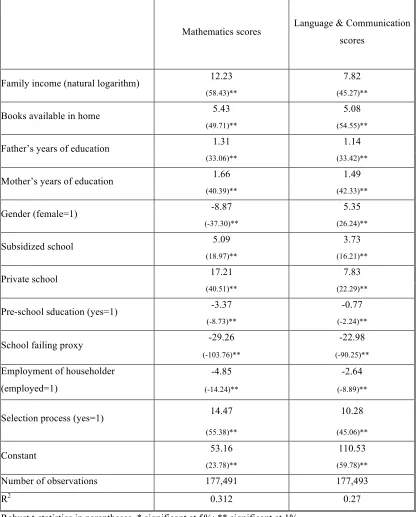
Table Nº1: SIMCE scores ordinary least-squares.
Mathematics scores Language & Communication scores
Family income (natural logarithm) 12.23 7.82
(58.43)** (45.27)**
Books available in home 5.43 5.08
(49.71)** (54.55)**
Father’s years of education 1.31 1.14
(33.06)** (33.42)**
Mother’s years of education 1.66 1.49
(40.39)** (42.33)**
Gender (female=1) -8.87 5.35
(-37.30)** (26.24)**
Subsidized school 5.09 3.73
(18.97)** (16.21)**
Private school 17.21 7.83
(40.51)** (22.29)**
Pre-school sducation (yes=1) -3.37 -0.77
(-8.73)** (-2.24)**
School failing proxy -29.26 -22.98
(-103.76)** (-90.25)**
Employment of householder
(employed=1)
-4.85 -2.64
(-14.24)** (-8.89)**
Selection process (yes=1) 14.47 10.28
(55.38)** (45.06)**
Constant 53.16 110.53
(23.78)** (59.78)**
Number of observations 177,491 177,493
R2 0.312 0.27
Robust t-statistics in parentheses, * significant at 5%; ** significant at 1%
Source: SIMCE, 2003.
All coefficients estimated are statistically significant at 99% level of confidence.
than on the language test. All other variables held constant, a student attending a subsidized
school will score an average of three to five points higher than if he or she attended a pubic
school.
A few other factors have a significant impact on student performance. For example,
each additional year of paternal education increases students’ test scores by 1.3 and 1.1
points in math and language, respectively. The employment status of the head of the
household negatively affects scores by reducing the average test scores by an average of
four points.
In addition, availability of books in the house adds more than five points to
students’ test scores for each incremental increase in level of availability. Interesting but
not surprising is that students who went through a selection process, such as an admission
test, do better on this test. On average, they score 14.5 points higher on math and10.2 more
on language. Students who have failed any level of school before taking the test are more
likely to get an average of 30 points less on math and 23 lower on language.
The model and estimations presented above, as explained before, do not recognize
or account for the presence of endogenous variables or the problem of school selection.
This selection bias necessitates additional analysis.
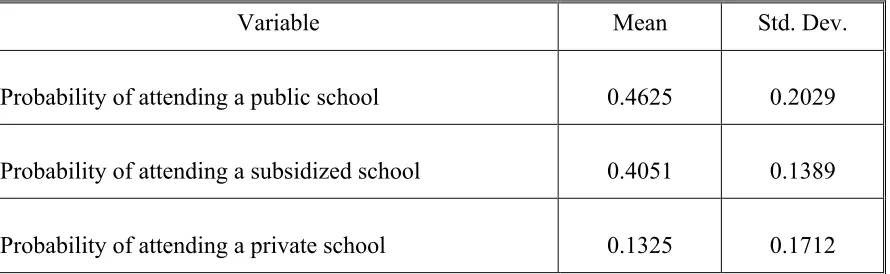
The next step is to estimate a Multinomial Logit that predicts the probability of
attending each type of school, using school availability at the community level as an
instrument, and other variables such as family and school characteristics. This methodology
prevents biased estimations by includingendogenous variables. Results of this model are
Table Nº 2: Predicted probabilities of attending each type of school, using a Multinomial
Logit model.
Variable Mean Std. Dev.
Probability of attending a public school 0.4625 0.2029
Probability of attending a subsidized school 0.4051 0.1389
Probability of attending a private school 0.1325 0.1712
Instrument used: Availability at a community level; Number of observations: 179,678
With the predicted probabilities as dependent variables, estimations of a TSLS model
eradicate the endogenous bias caused by the non-random decision of attending variable.
The fact that enrollment is a household non-random decision, biases any attempt of
estimation. In this way, the probability (random by nature) estimated in the Logit model
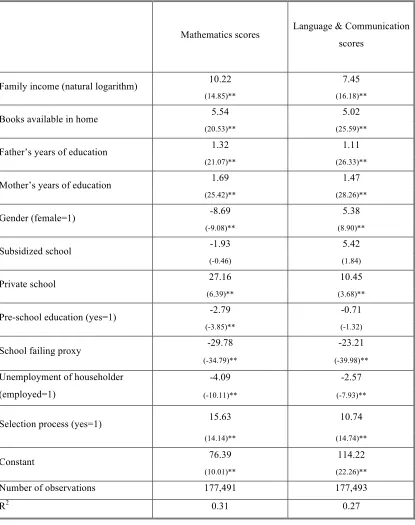
[image:10.612.85.530.126.263.2]Table Nº 3: SIMCE scores using a two-stage least-square model.
Mathematics scores Language & Communication scores
Family income (natural logarithm) 10.22 7.45
(14.85)** (16.18)**
Books available in home 5.54 5.02
(20.53)** (25.59)**
Father’s years of education 1.32 1.11
(21.07)** (26.33)**
Mother’s years of education 1.69 1.47
(25.42)** (28.26)**
Gender (female=1) -8.69 5.38
(-9.08)** (8.90)**
Subsidized school -1.93 5.42
(-0.46) (1.84)
Private school 27.16 10.45
(6.39)** (3.68)**
Pre-school education (yes=1) -2.79 -0.71
(-3.85)** (-1.32)
School failing proxy -29.78 -23.21
(-34.79)** (-39.98)**
Unemployment of householder
(employed=1)
-4.09 -2.57
(-10.11)** (-7.93)**
Selection process (yes=1) 15.63 10.74
(14.14)** (14.74)**
Constant 76.39 114.22
(10.01)** (22.26)**
Number of observations 177,491 177,493
R2 0.31 0.27
Source: SIMCE, 2003.
The estimation presented above confirms the selection bias generated by an OLS
model by comparing the impact of school choice on test scores as predicted by OLS and
TSLS estimations. The TSLS model, using the probability predicted of attending one of the
three types of school, shows new coefficients that explain the differences in results without
the selection bias. The most remarkable change using the TSLS model is the private
schools results. The estimated performance of private school students is ten points higher
on math tests and three points higher on language tests than that of public school students.
Thus, the OLS estimation underestimates the impact on test scores of attending to private
schools.
In the OLS model, subsidized schools show better test score results than public
schools. Controlling for school selection bias, using the TSLS model, subsidized schools do
not show a statistically significant difference in student performance compared to public
schools.
VII. Results and Conclusion
Many studies have tried to identify the impact of the educational voucher system.
This analysis finds similar results to its predecessors’ but maintains the accountability of
the educational system and updates the dataset. Using a two-stages least-square model and
estimating the differences between the results of the three school administrations
co-existing in Chile, private education emerged as superior, but subsidized and public schools
came up with statistically equal results in both mathematics and language tests.
Of the other variables included, income and parental education appear to be strong
predictors of student performance. Gender also plays a role: girls perform worse in math
but better in language than do boys, ceteris paribus. Availability of books in the house
again proves important in determining better test scores. School selection processes
increase the scores by 15.6 and 10.7 in math and language, respectively.
The results presented above are similar to the Contreras, Arzola and Bronfman
(2001) findings. These results could suggest that the voucher system did not work as
students performed the same regardless of their administration. The quality of education
they provide is the same, and competition does not seem to improve results. Alternatively,
one could argue that the competition level introduced to the system did work. The right
incentive could equalize education, pooling its quality upward, and ultimately stabilize the
education system at a level that uses its scarce resources most effectively. Both alternatives
are plausible; however, the second seems more likely, since public schools have not
performed as well as subsidized schools in recent years. Assuming that the voucher system
does improve the quality of public and subsidized schools, there is still much to be done to
improve the overall performance results of the Chilean education system.
In summary, the incentives and the level of competition introduced to the Chilean
education system by vouchers, as well as the availability of both public and subsidized
schools, at a community level, helps closing the gap of education quality among school
types. Subsidized private schools and public schools increase competition for students,
which allows the system to reach a higher steady state of quality that would not otherwise
exist.
Regarding policy recommendations, a good idea is to look at outliers, subsidized,
and public schools that are doing better than others, conduct internal evaluations to measure
absolute progress, and try to duplicate their models of education. Since private education is
substantially superior, more liberalization and a final privatization of schools may benefit
the whole system. Privatizing the system and providing both a broader voucher system and
direct subsidies to families can also improve competition. It would likely increase the
quality of education by supplying a higher level of choice to low-income families, who
currently cannot choose between subsidized and public schools, while also raising the
References
Aedo, C. y O. Larrañaga (1994). “Sistemas de Entrega de los Servicios Sociales: LaExperiencia Chilena” en C. Aedo and O. Larrañaga (eds), Sistemas de Entrega de los
Servicios Sociales: Una Agenda para la Reforma. Washington, DC:Interamerican
Development Bank.
Angrist, J.D., y Imbens, G.W. (1995), “Two-Stage Least-squares Estimation of Average Causal Effects in Models with Variable Treatment Intensity”, Journal of the American Statistical Association, 90, 431-442.
Angrist, J.D., Imbens, G.W., y Rubin, D.B. (1996), “Identification of Causal Effects Using Instrumental Variables”, Journal of the American Statistical Association, 91, 444-455.
Angrist, J.D., y Krueger, A.B. (1991), “Does Compulsory School Attendance Affect Schooling and Earnings”, Quarterly Journal of Economics, 106, 979-1014.
Bravo, D. (1998). “Competition and Quality of Education: An Assessment of the Chilean Voucher System”. Draft. Department of Economics, Universidad de Chile.
November.
Card, D. y A.Krueger (1992). “Does School Quality Matter? Returns to Education and the Characteristics of Public Schools in the United States”. Journal of Political
Economy 100, February.
Card, D.E. (1995b) “Using geographic Variation in College Proximity to estimate The return to Schooling”, en Aspect of Labour Market Behaviour: Essays in Honor of John Vanderkamp, eds. L.S. Christofides et al. Toronto: University of Toronto Press. 201-221.
Card, D.E. (2000), “Estimating the return to Schooling: Progress on Some Persistent Econometric Problems”, NBER Working Paper 7769.
Carnoy, M. y P.McEwan (1998). “Is Private Education More Effective and Cost-Effective than Public?. The Case of Chile”. Draft. Stanford University.
Contreras, D. “Evaluating a Voucher system in Chile. Individual, Family and School Characteristics” Documento de trabajo Nº175, Marzo 2001. Departamento de Economía, Universidad de Chile.
Contreras, D. Macías V. “Desigualdad educacional en Chile geografía y dependencia”, Cuaderno de Economía, año 39, Nº118, pp 395-421, Diciembre 2001. Departamento de Economía, Universidad de Chile.
Contreras, D.et all “Monetary incentives for teachers and scholl performance: Evidence for Chile” March 2005,Departamento de Economía, Universidad de Chile.
Friedman, M. (1955). “The Role of Government in Education”. In R.A.Solo (ed),
Economics and the Public Interest, New Brunswick, N.J., Rutgers University Press.
Friedman, M. (1962). “The Role of Government in Education”. in Milton Friedman,
Capitalism and Freedom, Chicago: University of Chicago Press.
Hanushek, E. (1986). “The Economics of Schooling: Production and Efficiency in Public Schools”. Journal of Economic Literature 24, September.
Hanushek, E. (1996). “School Resources and Student Performance”. In G.Burtless (ed),
Does Money Matter? the Effect of School Resources on Student Achievement and Adult Success, the Brookings Institution.
Heckman, J., A.Layne-Farrar y P.Todd (1996). “Does Measured School Quality Really Matter?. An Examination of the Earnings-Quality Relationship”. Working Paper, National Bureau of Economic Research.
Heckman, J.J., y Vytlacil, E.J. (1998) “Instrumental variables methods for the Correlated random Coefficient Model”, Journal of Human Resources, 33:4, 974-1002.
Hedges, L., R.Laine y R.Greenwald (1994). “Does Money Matter? A Meta-Analysis of Studies of the Effects of Differential School Inputs on Student Outcomes”.
Educational Researcher 23, April.
Hedges, L. y R.Greenwald (1996). “Have Times Changed? the Relation between School Resources and Student Performance”. En G.Burtless (ed), Does Money Matter? the Effect of School Resources on Student Achievement and Adult Success, the
Brookings Institution.
Mizala, A. y P.Romaguera (1998). “Desempeño escolar y elección de colegios: la experiencia chilena”. Center of Applied Economics, Universidad de Chile.
Núñez, I. et all. “Sistema educativo Nacional de Chile: 1993” Ministerio de Educación de Chile y Organización de Estados Iberoamericanos, Santiago, 1993.
Quintanilla, X. “Sistema de financiamiento compartido: Una evaluación de su funcionamiento y los efectos en el rendimiento educacional” Seminario de título año 2000, FACEA, Universidad de Chile.
Rodríguez, J. (1988), School achievement and decentralization policy: the Chilean case.
Revista de Análisis Económico, 3, 1. ILADES.
Sanhueza, C. “Rendimiento educacional, desigualdad y brecha de desempeño publico privado” Seminario de título año 1999, FACEA, Universidad de Chile.
Schiefelbein, E. (1992). “Análisis del SIMCE y sugerencias para mejorar su impacto en la calidad”. En S.Gómez (ed), La realidad en cifras. Estadísticas Sociales. Flacso/INE.
West, E. (1997). “Education Vouchers in Principle and Practice: A Survey”. The World Bank Research Observer, Vol.12.
Witte, J. (1996). “School Choice and Student Performance”. En H.Ladd (ed), Holding
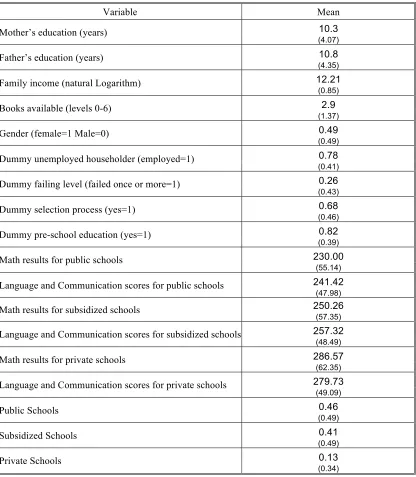
Annex 1: Descriptive Statistics
Table 4: Mean and standard deviation of used variables.
Variable Mean
Mother’s education (years) 10.3
(4.07)
Father’s education (years) 10.8
(4.35)
Family income (natural Logarithm) 12.21
(0.85)
Books available (levels 0-6) 2.9
(1.37)
Gender (female=1 Male=0) 0.49
(0.49)
Dummy unemployed householder (employed=1) 0.78
(0.41)
Dummy failing level (failed once or more=1) 0.26
(0.43)
Dummy selection process (yes=1) 0.68
(0.46)
Dummy pre-school education (yes=1) 0.82
(0.39)
Math results for public schools 230.00
(55.14)
Language and Communication scores for public schools 241.42
(47.98)
Math results for subsidized schools 250.26
(57.35)
Language and Communication scores for subsidized schools 257.32
(48.49)
Math results for private schools 286.57
(62.35)
Language and Communication scores for private schools 279.73
(49.09)
Public Schools 0.46
(0.49)
Subsidized Schools 0.41
(0.49)
Private Schools 0.13
(0.34)