http://dx.doi.org/10.4236/jamp.2015.312189
Option Pricing with Stochastic Volatility
Rossano Giandomenico
Independent Research Scientist, Chieti, Italy
Received 30 October 2015; accepted 22 December 2015; published 25 December 2015
Copyright © 2015 by author and Scientific Research Publishing Inc.
This work is licensed under the Creative Commons Attribution International License (CC BY).
http://creativecommons.org/licenses/by/4.0/
Abstract
The study analyses some problems arising in stochastic volatility models by using Ito’s lemma and its applications to boundary Cauchy problem by giving the solution of vanilla option pricing mod-els satisfying the partial differential equation obtained by assuming stochastic volatility in repli-cation problems and risk neutral probability.
Keywords
Contingent Claim, Stochastic Volatility, Ito’s Lemma, Cauchy problem, Bivariate
1. Introduction
In finance Wiener process and geometric Brown process are largely used. The name came from George Brown in the 1827 noted that the volatility of a small particle suspended in a liquid increased with the time. Wiener gave a mathematical formal assumption on the phenomena from the term of Wiener process. The main property of the Wiener process is that it is a forward process such that we may integrate it although it is a function of in-finite variation; the main idea is that the process converges to the discrete process because the limit tends toward the discrete process when it is shared in sub intervals. From this we may approximate the Wiener process in the instant as dt . This permits to give the proof of Ito’s lemma by using Taylor series. Indeed, the problem is more complicated because the diffusion process is a standardized normal distribution. This permits to give the solution to the Cauchy problem subject to boundary although the problem is parabolic. The case of stochastic volatility may be viewed as Cauchy problem where the diffusion process of Ito’s lemma is a bivariate standar-dized normal distribution. Thus we may solve easily the problem of option pricing with stochastic volatility in risk neutral world by using the integrant factor.
2. The Model and Its Assumptions
( )
( )
( )
d
d d
S t
t t Ws
S t =µ +σ (1) where µ
( )
t denotes the drift of the distribution and it is the average in the dt, σ denotes the volatility of the distribution and dWs denotes a Wiener process such that it may be decomposed by the following:[ ]
dWs=N 0,1 d .t (2)
We may assume the following for the Wiener process:
2 2
d d ~ d .
T t
E
∫
Ws = − ⇒ T t Ws t (3)This means that a Wiener process is a forward process, the uncertainty is to the end of the process in T + dt. From this we may obtain explanation of Ito’s lemma by using Taylor series, if we take a function of S as F(S) we may write Ito’s lemma in the following way:
( )
2 2 2 2 22 2
1
d d d d d 2 d d .
2
F F F F F
F S t S S t t S Q
t S S t S t
∂ ∂ ∂ ∂ ∂
= + + + + +
∂ ∂ ∂ ∂ ∂ ∂ (4)
We may note that:
2 2 2 2 2 3 2 2 2
dS =µ S dt +2µσS dt +σ S dt (5)
2 3 2
dS td =µS td +σS td . (6) From this we obtain as dt tends to zero:
( )
2 2 22 1
d d d d .
2
F F F
F S t S S t
t S S
σ
∂ ∂ ∂
= + +
∂ ∂ ∂ (7)
By substituting dS we obtain Ito’s lemma:
( )
2 2 22 1
d d d .
2
F F F F
F S S S t S Z
t
µ
S Sσ
σ
S∂ ∂ ∂ ∂
= + + +
∂ ∂ ∂ ∂
(8)
We may see now as to obtain the expected value of a normal distribution as such we have the following:
( )
( )
.f z = zf z
∫
∫
(9) As such we have the following:2 1 2 1
e
2π .
z
z
σ
−
∫
(10)This may be rewritten by:
2 2
1 1 1
~ 2 . 2
z z σ
σ
∫
(11)From this we may obtain explanation for Ito’s lemma, if we take a function of S as F S
( )
we may write Ito’s lemma in the following way:( )
2 2 22 1
d d d
2
F F F F
F S S S t S Z
t
µ
S Sσ
σ
S∂ ∂ ∂ ∂
= + + +
∂ ∂ ∂ ∂
(12)
where:
2
d ; d .
d z
Z N t
t µ σ σ σ − =
(13)
As result:
[
d]
0.Because:
( )
( )
0.d z
f z f z
t
µ σ
−
= =
∫
∫
(15)Now we may analyze the following parabolic problem:
2 2 2 2 1 0. 2
F F F
S S
t µ S S σ
∂ + ∂ + ∂ =
∂ ∂ ∂ (16)
Subject to the following constraint:
( )
(
)
( )
.F S T =F S (17)
The solution it is easy to solve, because if we take Ito’s lemma and we take the expectation we obtain that the solution to the parabolic problem is given by:
( )
(
)
( )
.F S T = E F S (18)
It is interesting to introduce the concept of stochastic volatility, as such we may write Ito’s lemma in the fol-lowing form:
( )
2 2 2 2 2,
2 2
1 1
d d d
2 2 x y
F F F F F F F
F S S S S t S Z
t
µ
Sα
σ
Sσ
ρσδ
Sσ
σ
δ
σ
S∂ ∂ ∂ ∂ ∂ ∂ ∂
= + + + + + +
∂ ∂ ∂ ∂ ∂ ∂ ∂ ∂
(19)
where dZ denotes a standardized bivariate normal distribution with the following form:
(
)
(
)
( )
2 2 2 2 2 1 2 1 , e 2π 1 x y y xz z z z
f x y
ρ ρ ρ + − − − =
− (20)
where:
(
x)
(
y)
x y
x y
y x
z µ z µ
σ σ
− −
= = (21)
(
, 0)
x y y, 0, x y y, 0f x y=y = Nµ = σ = (22)
(
)
0
,
y
x y y x x
y y µ
µ µ ρσ
σ
=
−
= + (23)
(
)
0
2
, 1 .
x y y x
σ = =σ −ρ (24) The PDE that an option must satisfy by assuming stochastic volatility is given by the following:
( )
(
2)
2 2 2 2 2 2 2( )
2 2
1 1
0
2 2
F F F F F F
r S k t S S rF S
t S α γσ σ S σ ρσ δ S σ σδ σ
∂ + ∂ + − ∂ + ∂ + ∂ + ∂ − =
∂ ∂ ∂ ∂ ∂ ∂ ∂ (25)
where:
( )
( )
( )
2d
d d S
S t
r t t W
S t = + σ (26)
( )
2(
( )
2)
( )
2dσ t =k α γσ− t dt+δ σ t dWσ (27)
( )
(
)
erT(
,)
.F S T = − E F S σ (29)
The final pay off of a Call and Put option is given by the following:
( )
Call=MaxS T −K; 0 (30)
( )
Put=MaxK−S T ; 0 . (31)
The prices of the options are given by the expectation of the final pay off discounted for the Call options, in-stead, for the Put options we assume that to replicate the value of options we have to have available the amount of money K that will produce a risk free earnings:
(
, ,)
( )
Max(
( )
; 0)
C S T K =P T E S T −K (32)
(
, ,)
( )
Max( )
K( )
; 0 Max(
( ) ( )
; 0 .)
P S T K P T E S T E K P T S T
P T
= − = −
(33)
So from 33 we may note that for the Put options will be discounted only the process S T
( )
. Now to compute the value of the option is a problem because we have stochastic interest rate so the solution is to take the default free zero coupon bond as forward measure. We assume the following process for the default free zero coupon bond:( )
( )
( )
d
d Pd P T
r t t Wp
P T = +σ (34) .
P rT
σ =σ (35)
As result we obtain the following pricing formula for the options by using the respective numeraire:
(
)
( )
(
( ))
[ ]
( )
[ ]
2
, , e 1 2
k t a
T
C S T K S t N d P T KN d
γσ ρ
δ −
= − (36)
where:
( )
( )
(
( )
)
( )
0 2 2 , 2x y y
k t a
r t t
t
γσ
µ ρ σ
δ σ
=
−
= + (37)
(
)
0
2 2
, 1
x y y N
σ = = σ −ρ (38)
( )
2 2( )
22 2 d
T
P P
t N
t t t
T t
σ σ ρ σ σ
σ = + −
−
∫
(39)( )
( )
(
)
(
)
(
)
2 2 2 2 1 ln 1 2 1 1 N Nk t a
S T T KP T d T γσ
ρ ρ σ
δ ρ σ − + + − =
− (40)
( )
( )
(
)
(
)
(
)
2 2 2 2 1 ln 1 2 2 1 N Nk t a
S T T KP T d T γσ
ρ ρ σ
δ ρ σ − + − − =
− (41)
(
)
[ ] ( )
(
( ))
[ ]
2
, , 1 e 2
k t a
T
P S T K KN d S t N d
γσ ρ
δ −
= − (42)
( )
(
( )
)
(
)
(
)
2
2 2
2
1
ln 1
2 1
1
N
N
k t a
KP T
T T
S d
T
γσ
ρ ρ σ
δ ρ σ
−
− + −
=
− (43)
( )
(
( )
)
(
)
(
)
2
2 2
2
1
ln 1
2
2 .
1
N
N
k t a
KP T
T T
S d
T
γσ
ρ ρ σ
δ ρ σ
−
− − −
=
− (44)
3. Numerical Results
We may compare the model with [1] and [2], as results we have the following figures for Call options (Tables 1-3).
As results we have the following figures for Put options (Tables 4-6).
[image:5.595.83.541.348.526.2]We may note from the numerical results that for rational value of parameters [1] converges to [2], instead, the bivariate approach permits to capture the skew for options deep in the money, so it is a good candidate in period of crisis. We may analyses further the formulations obtained by using Monte Carlo simulations (Appendix), but the approach has a drawback, for the Put option the simulation gives always the same results so we have to use the fair Put Call parity, as such we have the following prospects (Tables 7-9).
Table 1. For rational value of parameters [1] converges to [2].
Spot price (S) 1
Strike price (K) 1
Risk free rate (r) 0.03
Time to maturity (T – t) 2
Rho (ρ) −0.5
Kappa (κ) 0.2
Theta (θ) 0.03
Lambda (λ) 2
Volatility of variance (σ) 0.1
Current variance (v) 0.01
Heston call price 0.0896
Bivariate call price 0.0970
[image:5.595.109.538.552.720.2]Black scholes call price 0.0887
Table 2.[1] converges to [2], instead, the bivariate approach permits to capture the skew for options deep in the money.
Spot price (S) 1.5
Strike price (K) 1
Risk free rate (r) 0.03
Time to maturity (T – t) 2
Rho (ρ) −0.5
Kappa (κ) 0.2
Theta (θ) 0.03
Lambda (λ) 2
Volatility of variance (σ) 0.1
Current variance (v) 0.01
Heston call price 0.5582
Bivariate call price 0.5885
Table 3.[1] converges to [2], instead, the bivariate approach permits to capture the skew for options deep in the money.
Spot price (S) 2
Strike price (K) 1
Risk free rate (r) 0.03
Time to maturity (T – t) 2
Rho (ρ) −0.5
Kappa (κ) 0.2
Theta (θ) 0.03
Lambda (λ) 2
Volatility of variance (σ) 0.1
Current variance (v) 0.01
Heston call price 1.0582
Bivariate call price 1.0986
[image:6.595.99.539.324.512.2]Black scholes call price 1.0582
Table 4. For rational value of parameters [1] converges to [2], we may note that for the bivariate there is parity relation Put
Call.
Spot price (S) 1
Strike price (K) 1
Risk free rate (r) 0.03
Time to maturity (T – t) 2
Rho (ρ) −0.5
Kappa (κ) 0.2
Theta (θ) 0.03
Lambda (λ) 2
Volatility of variance (σ) 0.1
Current variance (v) 0.01
Heston put price 0.0313
Bivariate put price 0.0347
[image:6.595.126.538.541.720.2]Black scholes put price 0.0305
Table 5.[1] converges to [2], instead, the bivariate approach permits to capture the skew for options deep in the money.
Spot price (S) 0.75
Strike price (K) 1
Risk free rate (r) 0.03
Time to maturity (T – t) 2
Rho (ρ) −0.5
Kappa (κ) 0.2
Theta (θ) 0.03
Lambda (λ) 2
Volatility of variance (σ) 0.1
Current variance (v) 0.01
Heston put price 0.1918
Bivariate put price 0.2345
Table 6.[1] converges to [2], instead, the bivariate approach permits to capture the skew for options deep in the money.
Spot price (S) 0.5
Strike price (K) 1
Risk free rate (r) 0.03
Time to maturity (T – t) 2
Rho (ρ) −0.5
Kappa (κ) 0.2
Theta (θ) 0.03
Lambda (λ) 2
Volatility of variance (σ) 0.1
Current variance (v) 0.01
Heston put price 0.4463
Bivariate put price 0.4899
[image:7.595.83.536.100.289.2]Black scholes put price 0.4418
Table 7. Monte Carlo simulations converge to the same result of closed form solution.
Spot price (S) 1
Strike price (K) 1
Risk free rate (r) 0.03
Time to maturity (days) 730
Rho (ρ) −0.5
Kappa (κ) 0.2
Theta (θ) 0.022
Lambda (λ) 2
Volatility of variance (σ) 0.1
Current variance (v) 0.01
Number of simulations 1.000
[image:7.595.93.539.531.720.2]Bivariate MC call price 0.0964
Table 8. Monte Carlo simulations converge to the same result of closed form solution.
Spot price (S) 1.5
Strike price (K) 1
Risk free rate (r) 0.03
Time to maturity (days) 730
Rho (ρ) −0.5
Kappa (κ) 0.2
Theta (θ) 0.022
Lambda (λ) 2
Volatility of variance (σ) 0.1
Current variance (v) 0.01
Number of simulations 1.000
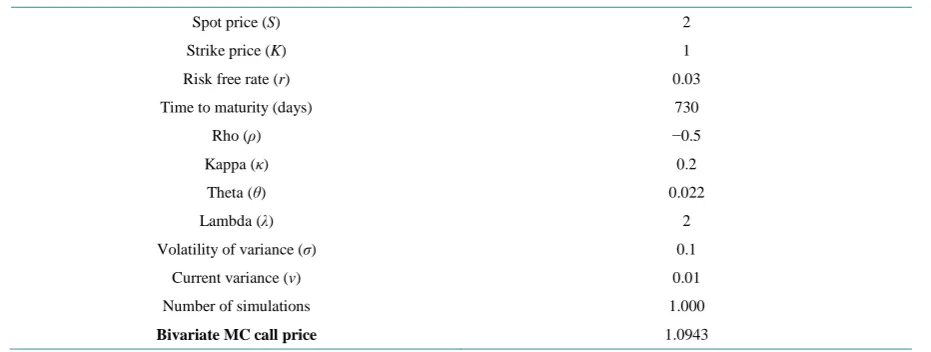
Table 9. Monte Carlo simulations converge to the same result of closed form solution.
Spot price (S) 2
Strike price (K) 1
Risk free rate (r) 0.03
Time to maturity (days) 730
Rho (ρ) −0.5
Kappa (κ) 0.2
Theta (θ) 0.022
Lambda (λ) 2
Volatility of variance (σ) 0.1
Current variance (v) 0.01
Number of simulations 1.000
Bivariate MC call price 1.0943
Indeed, with the simulations the normal distribution is more skewed, so we used a calibrated parameters drift, to compare the two approaches [3]-[7].
4. Conclusion
The study permits to obtain closed form solution for option pricing with stochastic volatility by assuming nor-mal distribution obtained by the properties of the bivariate standardized nornor-mal distribution that is the solution of the Cauchy problem with stochastic volatility due to the properties of Ito’s lemma.
References
[1] Heston, S.L. (1993) A Closed-Form Solution for Options with Stochastic Volatility with Applications to Bond and Currency Options. Review of Financial Studies, 6, 327-343. http://dx.doi.org/10.1093/rfs/6.2.327
[2] Black, F. and Scholes, M. (1973) The Pricing of Options and Corporate Liabilities. Journal of Political Economy, 81, 637-654. http://dx.doi.org/10.1086/260062
[3] Dell’Era, M. (2011) Geometrical Approximation Method and Stochastic Volatility Market Models. International Re-view of Applied Financial Issues and Economics.
[4] Cox, J.C., Ingersoll, J.E. and Ross, S.A. (1985) A Theory of the Term Structure of Interest Rates. Econometrica, 53, 385-407. http://dx.doi.org/10.2307/1911242
[5] Heath, D., Jarrow, R. and Morton. A. (1992) Bond Pricing and the Term Structure of Interest Rates: A New Method-ology for Contingent Claims Valuation. Econometrica, 60, 77-105. http://dx.doi.org/10.2307/2951677
[6] Bjork, T. (1999) Arbitrage Theory in Continuous Time. Oxford University Press, Oxford.
![Table 2. [1] converges to [2], instead, the bivariate approach permits to capture the skew for options deep in the money](https://thumb-us.123doks.com/thumbv2/123dok_us/8028832.768136/5.595.109.538.552.720/table-converges-instead-bivariate-approach-permits-capture-options.webp)
![Table 3. [1] converges to [2], instead, the bivariate approach permits to capture the skew for options deep in the money](https://thumb-us.123doks.com/thumbv2/123dok_us/8028832.768136/6.595.109.538.100.289/table-converges-instead-bivariate-approach-permits-capture-options.webp)
![Table 6. [1] converges to [2], instead, the bivariate approach permits to capture the skew for options deep in the money](https://thumb-us.123doks.com/thumbv2/123dok_us/8028832.768136/7.595.88.539.91.745/table-converges-instead-bivariate-approach-permits-capture-options.webp)