http://dx.doi.org/10.4236/ijcm.2014.56049
Cytokines Released from Allergen-
Stimulated Blood Cells during the Delayed
Asthmatic Response to Allergen Challenge
Zdenek Pelikan
Allergy Research Foundation, Breda, The Netherlands Email: zpelikan@casema.nl
Received 13 January 2014; revised 10 February 2014; accepted 9 March 2014
Copyright © 2014 by author and Scientific Research Publishing Inc.
This work is licensed under the Creative Commons Attribution International License (CC BY). http://creativecommons.org/licenses/by/4.0/
Abstract
Background: Bronchial asthma patients may develop various asthmatic response types to bron-chial challenge with allergen, such as immediate (IAR), late (LAR), dual (DAR) or delayed (DYAR), due to different immunologic mechanisms. The DYAR, beginning between 26 - 32 hrs and lasting up to 56 hrs after the allergen challenge, differs from the IAR, LAR and DAR in clinical, diagnostic and immunologic aspects. The aim of this study was to investigate the concentrations of the par-ticular intracellular cytokines released by blood cells stimulated with relevant allergens “in vitro”, before and during the DYAR. Methods: In 23 patients, the repeated DYAR (p < 0.001) was supple-mented with cytokine determination in the supernatants of the blood cells stimulated with rele-vant allergens before and up to 72 hours after the bronchial challenge, by means of enzyme-linked immunoassay. Results: The significantly elevated pre-challenge concentrations (p < 0.05) of IL-2, IL-17, IFN-γ and G-CSF released by allergen-stimulated blood cells “in vitro” were recorded in the DYAR patients as compared with healthy controls. The significantly increased post-challenge con-centrations (p < 0.05) of IL-1β, IL-2, IL-8, IL-12p70, IL-18, IFN-γ and TNF-α, whereas decreased concentrations of IL-4, IL-6 and IL-17, were released by blood cells stimulated with relevant aller-gens “in vitro”, as compared both with their pre-challenge concentrations and with the corre-sponding PBS control values. Conclusions: The profiles of cytokines released by allergen-stimu- lated peripheral blood cells during the DYAR would suggest an activation of Th1 cells, neutrophils, monocytes and probably also bronchial macrophages, epithelial and endothelial cells and their involvement in the immunologic mechanism(s) underlying the clinical DYAR.
Keywords
1. Introduction
In allergic bronchial asthma various immunologic mechanisms can be involved [1]-[8]. The causal role of im-mediate hypersensitivity upon participation of IgE antibody, mast cells/basophils, eosinophils and Th2-lym- phocytes, in this condition, has already been established [1]-[8]. Although, some evidence for participation of the other immunologic mechanisms has already been gathered, our knowledge of the involvement of the non-IgE mechanisms in the bronchial asthma remains still incomplete [1] [5]-[11]. Patients with bronchial asth-ma being challenged with allergens asth-may develop different asthasth-matic response types, such as immediate (IAR), late (LAR) or dual (DAR) response, having been already studied from various points of view [3] [5] [7]-[22]. Recently, we have described an asthmatic response appearing between 26 - 56 hours after the bronchial chal-lenge with various inhalant allergens, designated as a “delayed asthmatic response” (DYAR) [23] [24]. This re-sponse type exhibited different clinical, immunologic and pharmacologic features from the IAR, LAR and DAR
[12] [13] [23] [24]. The purpose of this study, was to investigate: 1) the cytokine profiles released by peripheral blood cells of patients developing the DYAR after the “in vitro” stimulation with relevant allergens; 2) the possible changes in the particular cytokines released bythe “in vitro” stimulated blood cells with allergen during the DYAR; 3) the activation degree of particular blood cell types during the DYAR.
2. Material and Methods
2.1. Patients
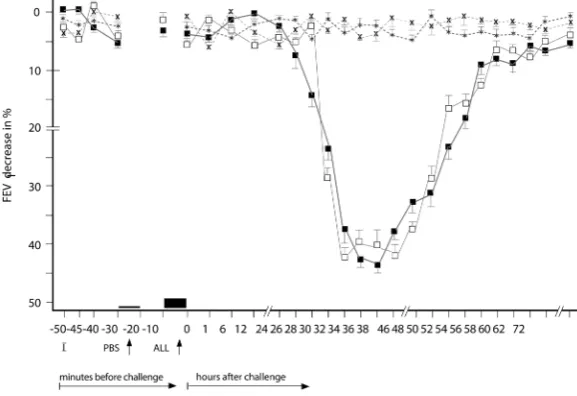
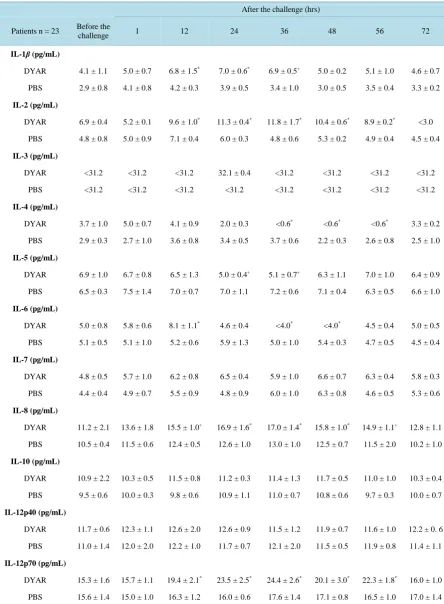
[image:2.595.168.457.457.655.2]Twenty-three asthmatics examined at our Department of Allergology & Immunology, Inst. Med. Sci. “De Klokkenberg”, Breda, The Netherlands during a period 1998-1999 and demonstrating DYAR after the bronchial allergen challenge (Figure 1) volunteered to participate in this study. These patients, 20 - 51 years of age, suf-fered from reversible bronchial constriction alternating with symptom-free periods, but without any restrictive changes of their pulmonary function (Table 1). They did not use oral corticosteroids or immunotherapy and had no airway infections. They were examined by routine diagnostic procedure, serving also as inclusion-exclusion criteria, including various diagnostic parameters (Table 1), among others also 47 bronchial provocation tests with inhalant allergens (BPT) (Table 2) and 23 phosphate buffered saline (PBS) control challenges. All BPTs were performed in a period without manifest bronchial complaints, outside the allergen-relevant season and during hospitalization. Inhalation corticosteroids (n = 9) and long-acting β2-sympathomimetics (n = 5) were
Figure 1.Delayed asthmatic response to allergen challenge (DYAR) and phos-phate buffered saline (PBS) control challenge. The mean percentage changes in the FEV1values calculated from 23 DYARs and 23 PBS control challenges; (■)
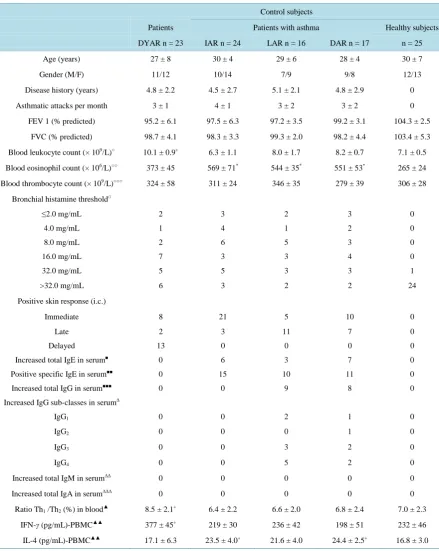
Table 1. Characteristics of the patients and control subjects.
Control subjects
Patients Patients with asthma Healthy subjects
DYAR n = 23 IAR n = 24 LAR n = 16 DAR n = 17 n = 25
Age (years) 27 ± 8 30 ± 4 29 ± 6 28 ± 4 30 ± 7
Gender (M/F) 11/12 10/14 7/9 9/8 12/13
Disease history (years) 4.8 ± 2.2 4.5 ± 2.7 5.1 ± 2.1 4.8 ± 2.9 0
Asthmatic attacks per month 3 ± 1 4 ± 1 3 ± 2 3 ± 2 0
FEV 1 (% predicted) 95.2 ± 6.1 97.5 ± 6.3 97.2 ± 3.5 99.2 ± 3.1 104.3 ± 2.5
FVC (% predicted) 98.7 ± 4.1 98.3 ± 3.3 99.3 ± 2.0 98.2 ± 4.4 103.4 ± 5.3
Blood leukocyte count (× 109/L)○ 10.1 ± 0.9+ 6.3 ± 1.1 8.0 ± 1.7 8.2 ± 0.7 7.1 ± 0.5
Blood eosinophil count (× 106/L)○○ 373 ± 45 569 ± 71* 544 ± 35* 551 ± 53* 265 ± 24
Blood thrombocyte count (× 109/L)○○○ 324 ± 58 311 ± 24 346 ± 35 279 ± 39 306 ± 28
Bronchial histamine threshold□
≤2.0 mg/mL 2 3 2 3 0
4.0 mg/mL 1 4 1 2 0
8.0 mg/mL 2 6 5 3 0
16.0 mg/mL 7 3 3 4 0
32.0 mg/mL 5 5 3 3 1
>32.0 mg/mL 6 3 2 2 24
Positive skin response (i.c.)
Immediate 8 21 5 10 0
Late 2 3 11 7 0
Delayed 13 0 0 0 0
Increased total IgE in serum■ 0 6 3 7 0
Positive specific IgE in serum■■ 0 15 10 11 0
Increased total IgG in serum■■■ 0 0 9 8 0
Increased IgG sub-classes in serum∆
IgG1 0 0 2 1 0
IgG2 0 0 0 1 0
IgG3 0 0 3 2 0
IgG4 0 0 5 2 0
Increased total IgM in serum∆∆ 0 0 0 0 0
Increased total IgA in serum∆∆∆ 0 0 0 0 0
Ratio Th1 /Th2 (%) in blood▲ 8.5 ± 2.1+ 6.4 ± 2.2 6.6 ± 2.0 6.8 ± 2.4 7.0 ± 2.3
IFN-γ (pg/mL)-PBMC▲▲ 377 ± 45+ 219 ± 30 236 ± 42 198 ± 51 232 ± 46
IL-4 (pg/mL)-PBMC▲▲ 17.1 ± 6.3 23.5 ± 4.0+ 21.6 ± 4.0 24.4 ± 2.5+ 16.8 ± 3.0
DYAR = delayed asthmatic response; IAR = immediate asthmatic response; LAR= late asthmatic response; DAR = dual late asthmatic response; Values = mean ± SD; Statistical significance as compared with healthy control subjects =+p ≤ 0.05, *p < 0.05; normal value = 4.0 - 10 × 109/L; °°normal
value = <300 × 106/L; °°°normal value= 150 - 400 × 109/L; □= normal value< 32.0 mg/mL(according to the European and Dutch criteria) [54][55]; (i.c.) = intracutaneous tests; ■Total IgE in the serum (PRIST)-normal value ≤ 500 IU/mL; ■■Positive specific IgE in the serum (RAST) ≥ 0.70 U/mL (= more than class 1); ■■■Total IgG in the serum (Single radial immuno-diffusion =Mancini technique and ELISA)-normal value ≤ 15.0 g/L; ∆Normal values: IgG1 < 5.0 g/L; IgG2 < 2.6 g/L; IgG3 < 0.4 g/L; IgG4 < 0.5 g/L; ∆∆ Normal values: IgM ≤ 3.8 g/L; ∆∆∆Normal values: IgA ≤ 4.0 g/L; ▲=
withdrawn 4 weeks, cromolyn (n = 3) and nedocromil sodium (n = 5) 2 weeks and other treatments 48 hours prior the BPTs. Post-challenge FEV1 decrease by 50% or more with respect to the pre-challenge values (n = 3) was treated with a single dose of 200 - 400 mcg Salbutamol aerosol. In all study participants a single determina-tion of cytokines released from peripheral blood cells after an “in vitro” stimulation with corresponding aller-gens was performed (Table 2). In the DYAR patients the BPTs and PBS controls were repeated 2 - 6 weeks later (Figure 1) and supplemented with recording of cytokines released by isolated peripheral blood cells after the “in vitro” stimulation with relevant allergens before and at 1, 12, 24, 36, 48, 56 and 72 hours after the challenge. The local ethical committee approved this study and an informed consent was obtained from all participants.
2.2. Control Subjects
The 24 patients demonstrating an IAR, 16 developing LAR, 17 showing DAR and 25 healthy subjects volun-teered to participate as control subjects (Tables 1-3).
2.3. Allergens
Dialyzed and lyophilized allergen extracts (Allergopharma, Reinbek, Germany) diluted in PBS were used in concentrations of 100 - 500 BU/mL for skin tests and 1000 - 3000 BU/mL for BPTs (Table 3). The concentra-tions recommended by the manufacturer were 500 BU/mL for skin tests and 5000 BU/mL for the BPTs [24].
2.4. Skin Tests
Skin prick tests (SPT) with allergenic extracts in concentrations of 500 BU/mL were evaluated after 20 minutes. If they were negative, intracutaneous tests in concentration of 100 BU/mL and then 500 BU/mL were performed and evaluated 20 minutes, 6, 12, 24, 36, 48, 72 and 96 hours after the intradermal injection. A skin wheal (>7.0 mm in diameter) occurring after 20 minutes was qualified as immediate skin response, skin infiltration appear-ing between 6 - 12 hours as a late skin response and skin induration observed later than 48 hours was considered a delayed skin response [24].
Table 2. Allergens caused particular types of asthmatic response.
Allergen Concentration BU/mL
DYAR n = 23
IAR n = 14
LAR n = 16
DAR n = 17
Healthy subjects n = 25
Dermatophagoides pteronyss 1000 6 9 3 5 0
Dermatophagoides farinae 1000 1 1 2 0 0
Animal danders 0
Dog 3000 1 2 1 1 0
Cat 1000 1 1 1 2 0
Horse 2000 0 0 1 0 0
Hamster 2000 1 0 1 0 0
Aspergillus fumigatus 1000 1 0 1 1 0
Pollen 0
Grass mix I 1000 5 4 3 3 0
Grass mix II 1000 2 3 1 0 0
Tree mix 3000 1 1 0 1 0
Weed mix 1000 1 1 0 1 0
Birch 1000 2 1 1 1 0
Poplar 2000 1 0 0 1 0
Ragweed giant 1000 0 1 1 1 0
BU/mL = biologic units per 1 mL Grass pollen mix I = Dactylis glomerata, Lolium perenne, Phleum pratensis, Poa pratensis; Grass pollen mix II =
Festuca pratensis, Holcus lanatus, Agrostis alba, Anthoxanthum odoratum; Tree pollen mix = Betula pendula, Corylus avellana, Juniperus communis,
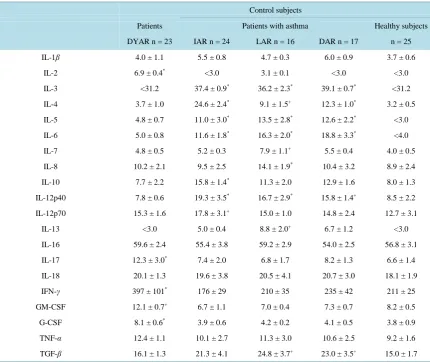
Table 3. Single determination of cytokine concentrations in the supernatants of peripheral blood cells stimulated “in vitro” by relevant allergens (pg/mL).
Control subjects
Patients Patients with asthma Healthy subjects
DYAR n = 23 IAR n = 24 LAR n = 16 DAR n = 17 n = 25
IL-1β 4.0 ± 1.1 5.5 ± 0.8 4.7 ± 0.3 6.0 ± 0.9 3.7 ± 0.6
IL-2 6.9 ± 0.4* <3.0 3.1 ± 0.1 <3.0 <3.0
IL-3 <31.2 37.4 ± 0.9* 36.2 ± 2.3* 39.1 ± 0.7* <31.2
IL-4 3.7 ± 1.0 24.6 ± 2.4* 9.1 ± 1.5+ 12.3 ± 1.0* 3.2 ± 0.5
IL-5 4.8 ± 0.7 11.0 ± 3.0* 13.5 ± 2.8* 12.6 ± 2.2* <3.0
IL-6 5.0 ± 0.8 11.6 ± 1.8* 16.3 ± 2.0* 18.8 ± 3.3* <4.0
IL-7 4.8 ± 0.5 5.2 ± 0.3 7.9 ± 1.1+ 5.5 ± 0.4 4.0 ± 0.5
IL-8 10.2 ± 2.1 9.5 ± 2.5 14.1 ± 1.9* 10.4 ± 3.2 8.9 ± 2.4
IL-10 7.7 ± 2.2 15.8 ± 1.4* 11.3 ± 2.0 12.9 ± 1.6 8.0 ± 1.3
IL-12p40 7.8 ± 0.6 19.3 ± 3.5* 16.7 ± 2.9* 15.8 ± 1.4+ 8.5 ± 2.2
IL-12p70 15.3 ± 1.6 17.8 ± 3.1+ 15.0 ± 1.0 14.8 ± 2.4 12.7 ± 3.1
IL-13 <3.0 5.0 ± 0.4 8.8 ± 2.0+ 6.7 ± 1.2 <3.0
IL-16 59.6 ± 2.4 55.4 ± 3.8 59.2 ± 2.9 54.0 ± 2.5 56.8 ± 3.1
IL-17 12.3 ± 3.0* 7.4 ± 2.0 6.8 ± 1.7 8.2 ± 1.3 6.6 ± 1.4
IL-18 20.1 ± 1.3 19.6 ± 3.8 20.5 ± 4.1 20.7 ± 3.0 18.1 ± 1.9
IFN-γ 397 ± 101* 176 ± 29 210 ± 35 235 ± 42 211 ± 25
GM-CSF 12.1 ± 0.7+ 6.7 ± 1.1 7.0 ± 0.4 7.3 ± 0.7 8.2 ± 0.5
G-CSF 8.1 ± 0.6* 3.9 ± 0.6 4.2 ± 0.2 4.1 ± 0.5 3.8 ± 0.9
TNF-α 12.4 ± 1.1 10.1 ± 2.7 11.3 ± 3.0 10.6 ± 2.5 9.2 ± 1.6
TGF-β 16.1 ± 1.3 21.3 ± 4.1 24.8 ± 3.7+ 23.0 ± 3.5+ 15.0 ± 1.7
DYAR = delayed asthmatic response; IAR = immediate/early asthmatic response; LAR = late asthmatic response; DAR = dual late asthmatic re-sponse; Values = mean ± SEM; Statistical significance as compared with healthy subject values: += p ≤ 0.05,*= p < 0.05; ∆= blood cells of the healthy subjects were stimulated with: D. pteronyssinus, Grass mix I, Grass, mix II dog and cat allergens.
2.5. Bronchial Provocation Tests (BPT)
The BPTs were performed by means of spirometry (Spirograph D-75 Lode, Groningen, The Netherlands) re-cording the FVC and FEV1 values. The aerosolized allergen extracts and PBS were inhaled using the Wieba-dener Doppel-Inhalator at an airflow of 10 L/min. The nebulizer output was 0.12 - 0.14 mL/min and the aerosol particles were of a median mass diameter of 2.8 - 3.6 µ. The BPTs, being a modification of the European stan-dard [27], were performed by the following schedule: 1) initial (baseline) values recorded at 0, 5 and 10 minutes; 2) PBS control values recorded at 0, 5 and 10 minutes after a 10-minute PBS inhalation; 3) inhalation of allergen aerosol for 2 × 5 minutes, with inserted spirometric value measurement, followed by the recording of the FEV1 and FVC values at 0, 5, 10, 20, 30, 45, 60, 90 and 120 minutes and the every hour up to 12th hour and every second hour during the 22nd and 38th, the 46th and 62nd and 72nd hour interval [23]-[26]. The PBS control chal-lenge was performed according the same schedule as that applied to the BPTs with allergens. A 5-day interval has always been inserted between the consecutive tests [23]-[26].
2.6. Determination of Cytokines
Samples of 6 mL heparinized peripheral blood were centrifuged at 1800 × gfor 5 minutes at 4˚C and plasma
Louis, USA), centrifuged at 2000 × gfor 10 minutes at 4˚C and re-suspended in RPMI 1640 with penicillin (100 IU/mL), streptomycin (100 µg/mL) and L-glutamine (2 mmol/L) at a concentration of 5 × 10⁶ leukocytes/mL. The cell viability was confirmed by trypan blue dye exclusion. The cell suspension was divided into 2 equal portions. The first portion stimulated with the allergen, identical to that causing the DYAR, in a concentration of 50 BU/mL and the second non-stimulated control portion were cultured for 24 hours at 37˚C under 5% CO2 in a
humidified incubator. The supernatants were collected by centrifugation at 2000 × g for 15 minutes and pro- cessed within 1 hour. The cytokines in the supernatants were determined by immunoassay (ELISA) kits, fol-lowing the manufacturers’ recommendations. All measurements were performed in duplicate. The detection lim-its in pg/mL are reported in parenthesis. The cytokines Il-1β (1.0), IL-2 (<3.0), IL-3 (31.2), IL-5 (3.0), IL-6 (4.0), IL-7 (0.1), IL-10 (<3.0),IL-13 (<3.0), IL-16 (31.2), GM-CSF (<3.0), G-CSF (0.8), TNF-α (6.0), TGF-β (6.0) were measured using the R & D System (Minneapolis/MN, USA) kits, IL-4 (0.6), IL-8 (1.3), IL-12p70 (2.1), IL-18 (9.2) and IFN-γ (1.0) by Bender MedSystems (Wien, Austria), IL-17 (<5.0) by BioSource International Inc (Camarillo, USA) and IL-12p40 (3.9) by Becton Dickinson (San Jose, USA) kits. The inter-assay as well as intra-assay coefficients of variations for these kits were less than 10%. The blood cells of the healthy controls were stimulated separately with D. pteronyssinus, Grass mix I + II, dog and cat allergens in concentrations of 50 BU/mL and the total mean cytokine values were then calculated.
2.7. Statistical Analysis
The initial and repeated DYAR and PBS controls were statistically analyzed by means of fitting polynomials to the mean curves over time; eight times points within 120 minutes and twenty-five times points up to 72 hours after the challenge. The hypotheses were tested by the generalized multivariate analysis of the variance model (MANOVA) [28].
The post-challenge cytokine values during the repeated DYAR and PBS controls in individual patients were compared with their pre-challenge values and evaluated by Wilcoxon matched-pair signed rank test. The mean post-challenge values of particular cytokines during the repeated DYARs were compared with the corresponding mean PBS values and evaluated by Mann-Whitney U test. A p value < 0.05 was considered to be statistically significant.
3. Results
The initial DYARs as well as the repeated DYARs, (Figure 1) were significantly positive both in the compari-son of the post-challenge with the pre-challenge FEV1 values (p < 0.001, p < 0.001 respectively) and as com-pared with the PBS control values (p < 0.001, p < 0.001, respectively). No significant differences were found between the initial and the repeated DYAR (p > 0.2) nor between the DYAR appearance and the individual al-lergens (p > 0.1) (Table 2).
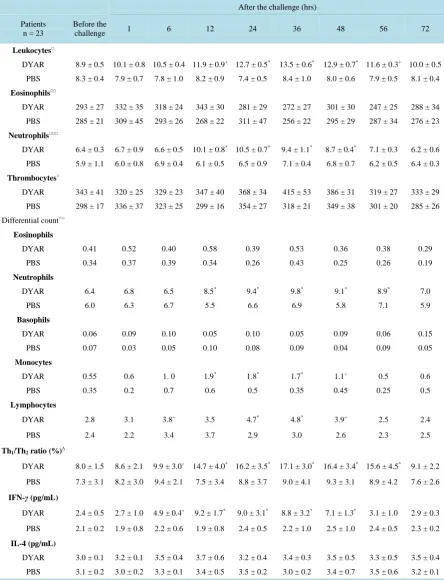
The DYAR was associated with decreased bronchial threshold in 73%, immediate skin response in 35% and delayed skin response in 57% (Table 1). The DYAR was accompanied by increased blood leukocyte, neutrophil, monocyte and lymphocyte counts, changed Th1/Th2 cell ratio in peripheral blood in favour of Th1 cells (p < 0.01) and increased intracellular concentration of IFN-γ (p < 0.01) but not of IL-4 (p > 0.05) (Table 4). The DYAR patients, as compared with healthy subjects, demonstrated increased concentrations of IL-2, IL-17, IFN-γ and G-CSF (p < 0.05) released by the allergen-stimulated blood cells “in vitro”. The cytokine profiles of the DYAR patients differed also from those measured in the control patients demonstrating IAR, LAR and DAR (Table 3). The DYAR was associated with following post-challenge cytokine concentrations released by peri-pheral blood cells stimulated “in vitro” with relevant allergens, as compared both with their pre-challenge and with the corresponding PBS control values: (I). A slight increase (p ≤ 0.05) in IL-13, G-CSF and a significant
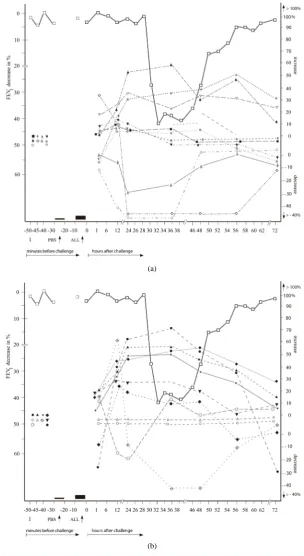
increase (p < 0.05) in IL-1β, IL-2, IL-8, IL-12p70, IL-18, IFN-γ, TNF-α; (II). A slight decrease (p ≤ 0.05) in
IL-5, GM-CSF, and a significant decrease (p < 0.05) in IL-4, IL-6, IL-17 (Table 5, Figures 2(a) and (b)). Most of these changes occurred 24 - 56 hours after the allergen challenge, which is the time of the maximal DYAR performance. No significant changes in the cytokine concentrations (p > 0.1) were found in supernatants during the PBS controls.
Control Subjects
Table 4. Differential count in peripheral blood and some cytokines in the serum during the DYAR and PBS.
After the challenge (hrs)
Patients n = 23
Before the
challenge 1 6 12 24 36 48 56 72
Leukocytes□
DYAR 8.9 ± 0.5 10.1 ± 0.8 10.5 ± 0.4 11.9 ± 0.9+ 12.7 ± 0.5* 13.5 ± 0.6* 12.9 ± 0.7* 11.6 ± 0.3+ 10.0 ± 0.5
PBS 8.3 ± 0.4 7.9 ± 0.7 7.8 ± 1.0 8.2 ± 0.9 7.4 ± 0.5 8.4 ± 1.0 8.0 ± 0.6 7.9 ± 0.5 8.1 ± 0.4
Eosinophils□□
DYAR 293 ± 27 332 ± 35 318 ± 24 343 ± 30 281 ± 29 272 ± 27 301 ± 30 247 ± 25 288 ± 34
PBS 285 ± 21 309 ± 45 293 ± 26 268 ± 22 311 ± 47 256 ± 22 295 ± 29 287 ± 34 276 ± 23
Neutrophils□□□
DYAR 6.4 ± 0.3 6.7 ± 0.9 6.6 ± 0.5 10.1 ± 0.8* 10.5 ± 0.7* 9.4 ± 1.1* 8.7 ± 0.4* 7.1 ± 0.3 6.2 ± 0.6
PBS 5.9 ± 1.1 6.0 ± 0.8 6.9 ± 0.4 6.1 ± 0.5 6.5 ± 0.9 7.1 ± 0.4 6.8 ± 0.7 6.2 ± 0.5 6.4 ± 0.3
Thrombocytes○
DYAR 343 ± 41 320 ± 25 329 ± 23 347 ± 40 368 ± 34 415 ± 53 386 ± 31 319 ± 27 333 ± 29
PBS 298 ± 17 336 ± 37 323 ± 25 299 ± 16 354 ± 27 318 ± 21 349 ± 38 301 ± 20 285 ± 26
Differential count○○
Eosinophils
DYAR 0.41 0.52 0.40 0.58 0.39 0.53 0.36 0.38 0.29
PBS 0.34 0.37 0.39 0.34 0.26 0.43 0.25 0.26 0.19
Neutrophils
DYAR 6.4 6.8 6.5 8.5* 9.4* 9.8* 9.1* 8.9* 7.0
PBS 6.0 6.3 6.7 5.5 6.6 6.9 5.8 7.1 5.9
Basophils
DYAR 0.06 0.09 0.10 0.05 0.10 0.05 0.09 0.06 0.15
PBS 0.07 0.03 0.05 0.10 0.08 0.09 0.04 0.09 0.05
Monocytes
DYAR 0.55 0.6 1. 0 1.9* 1.8* 1.7* 1.1+ 0.5 0.6
PBS 0.35 0.2 0.7 0.6 0.5 0.35 0.45 0.25 0.5
Lymphocytes
DYAR 2.8 3.1 3.8+ 3.5 4.7* 4.8* 3.9+ 2.5 2.4
PBS 2.4 2.2 3.4 3.7 2.9 3.0 2.6 2.3 2.5
Th1/Th2 ratio (%)∆
DYAR 8.0 ± 1.5 8.6 ± 2.1 9.9 ± 3.0+ 14.7 ± 4.0* 16.2 ± 3.5* 17.1 ± 3.0* 16.4 ± 3.4* 15.6 ± 4.5* 9.1 ± 2.2
PBS 7.3 ± 3.1 8.2 ± 3.0 9.4 ± 2.1 7.5 ± 3.4 8.8 ± 3.7 9.0 ± 4.1 9.3 ± 3.1 8.9 ± 4.2 7.6 ± 2.6
IFN-γ (pg/mL)
DYAR 2.4 ± 0.5 2.7 ± 1.0 4.9 ± 0.4+ 9.2 ± 1.7* 9.0 ± 3.1* 8.8 ± 3.2* 7.1 ± 1.3* 3.1 ± 1.0 2.9 ± 0.3
PBS 2.1 ± 0.2 1.9 ± 0.8 2.2 ± 0.6 1.9 ± 0.8 2.4 ± 0.5 2.2 ± 1.0 2.5 ± 1.0 2.4 ± 0.5 2.3 ± 0.2
IL-4 (pg/mL)
DYAR 3.0 ± 0.1 3.2 ± 0.1 3.5 ± 0.4 3.7 ± 0.6 3.2 ± 0.4 3.4 ± 0.3 3.5 ± 0.5 3.3 ± 0.5 3.5 ± 0.4
PBS 3.1 ± 0.2 3.0 ± 0.2 3.3 ± 0.1 3.4 ± 0.5 3.5 ± 0.2 3.0 ± 0.2 3.4 ± 0.7 3.5 ± 0.6 3.2 ± 0.1
DYAR = Delayed asthmatic response; PBS=Phosphate buffered saline (control); Values = mean ± SEM; Statistical significance as compared with healthy subject values: += p ≤ 0.05, *= p < 0.05, Automated counts: □= normal value 4.0 - 10.0 × 10⁹/L; □□= normal value <300 × 106/L; □□□= normal
Table 5.Cytokine released by peripheral blood cells (PMN and PBMC) stimulated “in vitro”with relevant allergens (means ± SEM) during the DYAR and PBS controls.
After the challenge (hrs)
Patients n = 23 Before the
challenge 1 12 24 36 48 56 72
IL-1β (pg/mL)
DYAR 4.1 ± 1.1 5.0 ± 0.7 6.8 ± 1.5* 7.0 ± 0.6* 6.9 ± 0.5+ 5.0 ± 0.2 5.1 ± 1.0 4.6 ± 0.7
PBS 2.9 ± 0.8 4.1 ± 0.8 4.2 ± 0.3 3.9 ± 0.5 3.4 ± 1.0 3.0 ± 0.5 3.5 ± 0.4 3.3 ± 0.2
IL-2 (pg/mL)
DYAR 6.9 ± 0.4 5.2 ± 0.1 9.6 ± 1.0* 11.3 ± 0.4* 11.8 ± 1.7* 10.4 ± 0.6* 8.9 ± 0.2* <3.0
PBS 4.8 ± 0.8 5.0 ± 0.9 7.1 ± 0.4 6.0 ± 0.3 4.8 ± 0.6 5.3 ± 0.2 4.9 ± 0.4 4.5 ± 0.4
IL-3 (pg/mL)
DYAR <31.2 <31.2 <31.2 32.1 ± 0.4 <31.2 <31.2 <31.2 <31.2
PBS <31.2 <31.2 <31.2 <31.2 <31.2 <31.2 <31.2 <31.2
IL-4 (pg/mL)
DYAR 3.7 ± 1.0 5.0 ± 0.7 4.1 ± 0.9 2.0 ± 0.3 <0.6* <0.6* <0.6* 3.3 ± 0.2
PBS 2.9 ± 0.3 2.7 ± 1.0 3.6 ± 0.8 3.4 ± 0.5 3.7 ± 0.6 2.2 ± 0.3 2.6 ± 0.8 2.5 ± 1.0
IL-5 (pg/mL)
DYAR 6.9 ± 1.0 6.7 ± 0.8 6.5 ± 1.3 5.0 ± 0.4+ 5.1 ± 0.7+ 6.3 ± 1.1 7.0 ± 1.0 6.4 ± 0.9
PBS 6.5 ± 0.3 7.5 ± 1.4 7.0 ± 0.7 7.0 ± 1.1 7.2 ± 0.6 7.1 ± 0.4 6.3 ± 0.5 6.6 ± 1.0
IL-6 (pg/mL)
DYAR 5.0 ± 0.8 5.8 ± 0.6 8.1 ± 1.1* 4.6 ± 0.4 <4.0* <4.0* 4.5 ± 0.4 5.0 ± 0.5
PBS 5.1 ± 0.5 5.1 ± 1.0 5.2 ± 0.6 5.9 ± 1.3 5.0 ± 1.0 5.4 ± 0.3 4.7 ± 0.5 4.5 ± 0.4
IL-7 (pg/mL)
DYAR 4.8 ± 0.5 5.7 ± 1.0 6.2 ± 0.8 6.5 ± 0.4 5.9 ± 1.0 6.6 ± 0.7 6.3 ± 0.4 5.8 ± 0.3
PBS 4.4 ± 0.4 4.9 ± 0.7 5.5 ± 0.9 4.8 ± 0.9 6.0 ± 1.0 6.3 ± 0.8 4.6 ± 0.5 5.3 ± 0.6
IL-8 (pg/mL)
DYAR 11.2 ± 2.1 13.6 ± 1.8 15.5 ± 1.0+ 16.9 ± 1.6* 17.0 ± 1.4* 15.8 ± 1.0* 14.9 ± 1.1+ 12.8 ± 1.1
PBS 10.5 ± 0.4 11.5 ± 0.6 12.4 ± 0.5 12.6 ± 1.0 13.0 ± 1.0 12.5 ± 0.7 11.5 ± 2.0 10.2 ± 1.0
IL-10 (pg/mL)
DYAR 10.9 ± 2.2 10.3 ± 0.5 11.5 ± 0.8 11.2 ± 0.3 11.4 ± 1.3 11.7 ± 0.5 11.0 ± 1.0 10.3 ± 0.4
PBS 9.5 ± 0.6 10.0 ± 0.3 9.8 ± 0.6 10.9 ± 1.1 11.0 ± 0.7 10.8 ± 0.6 9.7 ± 0.3 10.0 ± 0.7
IL-12p40 (pg/mL)
DYAR 11.7 ± 0.6 12.3 ± 1.1 12.6 ± 2.0 12.6 ± 0.9 11.5 ± 1.2 11.9 ± 0.7 11.6 ± 1.0 12.2 ± 0. 6
PBS 11.0 ± 1.4 12.0 ± 2.0 12.2 ± 1.0 11.7 ± 0.7 12.1 ± 2.0 11.5 ± 0.5 11.9 ± 0.8 11.4 ± 1.1
IL-12p70 (pg/mL)
DYAR 15.3 ± 1.6 15.7 ± 1.1 19.4 ± 2.1* 23.5 ± 2.5* 24.4 ± 2.6* 20.1 ± 3.0* 22.3 ± 1.8* 16.0 ± 1.0
Continued
IL-13 (pg/mL)
DYAR 5.7 ± 0.5 6.1 ± 0.8 7.2 ± 0.6+ 7.1 ± 0.4+ 6.3 ± 1.0 6.2 ± 1.0 5.5 ± 0.4 5.8 ± 0.6
PBS 5.0 ± 0.7 5.5 ± 1.0 7.3 ± 0.8 7.3 ± 1.0 6.6 ± 1.3 6.1 ± 1.2 5.9 ± 0.7 5.6 ± 0.4
IL-16 (pg/mL)
DYAR 59.6 ± 2.4 66.3 ± 3.7 68.0 ± 3.2 65.0 ± 2.9 58.6 ± 4.5 61.4 ± 3.1 58.5 ± 2.7 57.0 ± 2.5
PBS 60.7 ± 4.1 56.5 ± 3.0 57.7 ± 2.8 60.2 ± 3.3 59.9 ± 4.3 55.4 ± 3.8 61.2 ± 3.1 58.2 ± 2.9
IL-17 (pg/mL)
DYAR 12.3 ± 3.0 11.6 ± 2.8 7.4 ± 3.9+ <5.0* <5.0* 12.6 ± 1.5 12.9 ± 2.2 12.4 ± 2.1
PBS 12.0 ± 2.3 12.5 ± 3.1 11.4 ± 2.5 10.9 ± 2.2 11.7 ± 2.8 10.0 ± 2.6 11.5 ± 2.9 11.2 ± 1.5
IL-18 (pg/mL)
DYAR 20.1 ± 1.3 19.6 ± 1.0 23.4 ± 0.8 26.7 ± 1.5+ 27.5 ± 1.2* 28.0 ± 2.6* 30.1 ± 4.0* 26.3 ± 2.7
PBS 19.9 ± 0.6 20.0 ± 2.1 22.1 ± 2.0 21.8 ± 1.2 22.4 ± 0.9 21.9 ± 0.6 21.0 ± 0.4 20.2 ± 1.1
IFN-γ (pg/mL)
DYAR 385 ± 101 403 ± 111 538 ± 107+ 591 ± 122* 593 ± 120* 513 ± 94* 489 ± 106* 414 ± 108+
PBS 381 ± 97 377 ± 98 398 ± 90 345 ± 116 355 ± 121 358 ± 121 383 ± 95 374 ± 101
GM-CSF (pg/mL)
DYAR 12.1 ± 0.7 13.6 ± 0.5 10.3 ± 1.0 9.8 ± 1.2+ 9.9 ± 2.0 + 12.0 ± 0.9 12.5 ± 1.2 12.6 ± 0.7
PBS 11.4 ± 0.5 11.9 ± 0.8 12.5 ± 1.1 12.9 ± 1.0 11.8 ± 1.3 11.6 ± 0.5 11.8 ± 1.0 11.2 ± 0.9
G-CSF (pg/mL)
DYAR 7.1 ± 0.6 8.4 ± 1.0 8.9 ± 0.7+ 9.3 ± 2.2+ 9.0 ± 1.6+ 8.6 ± 0.7 7.5 ± 1.2 7.8 ± 1.1
PBS 7.8 ± 0.5 7.0 ± 0.4 7.9 ± 0.5 8.6 ± 1.1 8.0 ± 0.3 8.2 ± 1.4 8.5 ± 0.9 7.7 ± 0.9
TNF-α (pg/mL)
DYAR 12.4 ± 1.1 14.2 ± 0.9 17.8 ± 1.0* 18.5 ± 0.6* 18.8 ± 0.4* 19.0 ± 2.0* 17.7 ± 1.1* 16.1 ± 1.0+
PBS 13.0 ± 0.6 13.9 ± 1.1 14.4 ± 1.0 15.0 ± 1.3 14.7 ± 1.3 14.0 ± 2.0 15.0 ± 1.0 14.2 ± 0.7
TGF-β (pg/mL)
DYAR 17.9 ± 1.3 18.5 ± 2.2 19.7 ± 2.0 18.3 ± 1.0 19.1 ± 1.4 17.8 ± 1.5 18.4 ± 1.0 17.3 ± 0.5
PBS 18.3 ± 1.0 18.2 ± 0.6 19.5 ± 0.4 19.0 ± 1.0 20.2 ± 1.3 19.5 ± 0.7 18.9 ± 0.6 19.1 ± 0.4
DYAR = Delayed asthmatic response; PBS= Phosphate buffered saline (control); Values of cytokines = means ± SEM; Statistical significance of the cytokine concentrations as compared with their pre-challenge (baseline) values: += p ≤ 0.05; *= p < 0.05.
changes in the (pre-challenge) concentrations of various cytokines in the supernatants of the blood cells stimu-lated “in vitro” with relevant allergens, differing also from concentrations measured in the DYAR patients (Table 3).
4. Discussion
(a)
[image:10.595.160.465.85.642.2](b)
maturation of various cell types, represent important parts of the immunologic mechanisms [1] [4] [6] [9] [14] [16] [22] [29] [30]. Their role in the immunologic mechanisms underlying the allergic bronchial asthma has al-ready been investigated from various points of view [4] [6] [8]-[11] [14]-[20] [24] [25] [29]-[52].
In most of these studies, a single measurement of cytokines in bronchoalveolar lavage fluid (BAL), (induced) sputum or in the peripheral blood was performed [9]-[11] [17] [19] [32]-[34] [38] [40] [42] [43] [45]-[49] [51] [52]. Studies dealing with the cytokine determination after the allergen challenge, especially during the IAR, LAR or DAR, are not numerous [5] [6] [14] [15] [18] [20] [30] [31] [39] [41] [50]. The concentration changes of particular cytokines in asthma patients reported in the literature display relatively high variation. This result diversity is probably caused by factors related either to the investigated patient populations, such as different asthma phenotypes, extent of the diagnostic procedures and selection criteria or to the differences in the methods, such as medium studied, technique and timing of the material collection, bronchial provocation technique (inha-lational, intra-bronchial, segmental challenge), and the processing of collected material [2] [5]-[8] [14]-[20] [22] [24] [29] [30] [32] [38] [40] [41] [45] [52]. Usually, the concentrations of cytokines released by the circulating or airway-related cells into the peripheral blood by “in vivo” inhaled allergens are lower than the cytokine amounts released by “in vitro”stimulation of the isolated cells with various agents/factors [8] [15] [20]. The “in vitro”stimulation of the isolated blood or the airway-related cells, can be performed with non-specific agents, e.g. PHA , PMA, fMLP, LPS [9] [10] [17] [18] [32] [48], bacterial enterotoxin, other cytokines [6] [34]-[37] [39] [44] [46], or with allergens [6] [9] [33] [34] [38] [40] [42] [43] [45]-[49] [51] [52].
Of the “in vitro” techniques, the stimulation of isolated cells with allergens produces relatively limited cyto-kine amounts, stimulation with cytocyto-kines can release larger cytocyto-kine amounts, and the stimulation with non-specific agents generates the largest cytokines amounts [11] [24] [45] [46] [48] [49]. The differences in the released cytokine amounts can be explained by the mode of action of the stimulating agents. The stimulation with the non-specific, but very powerful, stimulating agents results in a direct release of the almost complete intracellular cytokine potential, including even those portions which would not be released upon natural allergen inhalation. In contrast, stimulation with specific allergens results in a selective release of a part of the total intracellular cytokine capacity only. Moreover, the stimulation of the isolated cells with allergen lacks a number of factors and mechanisms involved in the “in vivo” process, such as antigen presentation by the antigen pre-senting cells, synergic and antagonistic effects of other cells and factors in the bronchial tissue as well as in the peripheral blood, and concomitant effects of other cytokines and chemokines [1] [4] [6] [8] [14] [18] [21] [34].
The measurement of the cytokines released by the allergen-stimulated blood cells “in vitro”is important for the evaluation of the ratio of particular cytokines released by allergen stimulation with respect to their total intracellular capacity released by their stimulation with non-specific agents, and should be interpreted as a mod-el for studying of these processes. However, the cytokine determination in the natural media, such as blood or sputum, related to the allergen inhaled during the bronchial challenge would be more representative for the ge-nuine processes involved in the clinical bronchial asthma. This fact may be supported by our , not yet published, results of higher cytokine concentrations released after the “in vitro” stimulation with PMA than cytokine amounts recorded in plasma after the bronchial allergen challenge as well as by similar findings of other inves-tigators [40] [42] [45] [49]. Unfortunately, the discrepancy between the cytokine amounts released by the “in vivo” inhaled allergen and those released after the “in vitro” stimulation of the isolated BAL or peripheral blood cells with non-specific agents during particular asthmatic response types, has not yet been sufficiently investi-gated. Moreover, the cytokine profiles in the peripheral blood, BAL fluid or sputum as well as after stimulation of isolated blood cells with various agents, including allergens, in healthy subjects, which would served as ref-erence data, have as yet been insufficiently investigated [9] [29] [32] [47] [49].
blood cells released increased amount of IL-1β, IL-2, IL-8, IL-12p70, IL-13, IL-18, IFN-γ and TNF-α, while de-creased amounts of IL-4, IL-6 and IL-17 (Table 5). These cytokine profiles differed from those recorded in the serum during the DYAR [53]. These differences may probably lie in various, above mentioned, factors and me-chanisms participating in the cytokine release “in vivo”, but lacking in the “in vitro” processes. An interesting aspect was a prevalence of changes of pro-inflammatory cytokines.
The post-challenge cytokine profiles released by the allergen-stimulated blood cells during the DYAR dif-fered from other investigator findings reporting increased release of IL-1β, IL-4, IL-5, IL-6, IL-9, IL-10, IL-13, IL-16, IFN-γ, or TFN-α by blood mononuclear cells of asthmatics due to the stimulation with inhalant allergens. However, in most of these studies, only a limited cytokine number has been measured and even without any re-lation to a particular asthmatic response type [11] [33] [34] [38] [45]-[49]. The cytokine profiles reported in this study, together with our previous results [23]-[26] [53], especially with the significant changes in the Th1/Th2 ratio in peripheral blood in favour of Th1 cells, increased intracellular concentrations of IFN-γ and IL-2, but not those of IL-4 or IL-5, increased blood leukocyte, neutrophil and monocyte, but not eosinophil, counts, increased plasma levels of of LTB4 and MPO and serum concentration changes of various soluble adhesion molecules would suggest involvement of the cell-mediated hypersensitivity upon participation of Th1 lymphocytes, neu-trophils, monocytes, probably also macrophages, NK cells, epithelial and endothelial cells, in the DYAR. Nev-ertheless, more concurrent investigations should be performed to clarify the immunologic mechanisms underly-ing the DYAR.
References
[1] Holgate, S.T., Lemanske, R.F., O’Byrne, P.M., Kukumanu, S. and Busse, W.W. (2009) Asthma Pathogenesis. In: Ad- kinson, N.F., Bochner, B.S., Busse, W.W., Holgate, S.T., Lemanske, R.F. and Simons, F.E., Eds., Middleton’s Allergy,
Principles and Practice,7th Edition, Mosby-Elsevier, Philadelphia, 893-919.
[2] Green, R.H., Brightling, C.E. and Bradding, P. (2007) The Reclassification of Asthma Based on Subphenotypes. Cur- rent Opinion in Allergy and Clinical Immunology, 7, 43-50. http://dx.doi.org/10.1097/ACI.0b013e3280118a32
[3] Sheth, K.K. and Lemanske, R.F. (1995) The Early and Late Asthmatic Response to Allergen Challenge. In: Busse, W.W. and Holgate, S.T., Eds., Asthma and Rhinitis, Blackwell Scientific Publication, Oxford, 946-960.
[4] Borish, L. and Rosenwasser, L.J. (2009) Cytokines in Allergic Inflammation. In: Adkinson, N.F., Bochner, B.S., Busse, W.W., Holgate, S.T., Lemanske, R.F. and Simons, F.E., Eds., Middleton’s Allergy, Principles and Practice,7th Edi- tion, Mosby-Elsevier, Philadelphia, 165-179.
[5] Jarjour, N.N., Calhoun, W.J., Kelly, E.A., Gleich, G.J., Schwartz, L.B. and Busse, W.W. (1997) The Immediate and Late Allergic Response to Segmental Bronchopulmonary Provocation in Asthma. American Journal of Respiratory and Critical Care Medicine, 155, 1515-1521. http://dx.doi.org/10.1164/ajrccm.155.5.9154851
[6] Leonard, C., Tormey, V., Burke, C. and Poulter, L.W. (1997) Allergen-Induced Cytokine Production in Atopic Disease and Its Relationship to Disease Severity. American Journal of Respiratory Cell and Molecular Biology, 17, 368-375.
http://dx.doi.org/10.1165/ajrcmb.17.3.2797
[7] Pelikan, Z., Pelikan-Filipek, M., Kruis, M. and Berger, M.P.F. (1986) The Immediate Asthmatic Response to Allergen Challenge. Annals of Allergy, 56, 252-260.
[8] Pelikan, Z. and Pelikan-Filipek, M. (1986) The Late Asthmatic Response to Allergen Challenge—Part I and II. Annals of Allergy, 56, 414-420,421-435.
[9] Wong, C.K., Ho, C.Y., Ko, F.W.S., Chan, C.H.S., Ho, A.S.S., Hui, D.S.C. and Lam, C.W.K. (2001) Proinflammatory Cytokines (IL-17, IL-6, IL-18 and IL-12) and Th Cytokines (IFN-γ, IL-4, IL-10 and IL-13) in Patients with Allergic Asthma. Clinical & Experimental Immunology, 125, 177-183. http://dx.doi.org/10.1046/j.1365-2249.2001.01602.x
[10] Shirai, T., Suzuki, K., Inui, N., Suda, T., Chida, K. and Nakamura, H. (2003) Th1/Th2 Profile in Peripheral Blood in Atopic Cough and Atopic Asthma. Clinical & Experimental Allergy, 33, 84-89.
http://dx.doi.org/10.1046/j.1365-2222.2003.01578.x
[11] Smart, J.M. and Kemp, A.S. (2002) Increased Th 1 and Th 2 Allergen-Induced Cytokine Responses in Children with Atopic Diseases. Clinical & Experimental Allergy, 32, 796-802. http://dx.doi.org/10.1046/j.1365-2222.2002.01391.x
[12] Pelikan, Z., Pelikan-Filipek, M. and van Oers, J. (2001) The Early Asthmatic Response to Allergen Challenge (EAR) and Its Pharmacologic Modulation. Allergy, 56, 24.
[13] Pelikan, Z. (2001) The Effects of Various Drugs on the Late Asthmatic Response (LAR) to the Bronchial Challenge with Allergens [BPT]. Allergy, 56, 25.
Allergen-Induced Early and Dual Responders with Asthma. Journal of Allergy and Clinical Immunology, 115, 1004- 1009. http://dx.doi.org/10.1016/j.jaci.2005.02.003
[15] Gratziou, C., Carroll, M., Montefort, S., Teran, L., Howarth, P.H. and Holgate, S.T. (1996) Inflammatory and T-Cell Profile of Asthmatic Airways 6 Hours after Local Allergen Provocation. American Journal of Respiratory and Critical Care Medicine, 153, 515-520. http://dx.doi.org/10.1164/ajrccm.153.2.8564090
[16] Bodey, K.J., Semper, A.E., Redington, A.E., Madden, J., Teran, L.M., Holgate, S.T. and Frew, A.J. (1999) Cytokine Profiles of BAL T Cells and T-Cell Clones Obtained from Human Asthmatic Airways after Local Allergen Challenge.
Allergy, 54, 1083-1093. http://dx.doi.org/10.1034/j.1398-9995.1999.00889.x
[17] Majori, M., Corradi, M., Caminati, A., Cacciani, G., Bertacco, S. and Pesci, A. (1999) Predominant Th 1 Cytokine Pattern in Peripheral Blood from Subjects with Chronic Pulmonary Obstructive Disease. Journal of Allergy and Clini- cal Immunology, 103, 458-462. http://dx.doi.org/10.1016/S0091-6749(99)70471-9
[18] Liu, L., Jarjour, N.N., Busse, W.W. and Kelly, E.A.B. (2004) Enhanced Generation of Helper T Type 1 and 2 Chemo- kines in Allergen-Induced Asthma. American Journal of Respiratory and Critical Care Medicine, 169, 1118-1124.
http://dx.doi.org/10.1164/rccm.200312-1659OC
[19] Krug, N., Madden, J., Redington, A.E., Lackie, P., Djukanovic, R., Schauer, U., Holgate, S.T., Frew, A.J. and Horwath, P.H. (1996) T-Cell Cytokine Profile Evaluated as a Single Level in BAL and Blood in Allergic Asthma. American Journal of Respiratory Cell and Molecular Biology, 14, 319-326. http://dx.doi.org/10.1165/ajrcmb.14.4.8600935
[20] Till, S.J., Durham, S.R., Rajakulasingham, K., Humbert, M., Huston, D., Dickson, R., Kay, A.B. and Corringan, C.J. (1998) Allergen-Induced Proliferation and Interleukin-5 Production by Bronchoalveolar Lavage and Blood T Cells af- ter Segmental Allergen Challenge. American Journal of Respiratory Cell and Molecular Biology, 158, 404-411.
http://dx.doi.org/10.1164/ajrccm.158.2.9705007
[21] Umetsu, D.T., Akbari, O., DeKruyff, R.H., Shearer, W.T., Rosenwasser, L.J. and Bochner, B.S. (2003) Regulatory T Cells Control Development of Allergic Disease and Asthma. Journal of Allergy and Clinical Immunology, 112, 480-487.
http://dx.doi.org/10.1016/S0091-6749(03)01869-4
[22] Magnan, A.O., Mely, L.G., Camilla, C.A., Badier, M.M., Montero-Julian, F.S., Guillot, C.M., Casano, B.B., Prato, S.J., Fert, V., Bongrand, P. and Vervloet, D. (2000) Assesssment of the Th1/Th2 Paradigm in Whole Blood in Atopy and Asthma. American Journal of Respiratory and Critical Care Medicine, 161, 1790-1796.
http://dx.doi.org/10.1164/ajrccm.161.6.9906130
[23] Pelikan, Z., Pelikan-Filipek, M. and Oostenbrink, J.H. (1997) Delayed Asthmatic Response (DYAR), Its Clinical Features and Pharmacologic Modulation. Journal of Allergy and Clinical Immunology, 99, 321.
[24] Pelikan, Z. (2010) Delayed type of Asthmatic Response to Bronchial Challenge with Allergen, I: Clinical Features. Annals of Allergy, Asthma & Immunology, 104, 394-404. http://dx.doi.org/10.1016/j.anai.2010.03.014
[25] Pelikan, Z. (2011) Delayed Asthmatic Response: A New Phenotype of Bronchial Response to Allergen Challenge and Soluble Adhesion Molecules in the Serum. Annals of Allergy, Asthma & Immunology, 106, 119-130.
http://dx.doi.org/10.1016/j.anai.2010.11.002
[26] Pelikan, Z. (2011) Delayed Asthmatic Response to Bronchial Challenge with Allergen-Mediators, Eicosanoids, Eosi- nophil and Neutrophil Constituents in the Blood and Urine. Respiration, 82, 225-236.
http://dx.doi.org/10.1159/000324542
[27] Melillo, G., Bonini, S., Cocco, G., Davies, R.J., De Monchy, J.G.R., Frølund, L. and Pelikan, Z. (1997) Provocation Tests with Allergens. Allergy, 52, 5-35. http://dx.doi.org/10.1111/j.1398-9995.1997.tb04814.x
[28] Houd, D.J. and Taylor, C.C. (1987) Multivariate Analysis of Variance and Repeated Measures. Chapman and Hall, London.
[29] Härtel, C., Adam, N., Strunk, T., Temming, P., Müller-Steinhardt, M. and Schultz, C. (2005) Cytokine Responses Cor- relate Differentially with Age in Infancy and Early Childhood. Clinical and Experimental Immunology, 142, 446-453. [30] Matsumoto, K., Gauvreau, G.M., Rerecich, T., Watson, R.M., Wood, L.J. and O’Byrne, P.M. (2002) IL-10 Production in Circulating T Cells Differs between Allergen-Induced Isolated Early and Dual Asthmatic Responders. Journal of Allergy and Clinical Immunology, 109, 281-286. http://dx.doi.org/10.1067/mai.2002.121144
[31] Kawayama, T., O’Byrne, P.M., Watson, R.M., Killian, K.J., Duong, M., Yoshida, M. and Gauvreau, G.M. (2006) Effects of Inhaled Ciclesonide on Circulating T-Helper Type 1/T-Helper Type 2 Cells in Atopic Asthmatics after Allergen Challenge. Clinical & Experimental Allergy, 36, 1417-1424. http://dx.doi.org/10.1111/j.1365-2222.2006.02592.x
[32] Terashima, T., Amakawa, K., Matsumaru, A., van Eeden, S., Hogg, J.C. and Yamaguchi, K. (2001) BAL Induces an In- crease in Peripheral Blood Neutrophils and Cytokine Levels in Healthy Volunteers and Patients with Pneumonia. Chest,
119, 1724-1729. http://dx.doi.org/10.1378/chest.119.6.1724
Molecular Biology, 33, 105-111. http://dx.doi.org/10.1165/rcmb.2005-0100OC
[34] Smithgall, M.D., Comeau, M.R., Park Yoon, B.R., Kaufman, D., Armitage, R. and Smith, D.E. (2008) IL-33 Amplifies both Th1- and Th2-Type Responses through Its Activity on Human Basophils, Allergen-Reactive Th2 Cells, iNKT and NK Cells. International Immunology, 20, 1019-1030. http://dx.doi.org/10.1093/intimm/dxn060
[35] Mathy, N.L., Scheuer, W., Lanzendörfer, M., Honold, K., Ambrosius, D., Norley, S. and Kurth, R. (2000) Interleukin-16 Stimulates the Expression and Production of Pro-Inflammatory Cytokines by Human Monocytes. Immunology, 100, 63-69. http://dx.doi.org/10.1046/j.1365-2567.2000.00997.x
[36] McFadden, C., Morgan, R., Rahangdale, S., Green, D., Yamasaki, H., Center, D. and Cruikshank, W. (2007) Preferen- tial mIGRATION of T Regulatory Cells Induced by IL-16. Journal of Immunology, 179, 6439-6445.
[37] Strengell, M., Matikainen, S., Siren, J., Lehtonen, A., Foster, D., Julkunen, I. and Sareneva, T. (2003) IL-21 in Synergy with IL-15 or IL-18 Enhances IFN-γ Production in Human NK and T Cells. Journal of Immunology, 170, 5464-5469. [38] Kimura, M., Tsuruta, S. and Yoshida, T. (1999) Differences in Cytokine Production by Peripheral Blood Mononuclear
Cells (PBMC) between Patients with Atopic Dermatitis and Bronchial Asthma. Clinical & Experimental Immunology,
118, 192-196. http://dx.doi.org/10.1046/j.1365-2249.1999.01055.x
[39] Varga, E.M., Wachholtz, P., Nouri-Aria, K.T., Verhoef, A., Corrigan, C.J., Till, S.J. and Durham, S.R. (2000) T Cells from Human Allergen-Induced Late Sthmatic Responses Express IL-12 Receptor β2 Subunit mRNA and Respond to IL-12 in Vitro. Journal of Immunology, 165, 2877-2885.
[40] Moverare, R., Elfman, L., Moverare, R., Stalenheim, G. and Björnsson, E. (2000) Study of the Th1/Th2 Balance, In- cluding IL-10 Production, in Cultures of Peripheral Blood Mononuclear Cells from Birch-Pollen-Allergic Patients. Allergy,
55, 171-175. http://dx.doi.org/10.1034/j.1398-9995.2000.00244.x
[41] Lim, S., John, M., Seybold, J., Taylor, D., Witt, C., Barnes, P.J. and Chung, K.F. (2000) Increased Interleukin-10 and Macrophage Inflammatory Protein-1α Release from Blood Monocytes ex Vivo during Late-Phase Response to Allergen in Asthma. Allergy, 55, 489-495. http://dx.doi.org/10.1034/j.1398-9995.2000.00483.x
[42] Contreras, J.P., Ly, N.P., Gold, D.R., He, H., Wand, M., Weiss, S.T., Perkins, D.L., Platts-Mills, T.A.E. and Finn, P.W. (2003) Allergen-Induced Cytokine Production, Atopic Disease, IgE and Wheeze in Children. Journal of Allergy and Clinical Immunology, 112, 1072-1077. http://dx.doi.org/10.1016/j.jaci.2003.08.036
[43] Böttcher, M.F., Bjurström, J., Mai, X.M., Nilsson, L. and Jenmalm, M.C. (2003) Allergen-Induced Cytokine Secretion in Atopic and Non-Atopic Asthmatic Children. Pediatric Allergy and Immunology, 14, 345-350.
http://dx.doi.org/10.1034/j.1399-3038.2003.00061.x
[44] John, M., Lim, S., Seybold, J., Jose, P., Robichaud, A., O’Connor, B., Barnes, P.J. and Chung, K.F. (1998) Inhaled Corti- costeroids Increase Interleukin-10 but Reduce Macrophage Inflammatory Protein-1α, Granulocyte-Macrophage Colony Stimulating Factor and Interferon-γ Release from Alveolar Macrophages in Asthma. American Journal of Respiratory and Critical Care Medicine, 157, 256-262. http://dx.doi.org/10.1164/ajrccm.157.1.9703079
[45] Noma, T., Sugawara, Y., Ogawa, N., Saeki, T., Yamaguchi, K. and Kawano, Y. (2004) Dermatophagoides-Induced In- terleukin-10 Production by Peripheral Blood Lymphocytes from Patients with Asthma in Remission. Pediatric Allergy and Immunology, 15, 459-468. http://dx.doi.org/10.1111/j.1399-3038.2004.00176.x
[46] Pinsonneault, S., El Bassam, S., Mazer, B., Cruikshank, W. and Laberge, S. (2001) IL-16 Inhibits IL-5 Production by Antigen-Stimulated T Cells in Atopic Subjects. Journal of Allergy and Clinical Immunology, 107, 477-482.
http://dx.doi.org/10.1067/mai.2001.112373
[47] Xystrakis, E., Kusumakar, S., Boswell, S., Peek, E., Urry, Z., Richards, D.F., Adikibi, T., Pridgeon, C., Dallman, M., Loke, T.K., Robinson, D.S., Barrat, F.J., O’Garra, A., Lavender, P., Lee, T.H., Corrigan, C. and Hawrylowicz, C.M. (2006) Reversing the Defective Induction o f IL-10-Secreting Regulatory T Cells in Glucocorticoid-Resistant Asthma Patients. Journal of Clinical Investigation, 116, 146-155. http://dx.doi.org/10.1172/JCI21759
[48] Clough, J.B., Keeping, K.A., Edwards, L.C., Freeman, W.M., Warner, J.A. and Warner, J.O. (1999) Can We Predict Which Wheezy Infants Will Continue to Wheeze? American Journal of Respiratory and Critical Care Medicine, 160, 1473-1480. http://dx.doi.org/10.1164/ajrccm.160.5.9807019
[49] Lenarczyk, A., Helsloot, J., Farmer, K., Peters, L., Sturgess, A. and Kirkham, B. (2000) Antigen-Induced IL-17 Re- sponse in the Peripheral Blood Mononuclear Cells (PBMC) of Healthy Controls. Clinical & Experimental Immunology,
122, 41-48. http://dx.doi.org/10.1046/j.1365-2249.2000.01328.x
[50] Thunberg, S., Gafvelin, G., Nord, M., Grönneberg, R., Grunewald, J., Eklund, A. and van Hage, M. (2010) Allergen Provocation Increases Th2-Cytokines and FOXP3 Expression in the Asthmatic Lungs. Allergy, 65, 311-318.
http://dx.doi.org/10.1111/j.1398-9995.2009.02218.x
[51] El Bassam, S., Pinsonneault, S., Kornfeld, H., Ren, F., Menezes, J. and Lagerge, S. (2006) Interleukin-16 Inhibits In- terleukin-13 Production by Allergen-Stimulated Blood Mononuclear Cells. Immunology, 117, 89-96.
[52] Jenmalm, M.C., Van Snick, J., Cormont, F. and Salman, B. (2001) Allergen-Induced Th1 and Th2 Cytokine Secretion in Relation to Specific Allergen Sensitization and Atopic Symptoms in Children. Clinical & Experimental Allergy, 31, 1528-1535. http://dx.doi.org/10.1046/j.1365-2222.2001.01190.x
[53] Pelikan, Z. (2012) Delayed Type of Asthmatic Response to Allergen Challenge and Cytokines in the Peripheral Blood.
Respiration, 84, 385-395. http://dx.doi.org/10.1159/000335258
[54] Sterk, P.J., Fabbri, L.M., Quanjer, Ph.H., Cockroft, D.W., O’Byrne, P.M., Anderson, S.D., Juniper, J.F. and Malo, J.L. (1993) Airway Responsiveness-Standardized Challenge Testing with Pharmacological, Physical and Sensitizing Sti- muli in Adults. European Respiratory Journal, 6, 53-83. http://dx.doi.org/10.1183/09041950.053s1693