Segmentation of Complementary DNA Microarray
Images using Marker-Controlled Watershed Technique
Aliaa Saad El-Gawady
Mohamed Meselhy Eltoukhy
Faculty of Computers and Informatics, Suez Canal University, Ismailia, 41522, Egypt
Faculty of Computers and Informatics, Suez Canal University, Ismailia, 41522, Egypt
Ghada El-Tawel
M.E. Wahed
Faculty of Computers and Informatics, Suez Canal University, Ismailia, 41522, Egypt
Faculty of Computers and Informatics, Suez Canal University, Ismailia, 41522, Egypt
ABSTRACT
DNA microarray image processing becomes a viable branch of bioinformatics, its importance stems from the fact that it allows viewing and measuring tens of thousands of genes concurrently. Many techniques were introduced to develop and improve the mission of processing DNA microarray images. The aim of this study is to make a segmentation of the cDNA microarray images. The Marker Controlled Watershed technique is used to segment the DNA microarray spots. The proposed method starts with preprocessing step; i.e. denoising and histogram equalization. Then, the spots are segmented from its background. The used images in this paper were obtained from Stanford Microarray Database (SMD). The obtained results of the developed method are compared to the results of K-means clustering method and fuzzy c-means clustering method. We can conclude that the Marker Controlled Watershed technique is efficient for segmenting the cDNA microarray images.
Keywords
cDNA Microarray Images, Image Segmentation, Marker Controlled Watershed
1.
INTRODUCTION
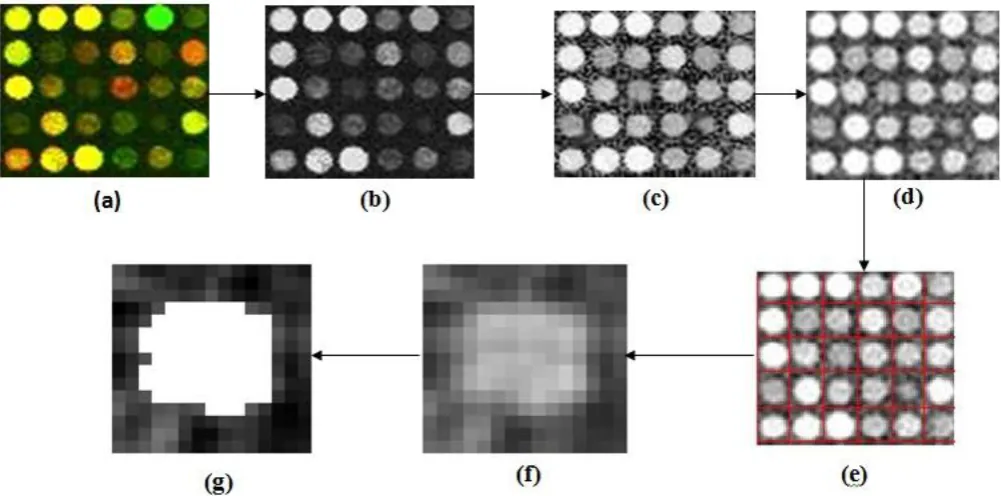
cDNA microarray image processing has an important role in the bioinformatics research, It has the ability to monitor and measure tens of thousands of genes concurrently [1, 2], so it can be used for several applications such as the diagnosis and the treatments of the diseases [3, 4]. cDNA microarray image processing consist of three main stages: the first stage is the gridding (addressing). It is the process of partitioning the microarray image into regions (cells), each cell consist of only one spot and its background. The second stage is the segmentation; it is the process of segmenting each cell into two parts, the foreground (spot) and the background. The third stage is the intensity extraction, this stage measures and computes the intensity for each spot [5, 6]. Figure (1) shows flowchart that describes the cDNA microarray image processing steps.
[image:1.595.318.543.253.425.2]cDNA microarray image contains arrays of spots in the form of sub grids, each sub grid has equal number of spots and they are arranged in a regular way where each sub grid has the same distance from the others [7, 8]. Figure (2) shows an example of cDNA microarray image, sub grid, cell, and spot.
Fig. 1: Processing steps of cDNA microarray image
Fig. 2: cDNA Microarray Image
Intensity extraction Segmentation
[image:1.595.319.541.351.697.2]Segmentation of cDNA microarray image is a challenging task; it has a great impact in the next stage. Microarray image segmentation is a difficult task due to the differences in image contrast from one experiment to another and the image malformation and noise [9]. Various methods see, e.g., [10, 11], and [12], have been implemented to segment microarray images. Fixed circle segmentation method [13] is the simplest one, where all spots are considered to be circular with the same size. An adaptive circle segmentation method is also used where the spots are considered to be circular but the diameter is estimated separately for each spot. Histogram-based technique is used by computing a threshold value using Mann-Whitney test, where Mann-Whitney use a circular tar- get mask to cover all the foreground pixels, and compute a thresh- old. The pixels with intensity lower than the threshold value is considered as background and the pixels with intensity value higher than the threshold value is considered as foreground [14]. Adaptive shape segmentation is also used. This method doesn’t require a fixed size or a fixed shape of the spots, the most commonly method for this technique is the seeded region growing (SRG). It depends on the selection of a seed point [15]. Clustering methods have been employed for segmenting the microarray images such as K-means and Fuzzy C-means. The main idea behind the clustering algorithm is to group the pixels into clusters [16, 17]. In this paper, the Marker Controlled watershed technique is used to segment the cDNA microarray spot from its background. In geography, a watershed is considered as the ridge that splits regions drained by different river systems. A catchment basin is the geographical region draining into a river or reservoir. The watershed transform implement these ideas to gray-scale image processing [18] in a way that can solve a lot of image segmentation problems. Segmentation by watershed method is fast, reliable and extensively employed in image processing and analysis [19]. Watershed is included in adaptive shape segmentation and it is a powerful technique where it combines the frontier approach and the region approach, watershed makes a fast detection of both edges and regions. This article is organized as it follows: Section (2) introduces the proposed approach. Section (3) presents the results and discussion, while section (4) gives the conclusion and future directions.
2.
PROPOSED APPROACH
In this section the Marker Controlled Watershed technique for segmenting the cDNA microarray images is introduced. The images were obtained from Stanford Microarray Database (SMD). Firstly, we begin by cropping sub-images from the original images and convert it to a gray scale. Then the histogram equalization is used to enhance the contrast of sub-images, and the wiener filter is used to remove the noise as a preprocessing step [20, 21]. It has a great impact and enhances the accuracy of the segmentation step.
Secondly, the gridding step, it divides the image into cells. Each cell consists of the spot and its background. In this step the mean intensity was computed for each column of the sub-image, which helps to identify the centers of the spots and to determine the gaps between the spots. The spots don’t have the same size and have different intensities, so the horizontal profile is irregular. The autocorrelation function computed to improve the self-similarity of the profile. The smooth result enhances the peak finding and the estimation of the spot spacing. Each peak region was numbered, and the centroids of the peaks were determined. It is then considered as the horizontal centers of the spots. The mid-points between
estimation for spot spacing on the vertical grid has been done. In order to do the same for the horizontal grid, The image transposed and all the steps used overhead were repeated [22]. Finally, each cell extracted individually, where each spot coordinates were detected. Now the Marker Controlled Watershed method applied on each extracted cell to segment the spot from its background as described by the following steps:
(1) The gradient magnitude (GM) is used as the segmentation function, which is given by
𝐺𝑀 = 𝐼𝑥2− 𝐼𝑦2 (1)
where 𝐼𝑥 is the filtered image and 𝐼𝑦 is the filtered transposed image. The gradient magnitude is obtained by applying the Sobel operator.
(2) The foreground object is marked using morphological reconstruction.
(3) The regional maxima are calculated to obtain good foreground markers.
(4) The Background marker is computed. (5) The watershed Transform is Computed.
𝑊 𝑓 = 𝑋 ∩ ∪ 𝐶 𝑀𝑖𝑛𝑟𝑒𝑔 𝑐
,
where X represents connected domain of the image f , 𝑀𝑖𝑛𝑟𝑒𝑔
is the regional minimum, 𝐶 𝑀𝑖𝑛𝑟𝑒𝑔 is the catchment basin.
Figure (3) shows the stages of the proposed method.
3.
RESULTS AND DISCUSSION
In this paper a sample consisting of 10 images we begin to apply used, which obtained from SMD, and cropped in a random way 5 sub-images from each image, each sub-image contains 5×6 spots (30) spots. The Marker Controlled Watershed technique applied on all 150 spots for each image. In the evaluation stage the accuracy of the proposed method computed and compared its results with two other methods namely, the fuzzy c-means and the K-means methods. The reason behind choosing such methods in comparison because they are considered two of the most recent methods used for segmenting the cDNA microarray images and they are efficient and robust for segmentation [16, 17]. In order to evaluate the performance of the proposed method we calculate the following criteria:
The Peak Signal to Noise Ratio (PSNR):
which is calculated [23] by using equation (2), where (MSE) is the Mean Square Error which is calculated by using equation (3), where 𝑥𝑗 ,𝑘 is the extracted spot, 𝑥´𝑗 ,𝑘 is the
segmented spot, and N×M is the size of the segmented image. 𝑃𝑆𝑁𝑅 = 10𝑙𝑜𝑔 255 𝑀𝑆𝐸2, (2)
where
𝑀𝑆𝐸 =𝑀𝑁1 𝑀𝑗 =1 𝑁𝑘=1(𝑥𝑗 ,𝑘 − 𝑥´𝑗 ,𝑘 )2 , (3)
Structural Content (SC):
Which is calculated see [23] by equation (4), where 𝑥𝑗 ,𝑘 is the
extracted spot, 𝑥´𝑗 ,𝑘 is the segmented spot, and N, M is the size
of the segmented image. 𝑆𝐶 = 𝑀𝑗 =1 𝑁𝑘=1(𝑥𝑗 ,𝑘 )2
(
𝑁 𝑘=1 𝑀
Fig. 3. Stages of the Proposed Method: Image (a) is the cDNA microarray subimage, (b) is the gray scale image, (c) is the enhanced image, (d) is the denoised image, (e) the gridded image, (f) the extracted cell (spot and its background), and (g) is the
segmented spot.
Normalized Correlation Coefficient (NK):
Which is calculated [23] by equation (5), where 𝑥𝑗 ,𝑘 is the
extracted spot, 𝑥´𝑗 ,𝑘 is the segmented spot, and N, M is the
size of the segmented image. 𝑁𝐾 = 𝑀𝑗 =1 𝑁𝑘=1|𝑥𝑗 ,𝑘 −𝑥´𝑗 ,𝑘 |
𝑥𝑗 ,𝑘 𝑁 𝑘=1 𝑀
𝑗 =1 (5)
The results of using such three evaluation criteria show that the Marker Controlled Watershed is the most efficient when compared with other methods. The results show that the Marker Controlled Watershed method produce better results rather than the K-means method in all spots, and the Marker Controlled Watershed method produce better results rather than the fuzzy c-mean in 105 spots and produce equal results with the fuzzy c-means in 23 spots, and less values in 22 spots.
Table (1) represents the average results for the three evaluation criteria and the average time elapsed for segmenting the spots using the proposed method and the other two methods for all 150 spots. Samples of the results of using equations (2), (4), and (5) are shown in Table (2).
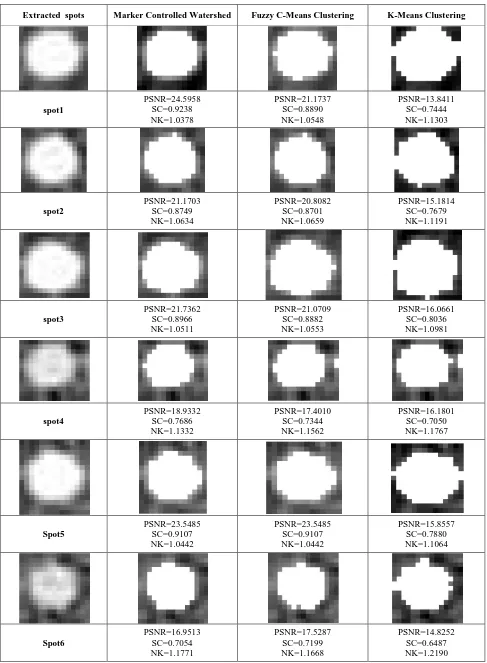
Comparative segmentation results for 6 different cells, extracted from cDNA microarray image, are presented in table (2). The first column indicates the original extracted spots with the surrounding area, the second column indicates the segmentation spots with Marker Controlled Watershed and the values of PSNR, SC, and NK, the third column indicates the segmentation spots with the fuzzy c-means method and its result, and the fourth column indicates the segmentation spots with the K-means method and its result. From the results displayed in table (2) one could conclude that the proposed method produce better results rather than the K- means, and the fuzzy c-means method. The results illustrate that the Marker Controlled Watershed method is efficient, reliable and fast for segmenting the cDNA microarray images.
Table 1. A summary of evaluation results average for segmenting a sample consisting of 150 Different Spots and
the average time elapsed for segmenting the spots. Columns from left to right indicate the Marker Controlled
Watershed, fuzzy c-means, and K-means clustering methods respectively
Marker Controlled Watershed
Fuzzy C-Means Clustering
K-Means Clustering
PSNR=18.44472 SC=0.75541 NK=1.15116 time= 0.23121
seconds
PSNR=18.07000 SC=0.74906 NK=1.15543 time= 0.11953
seconds
PSNR=13.85629 SC=0.64287 NK=1.24143 time= 0.11769
seconds
4.
CONCLUSION
[image:3.595.309.549.432.582.2]Table 2. Sample of the obtained segmentation results for 6 different spots. The first column from left to right indicates the original extracted spot, while the 2nd, 3rd, and 4th columns represents the segmentation results of the Marker Controlled
Watershed, fuzzy c-means, and K-means clustering methods, respectively
Extracted spots Marker Controlled Watershed Fuzzy C-Means Clustering K-Means Clustering
spot1
PSNR=24.5958 SC=0.9238 NK=1.0378
PSNR=21.1737 SC=0.8890 NK=1.0548
PSNR=13.8411 SC=0.7444 NK=1.1303
spot2
PSNR=21.1703 SC=0.8749 NK=1.0634
PSNR=20.8082 SC=0.8701 NK=1.0659
PSNR=15.1814 SC=0.7679 NK=1.1191
spot3
PSNR=21.7362 SC=0.8966 NK=1.0511
PSNR=21.0709 SC=0.8882 NK=1.0553
PSNR=16.0661 SC=0.8036 NK=1.0981
spot4
PSNR=18.9332 SC=0.7686 NK=1.1332
PSNR=17.4010 SC=0.7344 NK=1.1562
PSNR=16.1801 SC=0.7050 NK=1.1767
Spot5
PSNR=23.5485 SC=0.9107 NK=1.0442
PSNR=23.5485 SC=0.9107 NK=1.0442
PSNR=15.8557 SC=0.7880 NK=1.1064
Spot6
PSNR=16.9513 SC=0.7054 NK=1.1771
PSNR=17.5287 SC=0.7199 NK=1.1668
5.
REFERENCES
[1] Sarhan A.M. 2010. A novel gene-based cancer diagnosis with wavelets and support vector machines. European Journal of Sci- entific Research. 46(4), 488-502.
[2] Athanasiadis E., Cavouras D., Kostopoulos S., Glotsos D., Kalatzis I., Nikiforidis G. 2011. A wavelet-based markov ran- dom field segmentation model in segmenting microarray ex- periments. Computer Methods and Programs in Biomedicine. 104(3), 307-315. [3] Sarhan A.M. 2009. Cancer classification based on microarray gene expression data using DCT and ANN. Journal of Theo- retical and Applied Information Technology (JATIT). 6(2), 208- 216.
[4] Manjunath S.S., Shreenidhi B.S., Nagaraja J., Pradeep B.S. 2013. Morphological spot detection and analysis for microarray images. International Journal of Innovative Technology and Ex- ploring Engineering (IJITEE), New Delhi, India. 2(5), 189-193.
[5] Giannakeas N., Karvelis P.S. and Fotiadis D.I. 2008. A classification-based segmentation of cDNA microarray im- ages using support vector machine. 30th Annual International IEEE EMBS Conference Vancouver, British Columbia, Canada. (2008), 875-878.
[6] Deepa J., Thomas T. 2009. Automatic gridding of DNA microarray images using optimum subimage. International Journal of Recent Trends in Engineering. 1(4), 37-40.
[7] Athanasiadis E.I., Cavouras D.A., Spyridonos P.P., Glotsos D.Th., Kalatzis I.K., Nikiforidis G.C. 2009. Complementary DNA microarray image processing based on the Fuzzy Gaussian mixture model. IEEE Transaction on Information Technology in Biomedicine. 13(4), 419-425.
[8] Park C., Lee K. and Lee S. 2004. Automatic Microarray Image Segmentation Based on Watershed Transformation. 17th Inter- national Conference on Pattern Recognition (ICPR’04), Cam- bridge, UK.(Aug. 23-26 2004), 786-789.
[9] Demirkaya O., Asyali M.H., Shoukri M. M. 2005. Segmentation of cDNA microarray spots using Markov random field modeling. Bioinformtics. 21(13), 2994-3000.
[10] Yang Y.H., Buckley M.J., Dudoit S., Speed T.P. 2002. Comparison of methods for image analysis on cDNA microarray data. Journal of Computational Graphical Statistics. 11, 108- 136.
[11] Athanasiadis E.I., Cavouras D.A., Glotsos D.Th., Georgiadis P.V., Kalatzis I.K., Nikiforidis G.C. 2009.
Segmentation of complementary DNA microarray images by wavelet-based Markov random field model. IEEE Transactions on Information Technology in Biomedicine. 13(6), 1068-1074.
[12] Qin L., Rueda L., Ali A., Ngom A. 2005. Spot detection and image segmentation in DNA microarray data. Applied Bioinformatics. 4, 1-11.
[13] Eisen M.B. 2013. ScanAlyze, Available: http://rana.lbl.gov/EisenSoftware.htm
[14] Chen Y., Dougherty E.R., Bittner M.L. 1997. Ratio-based decisions and the quantitative analysis of cDNA microarray images. Journal of Biomedical Optics. 2(4), 364-374 .
[15] Adams R., Bischof L. 1994. Seeded region growing. IEEE Transactions on Pattern Analysis and Machine Intelligence. 16(6), 641-647.
[16] Uslan V., Bucak I.O. 2010. Microarray image segmentation using clustering methods. Mathematical and Computational Ap- plications. 15(2), 240-247. [17] Maguluri L.P., Rajapanthula K., Srinivasu P.N. 2013. A
com- parative analysis of clustering based segmentation algorithms in microarray images. International Journal of Emerging Science and Engineering (IJESE). 1(5), 27-32. [18] Gonzalez R.C., Woods R.E., Eddins S.L. 2009. Digital
Image Processing Using Matlab, second ed., USA, 2009. [19] EL-Allaoui A., Nasri M. 2012. Medical image
segmentation by Marker-controlled Watershed and mathematical morphol- ogy. The International Journal of Multimedia Its Applications (IJMA). 4(3), 245-254. [20] Baraniak R., Neelamani R. Weiner Filtering.from
http://www.owlnet.rice.edu/
elec539/Projects99/BACH/proj2/wi ener.html
[21] Kumar S., Kumar P., Gupta M., Nagawat A.K. 2010. Performance comparison of median and wiener filter in image denoising. International Journal of Computer Applications. 12(4), 27- 31.
[22] Nagesh A.S., Varma G.P.S., Govardhan A. 2010. An Improved Iterative Watershed and Morphological Transformation Techniques for Segmentation of Microarray Images. Computer Aided Soft Computing Techniques for Imaging and Biomedical Applications. 2, 77-87.