6
I
January 2018
Cancer Identification VIA Weighted Entropy
Method and Decision Tree Method
1
Deepa Grover, 2Dr. Sonica Sondhi, 3 Dr. Nidhika Birla
1
Research scholar Ik GPTU, Jalandhar 2
Assistant Professor, Chandigarh group of colleges Landran, Mohali 3
Assistant Professor, Department of Electronics Haryana Engineering College, Jagadhri, Haryana
Abstract: DNA sequence classification is a challenging problem of central importance to genomic research. A number of algorithms have been developed for this problem and implemented as systems that are in widespread use today. In this article, we discuss two systems to predict cancer based on the signal processing of the DNA sequence. In the first method, a system is proposed to predict cancer from DNA sequence through an efficient concept of weighted entropy that takes both entropy and total correlation into consideration. Here, a measure, named as weighted entropy is used which captures the distribution and correlation information of a DNA sequence. In the second method, a decision tree based cancer prediction is proposed, where a split point measure is used namely weighted entropy for pruning the decision tree. For the analysis, we make use of DNA sequences obtained from National Centre for Biotechnology Information (NCBI). Evaluation metrics parameters of sensitivity, specificity and accuracy are found out and compared to the existing literature. Experimental results demonstrate that, this proposed scheme has achieved an accuracy of 90% in classifying DNA sequences.
Keywords: weighted entropy, DNA sequence, decision tree, classification, cancer prediction
I. INTRODUCTION
through errors in DNA replication or are inherited and along these lines exhibit in all cells from birth. The heritability of cancer is typically influenced by intricate interactions in the middle of carcinogens and the host's genome. There is a various classification scheme for the different genomic changes which may contribute to the era of cancer cells. A large portion of these progressions are mutations, or changes in the nucleotide sequence of genomic DNA. Small-scale mutations incorporate point mutations, cancellations, and insertions, which may happen in the promoter area of a gene and influence its articulation or may happen in the gene's coding sequence and change the capacity or steadiness of its protein item [10]. Most cancers originate from arbitrary mutations that grow in body cells among one's lifetime - either as an error when cells are experiencing cell division or in response to wounds from ecological agents, for example, introduction to radiation or chemicals. Numerous researchers are utilizing gene microarray and mass spectrography technology to analyze gene expression data for calculation and grouping of cancer. Nanotechnology is likewise used to create precise and sensitive biomedical devices for tumor genome study [4] Profiling irregular genes may help us better classify cancers and select the optimal treatment. Cancer genomics can help anticipate what may happen in cancer cells and figure out what really happens because of that it concentrates on last gene function. This article, summarize the clinical uses of genomic cancer, briefly presenting basic approach in cancer genomics portraying the clinical applications of these technologies.
A. The main contributions of the paper are
1) The paper discusses two cancer prediction methods which use Genomic Signal Processing (GSP).
2) First method makes use of proposed system through a concept of weighted entropy that takes both entropy and total correlation into consideration. In the second method, decision tree based method for cancer prediction is proposed.
3) For the study, we use of DNA accession nos. AF008216.1, AF348525.1, NM_016346.2, NM_005732.3, AF348515.1, NM_012403.1, AF015224.1, AF083883, AF186607.1, AF186613.1, AF007546 and AF065986, of which first 7 DNA sequences are form the cancer cells and the other 5 are from the normal cells.
The rest of the paper organized as follows: the recent research works is analyzed in section 2; The structural profiles of DNA sequence is described in the section 3; the proposed work briefly explained in section 4; In the 5th section, the experimental results along with the comparison result is depicted and the section 6 represents the summary of the paper.
II. RELATED WORKS
enhanced execution contrasted with the model that does not consider inter-relationship when coordinated multi-omics data. For the pair between miRNA and gene expression data, the model incorporated miRNA, for instance, gene expression, and inter-relationship between them with an AUC of 0.8476 (REI) beat the model combining miRNA and gene expression data with an AUC of 0.8404. Comparable results were additionally acquired for different pairs between diverse levels of genomic data. Integration of diverse levels of data and inter-relationship between them could support in removing new biological knowledge by making an integrative determination from numerous pieces of data gathered from various sorts of genomic data, inevitably prompting more powerful screening techniques and alternative therapies that may enhance results.
Seshacharyulu et al. [16] had condensed the part of a several miRNAs that control different oncogenes (KRAS) and tumor suppressor genes (p53, p16, SMAD4, and so forth.) included in PC improvement, their prospective roles as diagnostic and prognostic markers and as a therapeutic targets. Micro RNAs (miRNAs) were short (19–24 nucleotides) non-coding RNA particles embroiled in the regulation of gene representation at post-transcriptional level and play critical parts in different physiological and pathological conditions. Deviant representation of miRNAs had accounted for in a several cancers including PC and was concerned in PC pathogenesis and progression, proposing their utility in diagnosis, prognosis and therapy.
Chih-Wen Lin et al, [17] had implemented a reusable biosensor based on a magnetic graphene oxide (MGO)- modified Au electrode to identify vascular endothelial development component (VEGF) in human plasma for cancer analysis. In that biosensor, Avastin was utilized as the particular bio- recognition element, and MGO was utilized as the carrier for Avastin stacking. The utilization of MGO empowered rapid purification because of its magnetic properties, which prevents the loss of bioactivity. The advantages of the Avastin-MGO- modified biosensor for VEGF location was that it gives a proficient recognition methodology that enhances the identification capacity as well as diminishes the expense and reductions the reaction time by 10-fold, demonstrating its potential as a diagnosis product.
BichenZheng et al. [18] had suggested a feature based cancer diagnose system. To concentrated useful data and diagnosed the tumor, a hybrid of K-means and support vector machine (K-SVM) algorithms was produced. The K- means algorithm was used to perceive the concealed patterns of the benign and malignant tumors independently. The membership of every tumor to those patterns was ascertained and treated as a new feature in the training model. At that point, a support vector machine (SVM) was utilized to get the new classifier to separate the approaching tumors. Based on 10-fold cross acceptance, the proposed methodology enhanced the precision to 97.38%, when tested on the Wisconsin Diagnostic Breast Cancer (WDBC) data set from the University of California – Irvine machine learning archive. Six unique tumor features were extricated from the 32 unique features for the training phase. The results not just delineate the ability of the proposed approach on breast cancer diagnosis, additionally show time savings amid the training phase. Doctors could also profit from the mined abstract tumor features by better understanding the properties of diverse sorts of tumor.
George et al. [19] had developed a completely automated strategy for cell nuclei identification and segmentation in breast cytological images. The areas of the cell nuclei in the image were identified with circular Hough transform. The elimination of false-positive (FP) discoveries (uproarious circles and platelets) was attained to utilizing Otsu's thresholding strategy and fuzzy c-means clustering method. The segmentation of the nuclei boundaries was fulfilled with the application of the marker-controlled watershed transform. Next, a shrewd breast cancer classification framework was created. Four classification models were utilized, specifically, multilayer perceptron utilizing back- propagation algorithm, probabilistic neural network (PNN), learning vector quantization, and support vector machine (SVM). The classification results were attained utilizing tenfold cross validation. The execution of the systems was compared at in view of resulted error rate, correct rate, affectability, and specificity.
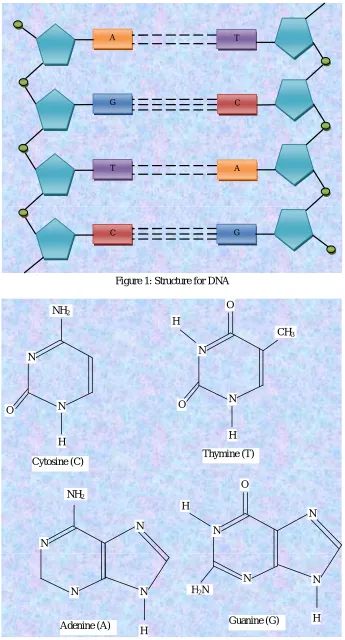
III. STRUCTURAL PROFILES OF DNA SEQUENCE
Figure 1: Structure for DNA
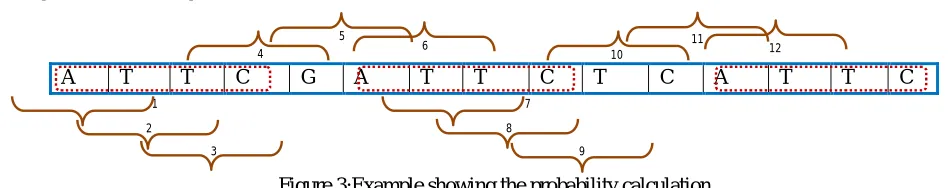
Figure 2: Structure for Adenine (A), Thymine (T), Cytosine (C) and Guanine (G) NH2
H
O N
N
Cytosine (C)
N N
O
CH3
H O
H
Thymine (T)
N N
N N
H
N N
N N
H NH2
H
O
H2N
Adenine (A) Guanine (G)
A T
G C
T A
IV. METHODS FOR CANCER PREDICTION FROM DNA SEQUENCE
In this section, we describe the proposed cancer prediction from DNA sequence using two methods. In the first one, the weighted entropy [20] is found out directly for the DNA sequence in order to predict for cancer. In the second method, we develop a decision tree based method to predict cancer prediction.
A. Weighted Entropy Based Prediction
The first method to predict the cancer cell from the DNA sequence is based on the weighted entropy value. In this method, a system is proposed via anefficient concept of weightedentropy [20] that takes both entropy and total correlation into consideration.Here, there is no need for transformation and the calculation happens in the time domain, which is to find the entropy of the DNA sequence and predict the cancer based on the weighted entropy value.
Initially, the unique groups having a length
l
are found out from the input DNA sequenceD
[
n
]
having lengthk
. The DNA sequence consists of four letters whereA
stands for Adenine,T
stands for Thymine,G
stands for Guanine andC
stands for Cytosine.Let the number of unique groups be represented by
N
and in our casel
is taken as 4. Consider the input DNA sequence example as shown in equation (1)CATTC
ATTCGATTCT
n
D
[
]
(1)So the first task is to find the unique groups having length
l
, which is taken as 4 in our case. The unique groups for the example in equation (1) are given in equation (2):}
,
,
,
,
,
,
,
,
,
{
ATTC
TTCG
TCGA
CGAT
GATT
TTCB
TCTC
CTCA
TCAT
CATT
U
(2)So the number of unique terms
N
obtained for the example is 10.To weight the entropy of each
U
i(where0
i
N
), we propose to employ a reverse sigmoid function of the entropy, as follows:)
(
a
iw
)
(
exp(
1
1
1
2
i xa
H
(3)This reverse sigmoid is a decreasing function ranging between (0, 2).
Subsequently for every
U
i(where0
i
N
) the probability is found out. The probability is found out using the equation (4):i i i
C
n
D
in
appears
a
times
of
Number
a
P
(
)
[
]
(4)Where,
a
iis the attribute,C
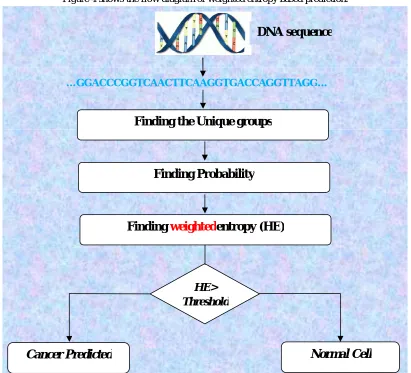
iis the number of comparisons made (in the sliding window style). [image:6.612.59.533.518.612.2]A T T C G A T T C T C A T T C
Figure 3:Example showing the probability calculation For the example in equation (4), probability of the first unique term will be as in equation (5):
TTCG
C
n
D
in
appears
TTCG
times
of
Number
TTCG
P
(
)
[
]
(5)The number of times the term appears and the number of comparisons are clear from the figure 3. The method involves finding the entropy value
E
(
X
)
for the input DNA sequence. The entropy is a measure of the uncertainty associated with a random variable and is given by the formula in equation (6):)
(
ix
a
H
N
j
i
i
P
a
a
P
1
2
(
)
log
)
(
(6)Using equation (3) and (6), we derive the weighted entropy
W
x(
A
)
which is the sum of the weighted entropy on each attribute of the DNA sequence.
m i i x ix
A
w
a
H
a
W
1)
(
)
(
)
(
(7))
(
A
W
x stands for the weighted entropy value ofx
th input sequence. Similarly, for every sequence the weighted entropy is calculated and is used for prediction of cancer by fixing a thresholdT
e. When the entropy value is above the threshold, cancer is predicted else it’s a normal cell. [image:7.612.101.512.333.706.2]predicted
is
cell
Normal
T
E
predicted
is
cell
Cancer
T
E
when
e i e i,
,
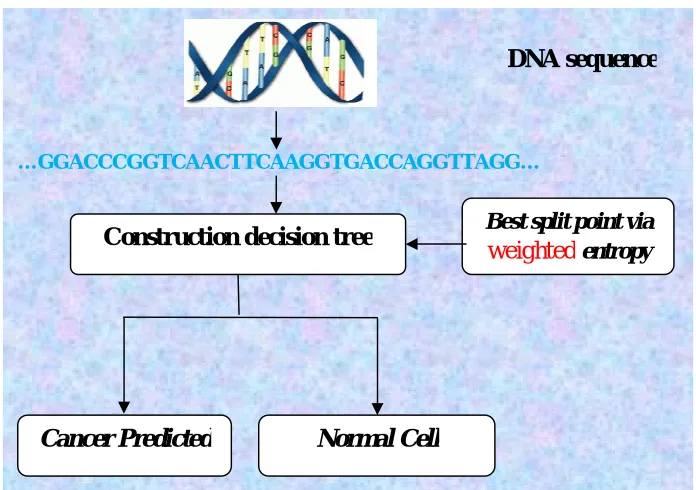
(8)Figure 4 shows the flow diagram of weighted entropy based prediction.
Figure 4: Flow diagram of weighted entropy based prediction …GGACCCGGTCAACTTCAAGGTGACCAGGTTAGG…
Finding the Unique groups
Finding Probability
Finding
weighted
entropy (HE)
HE> Threshold
Normal Cell
Cancer Predicted
B. Decision Tree and Weighted Entropy Based Prediction
In this section, we develop a decision tree based cancer prediction on DNA sequences. Each node
R
of a decision tree is associated with an attributeA
jn and a split points
n
dom
(
A
jn)
. An internal node has two children, which are labelled “left’ and “right’ respectively. Each leaf noder
in the decision tree is associated with a probability distributionP
roverC
. For eachc
C
,)
(
c
P
r gives a probability reflecting how likely a tuple assigned to leaf noder
would have a class label ofc
.Accordingly, at first, the decision tree algorithm checks whether all the tuples possess same class label, then all the tuples will be grouped into one leaf node. If the classes are different, a split function is utilized to put the tuples into left of right of the leaf node. The split function
s
n uses the mean or median value of the corresponding tuple to plot it into either left or right of the leaf nodes. We can consider the mean or median as the decision parameter x, then,node
right
it
put
else
node
left
it
put
s
x
if
(
)
Now, we calculate the probability of the nodes in left and right with respect to the class labels. The probability can be subjected as
)
(
c
P
r and the tuples with higher probability regarding a class label then the tuple is assigned to that class. Thus we obtain the probability range of all the tuples corresponding to that particular input. We set an average probability of classesP
r(
c
)
avg for each classc
i in set C. This will be used to classify an unknown DNA sequence data.Our algorithm works as follows: Starting from the region of the entire DNA sequence, a decision tree is constructed to recursively find the best binary split point on the residues in this DNA sequence region. At each iteration, we utilize the weighted entropy based measure that is efficiently used in decision tree algorithm to evaluate all possible split points and find the best split those results in minimized weighted entropy [20].
m i i x i R L Xx
w
a
H
a
S
X
A
W
1 ,)
(
)
(
)
(
(9) Where,)
(
i xa
H
N
j
i
i
P
a
a
P
1
2
(
)
log
)
(
(10)
)
(
a
iw
)
(
exp(
1
1
1
2
i xa
H
(11)Each iteration determines a best binary split with minimum weighted entropy and splits the current region into two sub-regions. This is the same as generating two decision tree nodes that split the data from the parent node.
Figure 5: Flow diagram of decision tree based prediction V. RESULT AND DISCUSSION
We have offered the results of our suggested methodology and have examined their presentation in this part. The proposed cancer diagnosis is implemented in the MAT LAB program and the cancer diagnosis is experimented with the Gene bank. For implementing the proposed technique we have used Mat lab version (7.12) and the technique is done in windows machine having Intel Core i5 processor with speed 1.6 GHz and 4 GB RAM.
A. Evaluation metrics
The evaluation of proposed cancer diagnosis using genomic signals are carried out using the following metrics as suggested by below equations,
1) Sensitivity: The Sensitivity is the proportion of true positives that are correctly identified by a diagnostic test. It shows how good the test is at detecting a disease. This relation can be expressed as,
p t
p n
T
S
T
F
(12)
2) Specificity: The specificity can be evaluated by taking the relation of number of true negatives to the combined true negative and the false positive. It suggests how good the test is at identifying normal (negative) condition. The specificity can be expressed as,
n p
n p
T
S
T
F
(13)
3) Accuracy: The Accuracy is the proportion of true results, either true positive or true negative, in a population. It measures the degree of veracity of a diagnostic test on a condition.
The accuracy can be described by the following equation
p n
p p n n
T
T
A
T
F
F
T
(14) Where,
…GGACCCGGTCAACTTCAAGGTGACCAGGTTAGG…
Best split point via
weighted
entropyConstruction decision tree
Normal Cell
Cancer Predicted
p
T
True positiven
T
True negativep
F
False positiven
F
False negativeB. Experimental Result
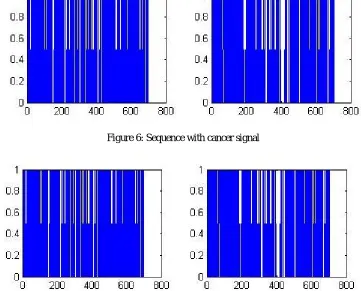
[image:10.612.134.484.282.415.2]The basic idea of our research is to diagnosis the cancer signal using Holo entropy with decision tree. Here, the cancer diagnosis method is based on Holo entropy. The figure 6 shows the sequence with cancer signal and figure 7 shows the sequence with non-cancer signal. For evaluation of methods, we make use 12 DNA sequence having accession numbers AF008216.1, AF348525.1, NM_016346.2, NM_005732.3, AF348515.1, NM_012403.1, AF015224.1, AF083883, AF186607.1, AF186613.1, AF007546 and AF065986 [14]. Of these DNA sequences, first 7 are form the cancer cells and the other 6 are from the normal cells.
[image:10.612.123.484.288.579.2]Figure 6: Sequence with cancer signal
Figure 7: Sequence with non-cancer signal C. Comparative analysis of Proposed Approach
Figure 8: Performance comparison of the accuracy plot
Figure 9: performance comparison of the sensitivity plot
Figure 10: performance comparison of the specificity plot
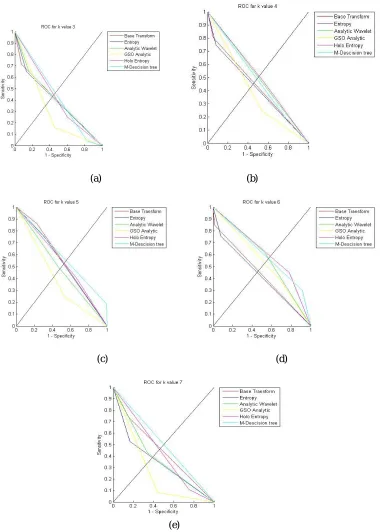
[image:11.612.203.440.382.498.2](a) (b)
(c) (d)
[image:12.612.132.512.78.610.2](e)
Figure 11: k-fold validation performance of the ROC curve
value. In the same way, figure 11(e) shows the performance of the K- fold validation using K=7. Here also our proposed approach obtains the good result compare to the existing works.
VI. CONCLUSION
In this paper, we discussed two systems to predict cancer based on the signal processing of the DNA sequence. A system is proposed in the first method to predict cancer from DNA sequence, through an efficient concept of weighted entropy that takes both entropy and total correlation into consideration. In the second method, a decision tree based cancer prediction was proposed, where a split point measure was used namely weighted entropy for pruning the decision tree. For the analysis, we make use of DNA sequences obtained from National Center for Biotechnology Information (NCBI). Evaluation metrics parameters of sensitivity, specificity and accuracy were found out and compared to the existing literature. From the results obtained, we can infer that all our methods have attained better evaluation metrics parameter values than the existing approach. Both the weighted entropy based method and the decision tree based method yielded the best results with an accuracy of 91.6%. Weighted entropy method gave 66.6% accuracy when compared to 58.3% for the existing literature.
REFERENCES
[1] Anant Narayan Bhat, RohitMathur,AbdullahFarooque, AmitVerma and Dwarakanath, “cancer bio markers –current perspcectives”, Indian Journal of Medical Research, pp. 129-149, 200
[2] Cancer Research Institute, UK www.cancer.org/index
[3] Hariprasad, SaneeshCleatus, Anjali Chitaranjan,Ashwini Data and Monisha Ganesh., “Novel approach on cancer detection “, Proceedings of Asar International Conference, 14th may-2014, mysore, india,
[4] Barman (Mandal), M.Roy, S.Biswas and Saha, ” Prediction of Cancer Cell Using Digital Signal Processing”, Interational Journal of Engineering, Vol.1, pp. 91-95, 201
[5] Swapnoneel Roy, MinhazurRahman, and Ashok Kumar Thakur, "Sorting Primitives and Genome Rearrangement in Bioinformatics: A Unified Perspective", World Academy of Science, Engineering and Technology, Vol.3, No.38, 2008
[6] Rames, Prabhu Shankar, Mallikarjunaswamy and Puttaiah, “Genomic Signal Processing (GSP) Of Rheumatic Arthritis (RA) Using Different Indicator Sequences”, International Journal of Computer Science and Mobile Computing, Vol. 2, No. 5, pp.332 – 337, 201
[7] AkankshaKulshreshtha,.Karthika and ArchanaTiwari, “Genome Signal Analysis: An Approach For Predicting Hivi Variability Based on Phase Analysis of Protease Gene”, International journal of pharma and bio sciences, Vol. 4, No. 4, pp. 519-535, 2011
[8] Sathish Kumar and Duraipandian,” An Effective Identification of Species from DNA Sequence: A Classification Technique by Integrating DM and ANN”, International Journal of Advanced Computer Science and Applications, Vol. 3, No.8, 2012
[9] PengQiu, Wang Z.Jane, and K.J. Ray Liu, “Genomic Processing of Cancer Classification and Prediction”, IEEE Signal Processing Magazine, 2007
[10] Jeremy Volkening and Stephen Spatz "Purification of DNA from the cell-associated herpesvirusMarek’s disease virus for 454 pyrosequencing using micrococcal nuclease digestion and polyethylene glycol precipitation", Journal of Virological Methods, Vol. 157, pp. 55– 61. 2009.
[11] Xingyi Ma, Phuoc Long Truong, Nguyen Hung Anha and Sang Jun Sima, “Single gold nanoplasmonic sensor for clinical cancer diagnosis based on specific interaction between nucleic acids and protein”, Biosensors and Bioelectronics, Vol. 67, pp. 59–65, May 2015,
[12] Seonghwan Lee, Hunho Jo, Jin Her, Ho Yong Lee and Changill Ban, “Ultrasensitive electrochemical detection of engrailed-2 based on homeodomain-specific DNA probe recognition for the diagnosis of prostate cancer”, Biosensors and Bioelectronics, Vol. 66, No.15, pp.32–38, 2015
[13] P. Filipczuk, T. Fevens, A. Krzyzak and R. Monczak, “Computer-Aided Breast Cancer Diagnosis Based on the Analysis of Cytological Images of Fine Needle Biopsies”, IEEE Transaction on Medical Imaging, Vol.32, No. 12, pp. 2169 - 2178, 2013
[14] Dokyoon Kim, Hyunjung Shin, Kyung-Ah Sohn, AnuragVerma, Marylyn D. Ritchie and Ju Han Kim, “Incorporating inter-relationships between different levels of genomic data into cancer clinical outcome prediction”, Methods, Vol. 67, No. 3, pp. 344–353, 2014
[15] Seshacharyulu, DhanyaHaridas, SeemaChugh and Surinder K. Batra, “Clinical implications of miRNAs in the pathogenesis, diagnosis and therapy of pancreatic cancer”, Advanced Drug Delivery Reviews, Vol. 81, pp. 16–33, 2015
[16] Chih-Wen Lin, Kuo-Chen Wei, Shih-sheng Liao, Chiung-Yin Huang, Chia-Liang Sun, Pei-Jung Wu, Yu-Jen Lu, Hung-Wei Yang and Chen-Chi M. Ma, “A reusable magnetic graphene oxide-modified biosensor for vascular endothelial growth factor detection in cancer diagnosis”, Biosensors and Bioelectronics, Vol. 67, pp. 431–437, 201
[17] BichenZheng, Sang Won Yoon and Sarah S. Lam, “Breast cancer diagnosis based on feature extraction using a hybrid of K-means and support vector machine algorithms”, Expert Systems with Applications, Vol. 41, No. 4, pp. 1476–1482, 2014
[18] Y.M .George, H.H. Zayed, M.I. Roushdy and B.M. Elbagoury, “Remote Computer-Aided Breast Cancer Detection and Diagnosis System Based on Cytological Images”, IEEE Transaction on Systems, Vol.8 ,No.3, pp. 949 – 964, 2013