0095-1137/10/$12.00 doi:10.1128/JCM.01832-09
Copyright © 2010, American Society for Microbiology. All Rights Reserved.
Performance Evaluation of the New Roche Cobas AmpliPrep/Cobas
TaqMan HIV-1 Test Version 2.0 for Quantification of Human
Immunodeficiency Virus Type 1 RNA
䌤
†
Suzan Pas,
1John W. A. Rossen,
2Daniel Schoener,
3Diana Thamke,
3Annika Pettersson,
4Reiner Babiel,
3and Martin Schutten
1*
Erasmus MC, Department of Virology, Rotterdam, Netherlands1; St. Elisabeth Hospital, Laboratory of Medical Microbiology and
Immunology, Tilburg, Netherlands2; Roche Molecular Diagnostics, Rotkreuz, Switzerland3; and VU University Medical Center,
Department of Medical Microbiology and Infection Control, Amsterdam, Netherlands4
Received 18 September 2009/Returned for modification 18 November 2009/Accepted 8 February 2010
Despite FDA approval and CE marking of commercial tests, manufacturer-independent testing of the technical aspects of newly developed tests is important. To evaluate the analytical performance and explore the clinical applicability of the new Roche COBAS AmpliPrep COBAS TaqMan HIV-1 test, version 2.0 (CAP/CTM v2.0), platform comparison was performed with the Roche CAP/CTM test, version 2.0, the COBAS Amplicor HIV-1 Monitor Test, version 1.5 (CAP/CA v1.5), the COBAS AmpliPrep COBAS TaqMan HIV-1 Test (CAP/
CTM v1.0), and the Abbottm2000 RealTimeHIV-1 assay on panels and diagnostic samples. Specificity was
tested for HIV-2 samples. Furthermore, samples from HIV-1-seropositive individuals with CAP/CA v1.5-measured viral loads below 50 HIV-1 RNA copies per ml (cp/ml) and replicates of HIV-1-seronegative plasma were tested in a checkerboard analysis. CAP/CTM v2.0 is HIV-1 specific, with broad genotype inclusivity and no serious underquantification of viral load relative to the other assays used. Low viral loads below the threshold of quantification for CAP/CA v1.5 are observed with CAP/CTM v2.0. A CAP/CTM v2.0-measured viral load of >50 copies/ml in these samples correlated with therapy failure. In conclusion, CAP/CTM v2.0 is an accurate and reliable test for HIV-1 viral load measurement relative to the other assays used with respect to specificity, sensitivity, and genotype inclusivity.
HIV-1 is a major cause of morbidity and mortality in both the developing and the developed world. Relatively effective therapies have been readily available in developed countries for quite some time, and measurement of HIV-1 viral load is an important parameter in patient management both before initiation and during therapy (2).
The first assays described for determining HIV-1 viral load in plasma were based on target amplification techniques, like reverse transcriptase PCR (RT-PCR) and nucleic acid se-quence-based amplification (NASBA) with readouts on aga-rose gel or with biotinylated primers and enzymatic detection of the amplicon (1, 3, 11, 15). Subsequently, signal amplifica-tion techniques were developed for quantitative detecamplifica-tion of HIV-1 RNA (5). The suppliers of non-real-time detection sys-tems at the moment are, among others, Roche (COBAS Am-plicor Monitor), Abbott (LcX for RT-PCR based systems), bioMe´rieux (with a NASBA-based technique), and Siemens (with the Versant HIV-1 RNA [bDNA] signal amplification technique) (4, 16). Each technique has its own advantages and disadvantages. Relatively small dynamic range is a disadvan-tage that all these assay formats have in common. In addition, they are also rather sensitive to contamination, especially at
the lower limit of detection (LLOD) (19). Handling of the samples after target amplification is a major cause of contam-ination for NASBA- and RT-PCR-based techniques. Recently, amplification techniques that allow real-time detection of the amplicon have been developed for NASBA and RT-PCR, making postamplification processing obsolete (8, 19). A seri-ous drawback of most real-time techniques involves amplifica-tion with target-specific oligonucleotides and detecamplifica-tion with am-plicon specific fluorescence-labeled probes and their sensitivity to point mutations within primer/probe target sequences. This is especially of concern with highly variable targets like HIV-1.
Roche has recently obtained a CE mark and received FDA approval for a HIV-1 viral load assay (COBAS AmpliPrep CO-BAS TaqMan HIV-1 Test, version 1.0 [CAP/CTM v1.0]) using the COBAS TaqMan platform (17). The major drawbacks re-ported in the literature for the first version are limited specificity (e.g., genotype inclusivity) and a significant increase in low posi-tive results for individuals with levels below the threshold of quan-tification for the COBAS Amplicor HIV-1 Monitor Test, version 1.5 (CAP/CA v1.5) (6, 12–14, 22, 23). To improve the genotype inclusivity, Roche has changed its CAP/CTM v1.0 assay by devel-oping a dual-target assay, the COBAS AmpliPrep COBAS Taq-Man HIV-1 Test, version 2.0 (CAP/CTM v2.0). We decided to generate manufacturer-independent data on the performance of the new CAP/CTM v2.0 HIV-1 viral load assay, with special emphasis on its applicability for clinical diagnostics.
MATERIALS AND METHODS
Patient materials and quality control materials.500 HIV-1 EDTA plasma samples from HIV-1-seropositive patients visiting our outpatient clinic and hav-* Corresponding author. Mailing address: Erasmus MC,
Depart-ment of Virology, ’s Gravendijkwal 230, 3015 CE Rotterdam, Neth-erlands. Phone: (31)-10-7033431. Fax: (31)-10-7033441. E-mail: m [email protected].
䌤Published ahead of print on 17 February 2010.
† The authors have paid a fee to allow immediate free access to this article.
1195
on May 16, 2020 by guest
http://jcm.asm.org/
ing HIV-1 viral loads of more than 5.0⫻102
copies per milliliter (cp/ml) as determined with CAP/CA v1.5 were obtained for test comparison. In addition, three HIV-seropositive plasma samples that were known to be underquantified by more than 1 log10cp/ml by CAP/CTM v1.0 were included. Samples were stored at⫺80°C until use. For analysis, samples were diluted (1:10) with a pool of HIV-1-seronegative and HIV-1 RNA-negative EDTA plasma and subse-quently aliquoted into six ampoules and stored at⫺80°C until use. Dilution and aliquoting of samples were performed with a CAS-4200 (Qiagen, Hilden, Ger-many) to minimize pipetting errors. In addition, 502 plasma samples from pa-tients on antiretroviral therapy (ART) and with HIV-1 viral loads of less than 5.0⫻101
cp/ml as determined with CAP/CA v1.5 were tested in a checkerboard analysis with 500 replicates of an EDTA plasma pool from HIV-1-seronegative and HIV-1 RNA-negative donors. Information regarding the use of nonnucleo-side analogue reverse transcriptase inhibitors (NNRTI) versus protease inhibi-tors (PI) was taken from the hospital records. The WHO international standard (97/650) and the WHO 1st international reference genotype panel (01/466) (9, 10) were used for evaluation purposes.
HIV viral load assays.The CAP/CA v1.5, CAP/CTM v1.0, and CAP/CTM v2.0 tests and the Abbott real-time HIV-1 viral load assay were performed according to the manufacturer’s instructions. In summary, for the COBAS TaqMan assays, HIV-1 RNA was isolated with the COBAS AmpliPrep ex-traction system. For the CAP/CA v1.5 (dynamic range, 5.0E⫹1 to 1.0E⫹6 cp/ml) assay, eluates were manually mixed with MasterMix and viral load measurement was performed with the COBAS Amplicor system. For the CAP/CTM assays (CAP/CTM v1.0 [dynamic range, 4.0E⫹1 to 1.0E⫹7] and CAP/CTM v2.0 [dynamic range, 2.0E⫹1 to 1.0E⫹7]), a docked version of the CAP/CTM system was used. For the Abbott assay, the M2000SP/ M2000RT system was used (dynamic range, 4.0E⫹1 to 1.0E⫹7). An in-house-developed assay was used for HIV-2 viral load determination essentially as described previously, using the HIV2LTRfpr2 forward primer (5⬘-GGAGA GGCTGGCAGATTGAG-3⬘), 40 pmol HIV2LTRrpr2 reverse primer (5⬘-G GTGAGAGTCTAGCAGGGAACAC-3⬘), and 7 pmol HIV2LTRprb2 probe (5⬘-6-carboxyfluorescein [FAM]-TGGGAGGTTCTCTCCAGCACTAGCAG G-6-carboxytetramethylrhodamine [TAMRA]-3⬘) (21).
HIV-1 genotyping.Immediately after RNA isolation, cDNA was synthesized using eluates (including beads) of the CAP/CA v1.5 isolation procedure. Fifteen microliters of eluate was used in a 25-l reaction mixture containing 1⫻AMV RT buffer (Promega, Leiden, Netherlands), 50 pmol HIV_v1.5_rpr1 (5⬘-GAGG GGTCGYTGCCAAAGAGTG-3⬘), 0.4 mM deoxynucleoside triphosphates (dNTPs), 500 units AMV reverse transcriptase (Promega, Leiden, Netherlands), and 5,000 units of RNasin (Promega). cDNA synthesis was performed for 5 min at 48°C, followed by 6 cycles of 90 s each at 49C° to 54°C, with a temperature increase of 1°C after each cycle, and then for 105 min at 55°C, followed by a hold at 4°C in a Minicycler (Bio-Rad Laboratories BV, Veenendaal, Netherlands).
Five microliters of cDNA was amplified in a 100-l reaction mixture contain-ing 1⫻GeneAmp PCR buffer II (Applied Biosystems, Nieuwerkerk a/d IJssel, Netherlands), 2.5 mM MgCl2, dNTPplus
(0.2 mM dATP, dCTP, dGTP, and 0.6 mM dUTP; Roche Applied Science, Almere, Netherlands), and 25 pmol of GAG-specific primer HIV1_v1.5_fpr3 (5⬘ -TAGTATGGGCAAGCAGGGAG-3⬘). The resulting PCR product was run on a 2% agarose gel stained with ethidium bromide. If no gel band was visible, an additional round of nested PCR was performed using the same mixture as described above, but with 5l of the first PCR product and 25 pmol of nested primers (HIV1_v1.5_fpr2 [5⬘-GGAA GAAGGGCTGTTGGAAATGTGG-3⬘] and HIV1_v1.5_rpr2 [5⬘-TCGTTGCC AAAGAGTGATCTGAGGG-3⬘]). If the nested PCR was negative, 5l of cDNA was amplified in a 50-l mixture containing 1⫻PCR buffer (Qiagen, Venlo, Neth-erlands), 5 mM MgCl2, dNTPplus
(0.2 mM dATP, dCTP, and dGTP and 0.6 mM dUTP; Roche Applied Science), 2.5 units of HotstartTaqPolymerase (Qiagen), 30 pmol of a combination of two forward primers (HIVgagfpr1⫹m [5⬘-ATGATGWC AGCATGTCAGGGAGTGGG-3⬘]), and 20 pmol of HIV1_v1.5_rpr1. The PCR conditions were 15 min at 95°C for initial denaturation and 40 PCR cycles with 1 min at 95°C for denaturation, 1 min at 52°C for annealing, and 1 min at 72°C for elongation per cycle. If no PCR product was seen on a 2% agarose gel, a nested PCR was performed using the Qiagen PCR mixture in combination with the nested primers and the same cycling conditions as described above.
For positive amplification products, Sanger sequencing was performed with a 20-l reaction mixture, using 5 pmol of the same primers as used for PCR, 4l of Dye Terminator v3.1 (Applied Biosystems), 4l of 5⫻sequencing buffer (Applied Biosystems), and 1l of PCR product. Sequences were read with an ABI 3100 genetic analyzer. Data were collected with data collection software (version 1.1; Applied Biosystems). Sequences were analyzed using Lasergene version 7.2 (DNAstar, Madison, WI) and genotyped using the REGA HIV
subtyping database engine and the NCBI database engine against pure subtypes. Sequences with bootstrap values of⬎70.0 were accepted.
Data analysis.Data were analyzed using Microsoft Office Excel 2003 and SigmaPlot for Windows, version 10.0. In the platform comparison, samples with viral loads above the quantification limit for CAP/CA v1.5 (18 samples) were assigned a value of 1.0⫻105
cp/ml and samples with viral loads below the quantification limit for any of the assays used were assigned a value comparable to the lower limit of that assay.
RESULTS
Testing dUTP/UNG activity of CAP/CTM v2.0. Significant
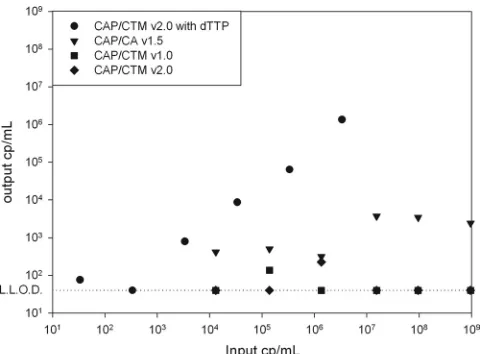
increases in number of HIV-1 viral loads near the lower limit of detection (LLOD) were observed after CAP/CA v1.5 was switched to CAP/CTM v1.0 in centers testing HIV-1-seropos-itive patients (6, 13, 14, 22). We investigated whether similar results can be expected with the CAP/CTM v2.0 test and whether these results are HIV-1 specific results, test abnormal-ities, or false-positive results due to contamination. We first investigated whether contamination with CAP/CA v1.5 ampli-cons could generate false-positive results in the CAP/CTM v2.0 test. We therefore generated a CAP/CA v1.5 amplicon in a reaction mixture with dTTP and without dUTP from a sub-type B-infected HIV-1 patient with a 100% conserved se-quence relative to the CAP/CA v1.5 primers (Fig. 1). Titration of the amplicon resulted in a standard curve with a slope of approximately 3.3, showing that the CAP/CA v1.5 amplicon overlaps CAP/CTM v2.0. Next, we compared the uracil-N -glycosylase (UNG) efficiency of CAP/CTM v2.0 versus that of CAP/CA v1.5 by titrating a known concentration of a dUTP-containing CAP/CA v1.5 amplicon. The CAP/CTM v2.0 UNG system proved to work slightly more efficient than the CAP/CA v1.5 UNG system (Fig. 1), which suggests that it is unlikely that low positive results for the CAP/CTM v2.0 assay can be attrib-uted to contamination by CAP/CA v1.5 amplicons, since false-positive results for CAP/CA v1.5 have so far not been an issue.
Testing the specificity of CAP/CTM v2.0.Out of 502
HIV-1-seropositive samples showing less than 50 cp/ml with CAP/CA v1.5, 393 samples gave identical results when
an-FIG. 1. Viral load as measured with CAP/CA v1.5 (triangles), CAP/CTM v1.0 (squares), and CAP/CTM v2.0 of dTTP (circles) and dUTP (diamonds) containing CAP/CA v1.5 amplicons, plotted against the amount of input amplicon as measured with a semiquantitative real-time RT-PCR specific for CAP/CA v1.5 amplicons.
on May 16, 2020 by guest
http://jcm.asm.org/
[image:2.585.301.541.67.244.2]alyzed with CAP/CTM v2.0, but in 109 samples, more than 50 cp/ml were detected. None of the 500 HIV-1-seronega-tive samples proved to have a viral load above the lower limit of detection with CAP/CTM v2.0. The average and median HIV-1 RNA loads of the samples that were positive as determined with CAP/CTM v2.0 were 187 and 92 cp/ml, respectively, with a standard deviation of 313 cp/ml and a range between 51 and 2,600 copies per ml. The numbers of months that patients showed fewer than 5.0⫻101cp/ml as
determined with CAP/CA v1.5 after initiation of antiretro-viral therapy were calculated using the date of the last known positive HIV-1 test result and the date of collection of the HIV-1 RNA-negative sample used in this analysis. Zero months was taken as the value for patients with viral loads above 5.0 ⫻ 101 copies per ml as determined with
CAP/CA v1.5 prior to testing of the sample with CAP/CTM v2.0. Patients who did not have a previous follow-up sample in our center were excluded from this analysis. The viral load measured with CAP/CTM v2.0 was plotted against the number of months that patients showed fewer than 50 cp/ml of HIV-1 RNA as determined with CAP/CA v1.5 (Fig. 2). Under antiretroviral therapy (ART), the median viral load slowly declined over time (at⬍12 months, 101 records at 129 cp/ml; at 12 to 24 months, 69 records, with a median of 100 cp/ml; at 24 to 36 months, 66 records, with a median of 85 cp/ml; at 36 to 48 months, 65 records, with a median of 60 cp/ml; and at⬎48 months, 208 records, with a median of 78 cp/ml). After 24 months of ART, the standard deviation of the viral load measurement decreased notably (at ⬍12 months,⫾485 cp/ml; at 12 to 24 months,⫾608 cp/ml; at 24 to 36 months,⫾161 cp/ml; at 36 to 48 months,⫾32 cp/ml; and at ⬎48 months, ⫾49 cp/ml), but the percentage of CAP/CTM v2.0-positive samples in each quartile remained fairly similar at around 20%. When a 1-month moving av-erage with windows of 5, 11, and 17 months was calculated, a steady decline in mean viral load was measured with CAP/
CTM v2.0 until 31 months after the start of therapy, after which no further decline was observed (data not shown). A viral load above 20 cp/ml as determined with CAP/CTM v2.0 was highly significantly correlated with a positive signal be-low the quantification limit for CAP/CA v1.5 (Fisher’s exact test;P⫽1.553⫻10⫺7). Therapy failure, as evidenced by a
CAP/CA v1.5-measured viral load above 500 cp/ml or two subsequent measurements above 50 cp/ml, was determined for the patients whose samples were used in this study. Patients with more than 12 months between two subsequent visit samples were excluded from the analysis. Patient fol-low-up periods ranged from 12 to 24 months. The Pvalue for the correlation between the CAP/CTM v2.0-measured value and therapy failure as evidenced by CAP/CA v1.5 was calculated using Fisher’s exact test and a 5-cp/ml moving lower limit (Fig. 3). For limits of 20 to 45 cp/ml as deter-mined with CAP/CTM v2.0, no statistically significant (P⬎
0.05) discrimination of patients below the moving lower limit or above the moving lower limit with respect to treat-ment failure was observed. However, for limits of 50 cp/ml or higher, patients with levels above the threshold showed significantly (P⬍0.05) higher rates of therapy failure than the subthreshold group. Five percent of the patients with viral loads below 50 cp/ml as determined with CAP/CTM v2.0 experienced therapy failure, while patients with viral loads above 50 cp/ml had an 11% rate of therapy failure. Limits of 100 cp/ml or higher were not considered, since limited group size did not allow for valid conclusions. No correlation between positivity or height of viral load as mea-sured with CAP/CTM v2.0 and use of protease inhibitors or nonnucleoside reverse transcriptase inhibitors could be ob-served (Studentttest; P⫽0.2077).
[image:3.585.42.284.69.234.2]We next tested the potential cross-reactivity of CAP/CTM v2.0 with HIV-2 (Fig. 4). Plasma samples from six HIV-2-seropositive individuals with viral loads above 1,000 cp/ml were selected. All six individuals were HIV-1 seronegative during a
FIG. 2. Viral loads as measured with CAP/CTM v2.0 for samples from HIV-1-infected patients under antiretroviral therapy that were below the limit of quantification (50 cp/ml) as determined by CAP/CA v1.5, plotted against the numbers of months that the patients showed levels below the limit of quantification for CAP/CA v1.5. Samples with viral loads between 20 and 50 cp/ml as determined by CAP/CTM v2.0 are not plotted.
FIG. 3. Probability of treatment failure for patients showing levels below the threshold of quantification for CAP/CA v1.5 who were retested with CAP/CTM v2.0. A 5-cp/ml moving lower limit was set, and the probability of therapy failure for patients with levels below this lower limit was compared to that for patients with levels above this limit and was tested for significance. The figure shows thePvalues for each limit (P⬍0.05 is significant).
on May 16, 2020 by guest
http://jcm.asm.org/
[image:3.585.300.542.70.242.2]complete follow-up of more than 5 years, excluding a mixed infection with HIV-1 and HIV-2. Four samples showed cross-reactivity with CAP/CA v1.5, and two samples were negative. None of the six samples generated a positive result with CAP/ CTM v2.0, indicating an improved HIV-1 specificity for this test relative to that of CAP/CA v1.5.
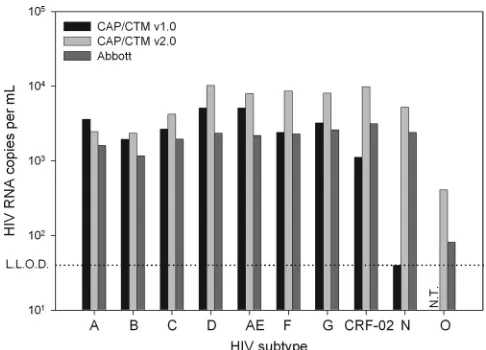
Performance of CAP/CTM v1.0 and CAP/CTM v2.0 was also tested against the WHO 1st international reference geno-type panel (01/466) (Fig. 5). Data of the Abbott assay were previously generated in our laboratory and were also described in the work of Schutten et al. (18). All assays showed excellent performance for group M samples of the reference panel except CAP/CTM v1.0, which slightly underquantified the CRF-02 sample. The group N sample was correctly quantified by CAP/CTM v2.0 and the Abbott assay, slightly underquan-tified by CAP/CA v1.5, and not quanunderquan-tified by CAP/CTM v1.0. The group O sample was quantified only by CAP/CTM v2.0 and the Abbott assay. Data on the group O sample could not be generated for CAP/CTM v1.0, due to the limited availability of this panel member. It has previously been described, how-ever, that CAP/CTM v1.0 does not detect HIV-1 group O (7).
Platform comparison. Five hundred clinical samples with
CAP/CA v1.5-measured viral loads of⬎500 cp/ml were 10-fold diluted with HIV-1-seronegative and RNA-negative EDTA plasma, aliquoted, and stored at⫺80°C until tested with CAP/CA v1.5, CAP/CTM v1.0, and CAP/CTM v2.0. A random selection of 297 samples was also tested with the Abbott assay. The subtype distribution was as follows: 72 samples were of subtype A (66 A1 and 6 A2), 156 samples were of subtype B, 22 samples were of subtype C, 7 samples were of subtype D, 4 samples were of subtype F, 31 samples were of subtype G, 2 samples were of subtype H, 1 sample was of subtype J, 1 sample was of subtype K, and 1 sample was of an unknown subtype. In addition, three samples known to be underquantified by CAP/CTM v1.0 were also tested with the Abbott assay. These three samples were of subtype C.
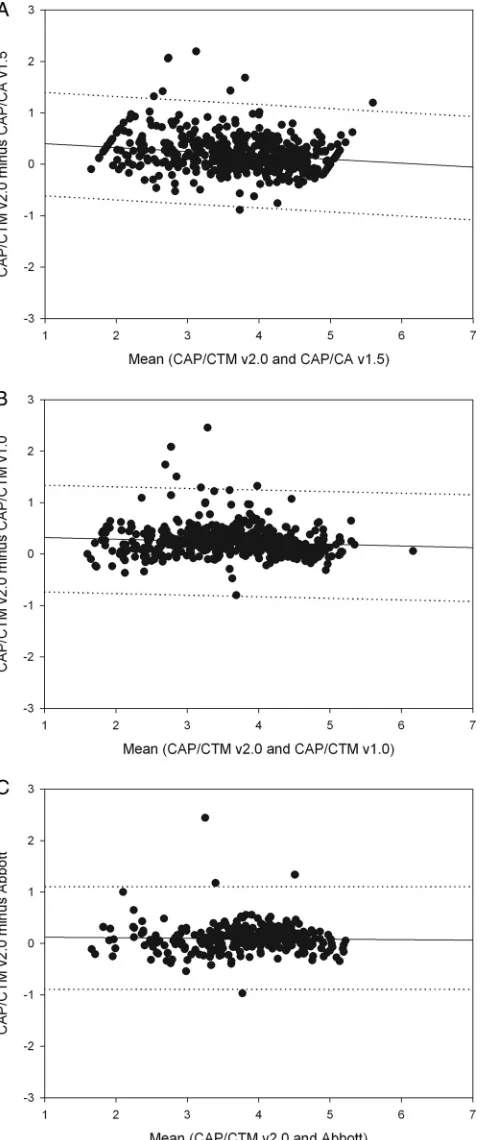
For the platform comparison, a regression analysis was per-formed on data plots generated similarly to Bland-Altman
plots (plotting the mean of results from the two assays against the difference between results from the two assays) (Fig. 6A to C). The average viral loads for the CAP/CA v1.5, CAP/CTM v1.0, CAP/CTM v2.0, and Abbott tests were 3.55 log10, 3.51
log10, 3.75 log10, and 3.70 log10, respectively. The slopes of the regression curves were close to 0,⫺0.06,⫺0.02, and⫺0.00 for comparison of the CAP/CTM v2.0 with CAP/CA v1.5, CAP/ CTM 1.0, and Abbott RealTimetests, respectively. The y in-tercepts were slightly higher than 0 for all three comparisons (0.41, 0.28, and 0.10 for the CAP/CA v1.5, CAP/CTM v1.0, and Abbott tests, respectively), and the regression coefficients were very low (0.02, 0.002, and 0.00004 for the CAP/CA v1.5, CAP/ CTM v1.0, and Abbott tests, respectively). The number of samples underquantified by more than 1 log10with CAP/CTM
2.0 relative to the results for CAP/CA v1.5 (1 [0.2%]) and CAP/CTM v1.0 (0 [0%]) was significantly lower than the num-ber of samples underquantified by these assays relative to the results for CAP/CTM v2.0 (8 [1.6%] and 6 [1.2%], respec-tively). Three samples (1%) were underquantified by the Ab-bott assay by more than 1 log10 relative to the results for
CAP/CTM v2.0, versus one (0.3%) for the reverse situation.
DISCUSSION
In the present paper, the performance of the new Roche dual-target CAP/CTM HIV-1 test, version 2.0, is described. We show that the assay is HIV-1 specific and correctly quan-tifies samples of HIV-1 groups M, N, and O. The viral loads determined with CAP/CTM v2.0 for samples having HIV-1 RNA levels below the threshold of quantification for CAP/CA v1.5 proved to be HIV-1 specific and correlated with therapy failure. In addition, we could show that in patients under ther-apy, viral load decreased over time until 31 months after ini-tiation of therapy and that levels below 250 cp/ml could regu-larly be detected with CAP/CTM v2.0 even 100 months after initiation of therapy.
[image:4.585.299.542.67.242.2]It has previously been reported that CAP/CTM v1.0 identi-fied a significant proportion of samples with levels below the threshold of quantification for CAP/CA v1.5 as HIV-1 positive,
FIG. 5. Viral loads for the WHO 1st reference panel as determined by CAP/CTM v1.0, CAP/CTM v2.0, and the Abbott assay. N.T., not tested.
FIG. 4. Viral loads of samples from six HIV-1-seronegative but HIV-2-seropositive patients, measured with an in-house-developed HIV-2 real-time quantitative RT-PCR assay, CAP/CTM v2.0, and CAP/CA v1.5, are plotted.
on May 16, 2020 by guest
http://jcm.asm.org/
[image:4.585.43.284.68.238.2]with viral loads well over 50 cp/ml. We have previously shown that lack of an UNG system in real-time viral load measure-ment may pose a significant problem for laboratories that used to measure HCV RNA with CA v1.5 and switch to the use of the Abbott real-time HCV assay, which has no UNG contam-ination control system built in to its reaction (20). In the present paper, we demonstrate that the UNG system of CAP/ CTM v1.0 and v2.0 is as efficient as the CAP/CA v1.5 UNG system in elimination of dUTP-positive amplicons derived from CAP/CA v1.5. We conclude that low HIV-1 RNA-posi-tive values determined with CAP/CTM v2.0 for samples having HIV-1 RNA levels below the threshold of quantification for CAP/CA v1.5 are true positives. This conclusion was substan-tiated by the observation that none of the HIV-1-seronegative plasma replicates in the checkerboard analysis was above the lower limit of detection for CAP/CTM v2.0. However, the nature of the low viral titers in treated patients still needs to be resolved. Release of virus particles from latently infected cells or active virus replication could be the cause. We assume that release of virus particles from a decaying pool of latently in-fected cells is the cause for the long-lasting low viral load in patients under therapy. This assumption is further supported by the observation that in patients whose levels were below the threshold of quantification for CAP/CA v1.5 (⬍50 cp/ml) but who tested HIV-1 positive with CAP/CTM v2.0, viral load steadily declined during the first 31 months after initiation of therapy and reached a plateau thereafter. The high sensitivity and linearity of CAP/CTM v2.0 at the lower end of quantifi-cation (⬍50 cp/ml) compared to the levels for other HIV-1 viral load assays raises some critical questions for current na-tional and internana-tional guidelines for treatment and for clin-ical trials. Our data show that in each stratum (⬍12, 12 to 24, 24 to 36, 36 to 48, and⬎48 months after initiation of therapy), about 20% of patients would be reported as experiencing apy failure with CAP/CTM v2.0 while being reported as ther-apy responders with CAP/CA v1.5. In our cross-sectional ret-rospective data set, a viral load determined by CAP/CTM v2.0 to be above the threshold of quantification for CAP/CA v1.5 was statistically correlated with therapy failure, which suggests that CAP/CTM v2.0 results at the low end have clinical impact. The probability of virological failure in our hospital setting is between 10 and 20%. The therapy failure rate of 11% for viral loads above 50 cp/ml as determined by CAP/CTM v2.0 seems clinically relevant, given that this rate is more than 2-fold higher than that observed for the remaining patients with levels below the threshold of quantification for CAP/CA v1.5. Pro-spective longitudinal data sets are required, however, for new cutoff values for clinical intervention based on CAP/CTM v2.0 to be defined.
[image:5.585.45.286.87.657.2]Reliable quantification of subgroup M, including non-B HIV-1 subtypes, is generally considered an important feature of state-of-the-art HIV-1 quantification assays. Non-group-M HIV-1 subgroups N and O are considered to be of minor clinical importance due to the low numbers of infected indi-viduals worldwide. A platform comparison and specificity study using the WHO first reference panel for HIV-1 genotypes was performed with Roche CAP/CA v1.5, CAP/CTM v1.0, and CAP/CTM v2.0 and the Abbott assay. Overall, the platform comparison based on mean titers, Bland-Altman analysis, and the percentage of single strongly deviating measurements
FIG. 6. Regression plots of Bland-Altman analysis-derived data for CAP/CTM v2.0 compared with results for CAP/CA v1.5 (A), CAP/ CTM v1.0 (B), and the Abbot M2000 system (C). Viral loads measured were log10transformed before analysis. Dashed lines indicate 1-log10 difference from the regression curve.
on May 16, 2020 by guest
http://jcm.asm.org/
shows that there are small quantitation differences between CAP/CTM v2.0 and both CAP/CA v1.5 and CAP/CTM v1.0. These differences are due to (i) titer shifts for individual mea-surements (e.g., outliers seen in the plots) and (ii) smaller quantitation differences concentrated at the medium and lower assay range seen by the nonzeroyintercepts and slopes (Fig. 6A and B). This indicates that CAP/CTM v2.0 measures higher target concentrations in samples with medium-to-low viral loads than the two predecessor tests. When the Abbott
Real-Timetest was compared to CAP/CTM v2.0, fewer titer shifts of individual measurements and only negligible differences over the assay range were observed.
Due to the relatively low sequence homology between HIV-1 and HIV-2, development of a viral load assay that is able to reliably quantify all subtypes of both viruses is virtually impossible. However, cross-reactivity may occur, as observed with CAP/CA v1.5 in four out of the six HIV-2 plasma samples, and could lead to misdiagnosis and inappropriate patient man-agement. We were able to show that HIV-2 cross-reactivity of CAP/CA v1.5 is probably solved with CAP/CTM v2.0, but larger numbers of HIV-2-infected individuals need to be tested for this question to be answered.
In conclusion, CAP/CTM v2.0 is, on the basis of the data presented, an accurate and reliable test for HIV-1 viral load measurement relative to the other assays used with respect to specificity, sensitivity, and genotype inclusivity. It can be used for high- and medium-throughput laboratories with low-qual-ification personnel. The specificity and sensitivity of CAP/CTM v2.0 are good relative to those observed for the other assays used. Although our data suggest that low positive values as determined with CAP/CTM v2.0 for patients under therapy are correlated with therapy failure, additional clinical studies are required for new cutoffs for therapy decisions and patient management to be defined.
ACKNOWLEDGMENTS
We thank Roche Diagnostics, Ltd., Switzerland, for providing the CAP/CA v1.5, CAP/CTM v1.0, and CAP/CTM v2.0 tests used in this study and H. Stockinger from Roche Diagnostics, Ltd., for logistical assistance and carefully reading the manuscript. COBAS, Amplicor, and TaqMan are trademarks of Roche. The CAP/CTM HIV-1 test, version 2, is not available in the United States.
Part of this study was funded by Roche Molecular Diagnostics. M. Schutten is a consultant for Viroclinics BV.
REFERENCES
1.Abbott, M. A., B. J. Poiesz, B. C. Byrne, S. Kwok, J. J. Sninsky, and G. D. Ehrlich.1988. Enzymatic gene amplification: qualitative and quantitative methods for detecting proviral DNA amplified in vitro. J. Infect. Dis.158:
1158–1169.
2.Aberg, J. A., J. E. Kaplan, H. Libman, P. Emmanuel, J. R. Anderson, V. E. Stone, J. M. Oleske, J. S. Currier, and J. E. Gallant.2009. Primary care guidelines for the management of persons infected with human immunode-ficiency virus: 2009 update by the HIV Medicine Association of the Infec-tious Diseases Society of America. Clin. Infect. Dis.49:651–681. 3.Compton, J.1991. Nucleic acid sequence-based amplification. Nature350:
91–92.
4.de Baar, M. P., M. W. van Dooren, E. de Rooij, M. Bakker, B. van Gemen, J. Goudsmit, and A. de Ronde. 2001. Single rapid real-time monitored isothermal RNA amplification assay for quantification of human immuno-deficiency virus type 1 isolates from groups M, N, and O. J. Clin. Microbiol.
39:1378–1384.
5.Dewar, R. L., H. C. Highbarger, M. D. Sarmiento, J. A. Todd, M. B. Vasudevachari, R. T. Davey, Jr., J. A. Kovacs, N. P. Salzman, H. C. Lane, and M. S. Urdea.1994. Application of branched DNA signal amplifica-tion to monitor human immunodeficiency virus type 1 burden in human plasma. J. Infect. Dis.170:1172–1179.
6.Gatanaga, H., K. Tsukada, H. Honda, J. Tanuma, H. Yazaki, T. Watanabe, M. Honda, K. Teruya, Y. Kikuchi, and S. Oka.2009. Detection of HIV type 1 load by the Roche Cobas TaqMan assay in patients with viral loads previously undetectable by the Roche Cobas Amplicor Monitor. Clin. Infect. Dis.48:260–262.
7.Gueudin, M., J. C. Plantier, V. Lemee, M. P. Schmitt, L. Chartier, T. Bourlet, A. Ruffault, F. Damond, M. Vray, and F. Simon.2007. Evaluation of the Roche Cobas TaqMan and Abbott RealTime extraction-quantification systems for HIV-1 subtypes. J. Acquir. Immune Defic. Syndr.44:500–505. 8.Heid, C. A., J. Stevens, K. J. Livak, and P. M. Williams.1996. Real time
quantitative PCR. Genome Res.6:986–994.
9.Holmes, H., C. Davis, and A. Heath.2008. Development of the 1st Interna-tional Reference Panel for HIV-1 RNA genotypes for use in nucleic acid-based techniques. J. Virol. Methods154:86–91.
10.Holmes, H., C. Davis, A. Heath, I. Hewlett, and N. Lelie.2001. An interna-tional collaborative study to establish the 1st internainterna-tional standard for HIV-1 RNA for use in nucleic acid-based techniques. J. Virol. Methods
92:141–150.
11.Kievits, T., B. van Gemen, D. van Strijp, R. Schukkink, M. Dircks, H. Adriaanse, L. Malek, R. Sooknanan, and P. Lens.1991. NASBA isothermal enzymatic in vitro nucleic acid amplification optimized for the diagnosis of HIV-1 infection. J. Virol. Methods35:273–286.
12.Korn, K., B. Weissbrich, C. Henke-Gendo, A. Heim, C. M. Jauer, N. Taylor, and J. Eberle.2009. Single-point mutations causing more than 100-fold underestimation of human immunodeficiency virus type 1 (HIV-1) load with the Cobas TaqMan HIV-1 real-time PCR assay. J. Clin. Microbiol.47:1238– 1240.
13.Lima, V., R. Harrigan, and J. S. Montaner.2009. Increased reporting of detectable plasma HIV-1 RNA levels at the critical threshold of 50 copies per milliliter with the Taqman assay in comparison to the Amplicor assay. J. Acquir. Immune Defic. Syndr.51:3–6.
14.Manavi, K.2008. The significance of low-level plasma HIV viral load on COBAS TaqMan HIV-1 assays for patients with undetectable plasma viral load on COBAS Amplicor monitor version 1.5. HIV Clin. Trials9:283–286. 15.Menzo, S., P. Bagnarelli, M. Giacca, A. Manzin, P. E. Varaldo, and M. Clementi.1992. Absolute quantitation of viremia in human immunodefi-ciency virus infection by competitive reverse transcription and polymerase chain reaction. J. Clin. Microbiol.30:1752–1757.
16.Murphy, D. G., L. Cote, M. Fauvel, P. Rene, and J. Vincelette.2000. Mul-ticenter comparison of Roche COBAS AMPLICOR MONITOR version 1.5, Organon Teknika NucliSens QT with Extractor, and Bayer Quantiplex version 3.0 for quantification of human immunodeficiency virus type 1 RNA in plasma. J. Clin. Microbiol.38:4034–4041.
17.Schumacher, W., E. Frick, M. Kauselmann, V. Maier-Hoyle, R. van der Vliet, and R. Babiel.2007. Fully automated quantification of human immu-nodeficiency virus (HIV) type 1 RNA in human plasma by the COBAS AmpliPrep/COBAS TaqMan system. J. Clin. Virol.38:304–312.
18.Schutten, M., E. Fries, C. Burghoorn-Maas, and H. G. Niesters.2007. Evaluation of the analytical performance of the new Abbott RealTime RT-PCRs for the quantitative detection of HCV and HIV-1 RNA. J. Clin. Virol.
40:99–104.
19.Schutten, M., and H. G. Niesters.2001. Clinical utility of viral quantification as a tool for disease monitoring. Expert Rev. Mol. Diagn.1:153–162. 20.Schutten, M., D. Peters, N. K. Back, M. Beld, K. Beuselinck, V. Foulongne,
A. M. Geretti, L. Pandiani, C. Tiemann, and H. G. Niesters.2007. Multi-center evaluation of the new Abbott RealTime assays for quantitative de-tection of human immunodeficiency virus type 1 and hepatitis C virus RNA. J. Clin. Microbiol.45:1712–1717.
21.Schutten, M., B. van den Hoogen, M. E. van der Ende, R. A. Gruters, A. D. Osterhaus, and H. G. Niesters.2000. Development of a real-time quantita-tive RT-PCR for the detection of HIV-2 RNA in plasma. J. Virol. Methods
88:81–87.
22.Smit, E., S. Bhattacharya, H. Osman, and S. Taylor.2009. Increased fre-quency of HIV-1 viral load blip rate observed after switching from Roche Cobas Amplicor to Cobas Taqman assay. J. Acquir. Immune Defic. Syndr.
51:364–365.
23.Yao, J. D., J. J. Germer, F. Damond, B. Roquebert, and D. Descamps.2008. Plasma load discrepancies between the Roche Cobas Amplicor human im-munodeficiency virus type 1 (HIV-1) Monitor version 1.5 and Roche Cobas AmpliPrep/Cobas TaqMan HIV-1 assays. J. Clin. Microbiol.46:834.