IMPACT OF COST OF CAPITAL ON CAPITAL STRUCTURE -
EVIDENCE FROM INDIAN PAPER INDUSTRY
Dr. A. Vijayakumar,
Corresponding author: Associate Professor of Commerce, Erode Arts and Science College, Erode, Tamil Nadu, India.
Ms. A. Karunaiathal,
Ph.D., Research Scholar in Commerce, Erode Arts and Science College, Erode, Tamil Nadu, India.
ABSTRACT
Financing the firm’s assets is a very crucial problem in every business and as a general rule there should be a proper mix of debt and equity capital in financing firm’s assets. While designing an optimal capital structure, the management has to keep in mind the objective of maximizing the value of the firm and minimizing the cost of capital. Measurement of cost of capital from various sources is very essential in planning the capital structure of any firm. The present study made an attempt to estimate the cost of capital and its empirical relationship with the capital structure. Simple regression analysis is used to examine the relationship between debt equity and weighted average cost of capital of the selected companies during the study period. The weighted average cost of capital exposed a negative relationship in seven out of ten companies. The result of correlation analysis also disclosed a negative relationship between capital structure and cost of capital of majority (seven out of ten) of the selected large scale companies in the Indian paper industry.
Keywords: Cost of capital, Capital Structure, Cost of Debt, Cost of Equity, Weighted Average Cost of Capital and Indian Paper Industry.
Introduction
Finance is a life-blood of any organization. Almost all kinds of business activities, directly or
finance, which can be tapped to meet the financial requirements by the corporate sectors. But,
no finance is free of cost. The cost of capital of a firm is the minimum rate of return expected
by its investors. It is the weighted average cost of various sources of finance used by the firm.
The capital used by the firm may be in the form of debt, preference capital, retained earnings
and equity shares. In case a firm is not able to achieve even the cut- off rate, the market value
of its shares will fall. In fact, cost of capital is the minimum rate of return expected by its
investors which will maintain the market value of shares at its present level. Hence, to
achieve the objective of wealth maximization, a firm must earn a rate of return more than its
cost of capital. Further, optimal capital structure maximizes the value of a firm and hence the
wealth of its owners and minimizes the firm‟s cost of capital. The cost of capital of a firm has
a direct relationship with the risk involved in the firm. Generally, higher the risk involved in a
firm, higher is the cost of capital. The cost of capital can also be used to evaluate the financial
performance of top management. The actual profitability of the project is compared to the
projected overall cost of capital and the actual cost of capital of the project. If the actual
profitability of the project is more than the projected and the actual cost of capital, the
performance may be said to be satisfactory. It is also used in making other financial decisions
such as dividend policy, capitalization of profits, making the rights issue and working capital
decisions.
Basically, there are two major sources of finance, i.e., debt and equity. Out of these
two, debt is considered as the cheaper source of finance due to tax deductibility of interest
payments. As Gitman Lawrence (1991) stated that in the current market oriented policies,
the corporate managers have been motivated to use more debt financing for several reasons.
One of the reasons is that, debt is a cheaper source of finance and equity is a dearer source.
An increase in the usage of debt in the overall capital structure will result in an overall
decline in the Weighted Average Cost of Capital (WACC). The WACC is the overall cost of
capital, which is calculated, taking into account the cost of various components of capital
structure of a company. It depends upon the specific cost of capital of individual sources of
finance and the proportion of different sources in the total capital structure of the firm. One
financing mix or capital structure is represented by one WACC, which may change whenever
there is change in the financial mix. So, a firm can change its WACC by changing the
capital and the value of the firm are inversely related. Rustagi (1999) stated that value of the
firm would be higher if the cost of capital is lower. But, what is the relationship among the
financing mix, cost of capital and value of the firm? Can the value of the firm be maximized
by affecting the financing mix or by affecting the cost of capital? If leverage affects the cost
of capital and the value of the firm, then a firm should try to achieve an optimal capital
structure or optimal financing mix and thus minimizing the cost of capital. These are some of
the queries on which divergent views have been expressed. In fact, establishing the
relationship between the leverage, cost of capital and value of firm is one of the most
controversial issues in financial management.
A firm should make a judicious use of both debt and equity to achieve a capital
structure, which may be called as the optimum capital structure. Pandey (2000) stated that
optimum capital structure results in a situation where WACC of the firm is minimum and as a
result maximum value of the firm could be ensured. The value of the firm increases with an
increase in financial leverage but up to a certain limit. Beyond this limit, the increase in
financial leverage will increase its WACC and hence, the value of the firm will decline.
Modigliani and Miller (1959) gave logically consistent behavioural justification for this
relationship. They denied the existence of optimum capital structure. Barges (1963) tested
the M-M hypothesis. He found that the cost of capital comes down with leverage. Wippern
(1966) also conducted a test to study the relationship between average cost of capital and
leverage, by running regression on the data of 50 firms. He concluded that the traditional
approach holds good which establishes significant relationship between cost of capital and
capital structure. Similarly Mathew (1991) studied the impact of capital structure on cost of
capital of different companies. It can therefore be seen that the empirical studies attempted by
various researchers have not given uniform conclusions. In this part, the researcher made an
attempt to empirically study the actual measurement of the cost of capital and the impact of
cost of capital on capital structure of the selected companies in Indian paper industry.
Statement of the Problem
Financing the firm‟s assets is a very crucial problem in every business and as a
general rule there should be a proper mix of debt and equity capital in financing firm‟s assets.
objective of maximizing the value of the firm and minimizing the cost of capital.
Measurement of cost of capital from various sources is very essential in planning the capital
structure of any firm. The present study made an attempt to estimate the cost of capital and its
empirical relationship with the capital structure. Based on the above facts, the researcher has
probed the following questions.
1. Is there any relationship between capital structure and cost of capital?
Selection of sample
Keeping in view of the scope of the study, it is decided to include all the large scale
paper companies under Indian paper industry working before or from the year 1996-97 to
2009-2010. There are 21 large scale paper companies operated in India. But, owing to several
constraints such as the non-availability of financial statements or the non-working of a
company in a particular year and merger and acquisition etc., it is compelled to restrict the
number of sample companies to ten. The Capitaline and CMIE database publish key financial
data of Indian corporate sector systematically. Hence, Capitaline and CMIE databases proved
to be complimentary to finalize the sample for the study. The exhaustive list of paper industry
in India from Capitaline was cross checked with CMIE database to sort out companies to fit
in as the sample for the study. The comprehensive list of companies prepared from the
database was modified by sorting out the firms using the following criteria.
(i) Those were not in operation for a year during the period of study.
(ii) Those were in operation but non-availability of data for the whole study period.
(iii) Those that were merged with another company during the period of study.
(iv) Those that had below 50,000 MT installed capacity.
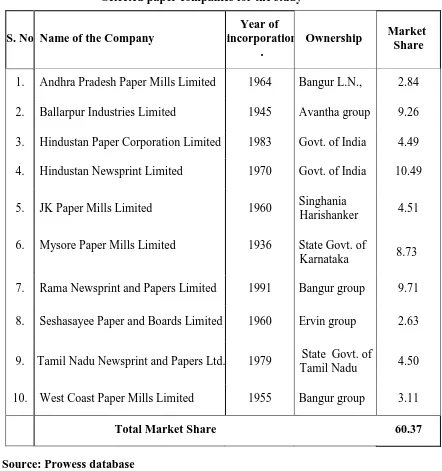
The list of large paper companies selected included in the present study along with
the year of incorporation, ownership pattern and its market share is presented in Table 1. It is
evident from Table 1 that sample companies represent 60.37 percentage of market share in
the Indian paper industry. Thus, the findings based on the occurrence of such representative
Period of study
The period 1997-98 to 2009-10 is selected for this study of Indian paper industry.
This 13 years period is chosen in order to have a fairly, reasonably reliable and up -to-date
financial data would be available.
Sources of data
The data required for the study have been obtained from secondary sources. The study
is mainly based on secondary data. The major sources of data analysed and interpreted in this
study related to all those companies selected is collected from “PROWESS” database, which
is the most reliable and the empowered corporate database of Centre for Monitoring Indian
Economy (CMIE). Besides Prowess database, relevant secondary data have also been
collected from BSE Official Directory, CMIE publications, published annual reports of the
companies, annual survey of industries, business news papers, Reports on Currency and
Finance, Centre for Industrial and Economic Research (CIER‟s) Industrial Data Book,
publications of the Indian Pulp and Paper Technical Association (IPPTA), Libraries of
various research institutions, through internet and from official websites of the selected
companies. Various journals and periodicals on finance and industry have also been
reviewed.
Computation of specific cost of capital
The cost of capital constitutes an integral part of investment decisions. A company
uses more than one type of capital. The composite cost of capital lies between the least and
the most expensive funds. In order to calculate the composite cost of capital, the
determination of specific cost of capital should be made first. Since no information regarding
cost of capital was available in the published data, an attempt has been made in this part to
calculate the cost of debt and cost of equity as specific cost of capital and finally the overall
cost of capital i.e. weighted average cost of capital of the selected large scale companies in
Indian paper industry for the periods under study. Cost of preference share capital was not
attempted in this study because of the reliance of preference share capital is very little in the
selected companies and it is believed that this exclusion would not materially affect the broad
Cost of debt
The cost of debt is defined in terms of the minimum required rate of return that the
debt investment must yield to protect the shareholders‟ interest. Since payment of interest on
debt is tax deductible, the cost of debt is the contractual interest rate adjusted for the tax
liability of a firm. As per the formula the cost of debt is calculated by-
Kd = (Interest / Total borrowings)* (1-t)
Where, Kd - Cost of debt capital after taxes and
„t' - Marginal tax rate applicable to the company.
While calculating the total debt, all short-term as well as long-term borrowings have been
included because all debts are interest bearing. Therefore, interest paid during the financial
year has been considered as total interest expenses. Because of the tax deductibility of
interest, generally the cost of borrowed fund is computed as an after-tax rate of interest.
Cost of equity capital
As the company is not legally bound to pay dividends to equity shareholders and also
the rate of dividend on equity capital is not fixed, it is sometimes called that the equity capital
is free of cost. But, it is fallacious to assume equity capital is free of cost, because equity
shareholders supply funds to the firm in expectation of dividend plus capital gains. Thus, the
shareholders required rate of return, which equates the present value of the expected
dividends with the market price of the share is the cost of equity. Estimating cost of equity is
very much cumbersome because no specific and certain cash inflow by way of dividends is
available. Instead of profits, there may be losses. However, in the financial literature, the
experts have identified several alternative approaches for estimating cost of equity capital.
Keeping in view of several limitations of the approaches, the CAPM approach has been
attempted in this study.
Capital Asset Pricing Model Approach (CAPM)
It is widely agreed in the academic literature and by the practitioners that the
reflects the investor‟s views on the risk and return characteristics on different investments.
The most widely used and the simplest technique for estimating the cost of equity capital is
CAPM. Various approaches are used to compute the cost of equity when a firm earns profit.
But, if the firm suffers loss, does it mean that it does not have any cost of equity? Because
these approaches may result in a negative figure which is ridiculous. The equity does have
some cost; in such a situation CAPM is the best model to calculate the cost of equity. This
model holds that firm‟s equity cost is the risk free rate of return for a stock plus premium
representing the volatility of share prices. According to this model, cost of equity is the
shareholders‟ expected rate of return and it is calculated by applying the following formula-
ke = Rf + b (Rm - Rf)
Where,
b - Beta value,
Rf - Risk-free rate and
Rm - Rate of return on market portfolio.
In this study the average short-term interest rate of commercial banks was considered as a
proxy for risk free rate of return. The CAPM approach uses the beta co-efficient to estimate
the required rate of returns on the securities. The CAPM specifies that the required rate of
return on the share capital depends upon the beta. A security‟s beta indicates how closely the
security‟s returns move with the returns from a diversified portfolio. Thus, when the investors
are well diversified, beta is an important indication of risk and hence, determines what people
are willing to pay for the security. The beta is a measure of the systematic or non diversifiable
risk from owning a particular stock and mathematically derived from a regression analysis of
how a change in the market index affects the returns of the individual stock. For example, a
beta of 1.1 indicates 10 per cent change in the market index and this will give rise to
11 per cent change in the stock. This holds for both positive and negative changes. Thus, a
beta greater than one imply that the stock is more volatile than the market. Conversely, a beta
less than one imply the stock is less volatile than the market. The market rate of return has
year to year (on yearly average basis) basis for a period of 13 years. The yearly return of the
index numbers has been computed by using the following
Rm = [(Index number for current year-Index number for the previous year)
/ Base years index) * 100]
This approach appears to be better as it incorporates risk element also while
estimating the cost of equity. From this point of view, CAPM approach is used irrespective of
profit or losses.
Weighted Average Cost of Capital (WACC)
The WACC is the overall cost of capital, which is calculated by taking into account
the cost of various components of capital structure of a company. It depends upon the specific
cost of capital of individual sources of finance and the proportion of different sources in the
total capital structure of the firm. One financing mix or capital structure is represented by one
WACC, which may change whenever there is change in the financial mix. So, a firm can
change its WACC by changing the financing mix and can thus affect the value of the firm.
An increase in the usage of debt in the overall capital structure will result in an overall decline
in the weighted average cost of capital (WACC). The composite cost of all capital lies between
the least and the most expensive funds. Thus, the cost of capital when it is measured on the basis
of the weights in the total capital structure is known as weighted average cost of capital. The
weighted average cost of capital can be calculated as:
WACC (Ko) = Pd (Kd) +Pe (Ke)
Where, Ko - Overall weighted average cost of capital
Pd - Proportion of debt to total capital
Kd - Cost of debt
Pe - Proportion of equity to total capital
Ke - Cost of equity
The assignment of weights to specific sources of funds is a difficult task.
superior to book value weights because market prices of securities fluctuate widely and
frequently. The cost of capital calculated according to the market value weights is usually
higher than the book value weights and market values weights are sometimes preferred to the
book value weights because the market value represents the true value of the investors.
Hence, the market value weights are used in this study to compute the proportion of debt and
equity in the capital structure.
Impact of capital structure on cost of capital
Cost of capital concept has a pivotal place in the theory of financial management as a
criterion of allocating capital. The theorists and practitioners in recent years have paid a
considerable attention towards this concept. Though a lot of literature is available on the cost
of capital, the question of the effect of capital structure on the cost of capital still remains
unresolved. This question is one of the contentious areas in the field of finance. Different
theories have been propounded by different authors explaining the relationship between
capital structure and cost of capital. This has resulted into various conceptual difficulties. The
traditional view is that the cost of capital is a function of capital structure (Van Horne,
1996).On the other hand, Modigliani and Miller (MM) hold the view that the cost of capital
to a firm remains invariant to the capital structure changes (Modigliani and Miller, 1958).
Both the views have been found to be analytically sound and logical and have been supported
by empirical observations. The two approaches arrive at different conclusions because of the
variation in the assumptions of the two models. The assumption of perfect capital market is
the main point of difference. According to this assumption the information is costless and
readily available to all investors; there are no transaction costs; and all securities are infinitely
divisible. The investors are assumed to be rational, and to behave accordingly. MM
undergoes this assumption while the others ignore it. Kinsman (1975), Lee (1976),
Chakrabarthy (1977), Titman (1988), Mathew (1991), Ghanbari (1993), Dhankar and
Booru (1996) and Chaudhry (1997) studied impact of cost of capital on capital structure and
found both positive and negative relationship between them. As the issue has not been settled
yet, there is a need for conducting further empirical studies. Thus, in this part an attempt has
been made to empirically study the impact of weighted average cost of capital on capital
the debt equity ratio and weighted average cost of capital of the selected large scale
companies in Indian paper industry.
Table 2 brings to light that among the selected companies, Mysore Paper Mills
Limited recorded the highest debt equity ratio of 2.25 and it was the lowest in Hindustan
Newsprint Limited (0.10). In case of weighted average cost of capital, Rama Newsprint and
Papers Limited registered the highest cost of 27.46 per cent, while Seshasayee Paper and
Boards Limited (11.74 per cent) registered the lowest cost of capital during the study period.
The mean value of weighted average cost of capital of all the selected companies during the
study period is 14.89 percent, while the debt equity ratio is 1.29. The firms with increased
cost of capital may have high or low debt equity ratio but less proportion of debt capital in a
number of cases led to lower cost of capital, as companies exploited the investors by paying
lower dividends and excessive dependence on debt in either situation led to higher cost of
capital. Thus, the cost of capital is highly influenced by cost of equity because it is the
maximum in all the selected companies compared with the respective cost of debt. Thus, the
result of this study supports the net income approach, which is based on the assumption that
the cost of debt is always lesser than the cost of equity.
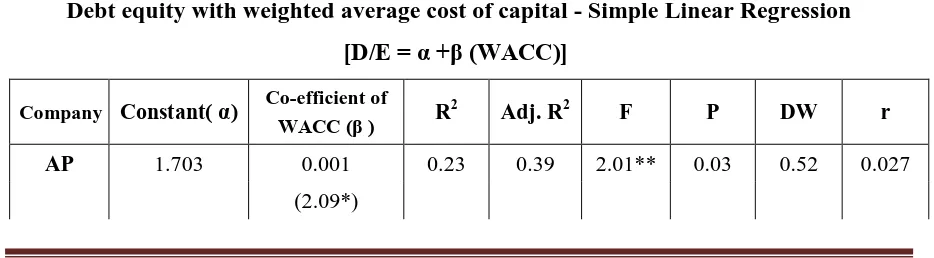
Table 3 exposes the regression analysis of the capital structure with weighted average
cost of capital of the selected companies during the study period. The linear regression model
fitted to test debt equity with WACC is as follows.
D/E = α + β (WACC) + e
Where,
D/E - Debt equity ratio,
α, β - Parameters to be estimated (intercept and co-efficient) and
e - Error term.
The result of the relationship between capital structure and weighted average cost of
capital is presented in Table 3. It is divulged from the table that the linear model of debt
equity with WACC has proved to be a good fit of the model. This is revealed from the value
WACC explains about 54 per cent of variation in capital structure of sector average. Among
the selected companies this variation ranges from 16 per cent in Seshasayee Paper and Boards
Limited to 88 per cent in Hindustan Newsprint Limited during the study period. The mean
value of the beta co-efficient of WACC declares a negative value of -0.003, which indicates
an inverse relationship between the capital structure and WACC. The beta co-efficient of
WACC exposed a negative relationship in seven out of ten companies.
The empirical result also communicates that the „t‟ value of Andhra Pradesh Paper
Mills Limited, Ballarpur Industries Limited, Hindustan Paper Corporation Limited,
Hindustan Newsprint Limited, Seshasayee Paper and Boards Limited, Tamil Nadu Newsprint
and Papers Limited and West Coast Paper Mills Limited are statistically significant in
explaining the relationship between capital structure and cost of capital at five per cent
level of significance. On the other hand, JK Paper Mills Limited, Mysore Paper Mills Limited
and Rama Newsprint and Papers Limited are statistically insignificant in explaining the
relationship between capital structure and cost of capital. Thus, it is inferred from the analysis
that the cost of capital is a significant factor which affects the capital structure of majority of
the selected large scale companies in the Indian paper industry. The result of correlation
analysis also disclosed a negative relationship between capital structure and cost of capital
(seven out of ten) of the selected large scale companies in the Indian paper industry.
Hence, this study concludes that there exists a negative relationship between capital
structure and the cost of capital of the selected large scale companies in the Indian paper
industry. The results confirm the postulated negative connection between debt equity and cost
of capital in few cases as was concluded by Ghanbari (1993), Dhankar and Booru (1996)
and Chaudhry (1997). The result is contradictory to the findings of Kinsman (1975), Lee
(1976), Chakrabarthy (1977), Titman (1988), Mathew (1991) Walter Kielholz (2000),
Daljit Kaur (2000) and Karamjeet Singh (2006) who postulated positive relationship
between cost of capital and capital structure. Thus, it is concluded that debt is a cheaper
source of fund than equity, but a company cannot go on minimizing its overall cost of capital
by employing more debt in its capital structure. A point is reached beyond which debt
to the shareholders and it will adversely affect the earnings per share and market price of
shares. Thus, the findings of the study support the traditional approach of capital structure.
Conclusion
Simple regression analysis is used to examine the relationship between debt equity and
weighted average cost of capital of the selected companies during the study period. The
weighted average cost of capital exposed a negative relationship in seven out of ten
companies. The result of correlation analysis also disclosed a negative relationship between
capital structure and cost of capital of majority (seven out of ten) of the selected large scale
companies in the Indian paper industry. Many firms during the period under study have
experienced a very high cost of equity capital. These companies have been found to have
very low earnings per share. Low earnings depict that either the companies are not capable of
utilizing their resources efficiently to increase the profits or they are not able to use them
effectively and efficiently due to their obsolete technology. It has been found that in spite of
low profit, the companies are using retained earnings to fund their additional capital
requirements. The companies with lower profits found it very difficult to raise equity capital
in the market. In the absence of a well developed secondary market, the companies found it
easy to use retained earnings or raises debt by giving investors higher rate offers. This
References
1. Gitman Lawrence J. (1991). “Capital Structure in Developing Countries”, The Journal
of Finance, LVI (1):85- 87.
2. Rustagi, R.P (1999). “Impact of Leverage on Profitability of Pantaloon Retail India Limited”, Advances in Management, 3: 52-59.
3. Pandey (2000). “Financing decision; A Study of Management Understanding”,
Management Review, Economic and Political Weekly, 7: 46
4. Modigliani and Miller (1959). “The Cost of Capital, Corporation Finance and the Theory
of Investment”, American Economic Review, (3):.261-297.
5. Barges (1963). “Evidence on the Importance of Financial Structure”, Financial Management, 1(2):.45-50.
6. Wippern (1966). “A Study of Capital Structure Planning in PES”, Financial
Management, 1(2):.45-50.
7. Mathew (1991).“Optimal Financial Leverage–The Ownership Factor”, Finance India, 5(2): 195- 201.
8. James C.Van Horne 1996). “Fundamentals of Financial Management”, New Delhi:
Prentice Hall, p 40.
9. Modigliani, F. and M. Miller (1958). “The Cost of Capital, Corporation Finance and the
Theory of Investment”, American Economic Review, 48: 261-297.
10. Kinsman (1975). “An examination of optimal capital structure and the cost of capital for the electric utility industry”, Dissertation abstracts international, 42(5): 7506.
11. Lee (1976). “The Theory of Optimal Capital Structure- Theoretical and Empirical Investigation”, Dissertation Abstracts International, 42(5): 3807A.
12. Chakrabarthy (1977). “Corporate Capital Structure and Cost of Capital”, The Journal of ICWAI, 18: 211-217.
13. Titman (1988). “The Determinant of Capital Structure Choice”, Journal of Finance, 43: 1-19.
14. Mathew (1991). “Optimal Financial Leverage-the Ownership Factor”, Finance India, 5(2): 195-201.
15. Ghanbari (1993). “Cost of Capital to Indian Industries: An Application of Asset Pricing Model”, Abstract of the Thesis.
16. Dhankar and Booru (1996). “Cost of Capital Optimal Capital Structure and Values of Firms: An Empirical Study of Indian Companies”, Vikalpa, 21(3): 29-36.
17. Chaudhry (1997). “Cost of Capital Structure and Dividend Policy: Theory and
Table 1
Selected paper companies for the study
S. No Name of the Company
Year of incorporation
.
Ownership Market Share
1. Andhra Pradesh Paper Mills Limited 1964 Bangur L.N., 2.84
2. Ballarpur Industries Limited 1945 Avantha group 9.26
3. Hindustan Paper Corporation Limited 1983 Govt. of India 4.49
4. Hindustan Newsprint Limited 1970 Govt. of India 10.49
5. JK Paper Mills Limited 1960 Singhania
Harishanker 4.51
6. Mysore Paper Mills Limited 1936 State Govt. of
Karnataka 8.73
7. Rama Newsprint and Papers Limited 1991 Bangur group 9.71
8. Seshasayee Paper and Boards Limited 1960 Ervin group 2.63
9. Tamil Nadu Newsprint and Papers Ltd. 1979 State Govt. of
Tamil Nadu 4.50
10. West Coast Paper Mills Limited 1955 Bangur group 3.11
Total Market Share 60.37
Source: Prowess database
Table 2
Analysis of capital structure and overall cost of capital
S. No Name of the company Debt equity
ratio
WACC
Source: Computed
Table 3
Debt equity with weighted average cost of capital - Simple Linear Regression
[D/E = α +β (WACC)]
Company Constant( α) Co-efficient of
WACC (β ) R
2
Adj. R2 F P DW r
AP 1.703 0.001 0.23 0.39 2.01** 0.03 0.52 0.027
(2.09*)
1 Andhra Pradesh Paper Mills Limited 0.84 13.94
2 Ballarpur Industries Limited 0.98 14.54
3 Hindustan Paper Corporation Limited 0.88 12.51
4 Hindustan News Print Limited 0.10 14.75
5 JK Paper Mills Limited 2.20 14.98
6 Mysore Paper Mills Limited 2.25 12.50
7 Rama News Print and Papers Limited 1.87 27.46
8 Seshasayee Paper and Boards Limited 1.76 11.74
9 Tamil Nadu Newsprint and Papers Limited 0.89 13.61
10 West Coast Paper Mills Limited 1.17 12.88
BAL 1.386 -0.011 0.61 0.25 2.79** 0.17 1.62 -0.247
(2.87*)
HP 1.533 0.033 0.43 0.65 2.84** 0.10 1.47 0.379
(1.86**)
HNP 1.09 -0.011 0.33 0.88 2.03** 0.06 0.77 -0.052
(1.17)
JK 2.619 -0.02 0.24 0.44 2.56** 0.03 0.85 -0.352
(1.24)
MP 2.614 -0.03 0.76 0.38 2.70** 0.16 0.33 -0.276
(0.95)
RN 2.10 -0.01 0.27 0.61 2.31** 0.10 0.57 -0.164
(.558)
SP 1.129 -0.07 0.21 0.42 2.99** 0.01 1.14 -0.462
(1.89**)
TNP 0.797 0.01 0.09 0.46 2.84** 0.03 0.77 0.291
(2.06**)
WC 1.088 -0.01 0.23 0.16 2.39** 0.09 1.63 -0.621
(2.56*)
Mean 1.348 -0.003 0.52 0.54 2.32** 0.05 0.59 -0.193
(0.727)
‘r’ – Correlation co-efficient;
* - Significant at 0.01 level; ** - Significant at 0.05 Level; Figures within parentheses indicate ‘t’ values
DW- Durbin Watson Statistics