ECO-FRIENDLY PRACTICES – EXAMINING FOR DIFFERENCES
Dr. Ajith Kumar. V.V, Associate Professor – HR & OB,
Symbiosis Institute of Business Management, Bangalore (Constituent of Symbiosis International University)
Symbiosis International University
#95/1, 95/2, Electronics City, Phase-1, Hosur Road, Bangalore, India.
Aarti Mehta Sharma, Assistant Professor – Statistics,
Symbiosis Institute of Business Management, Bangalore (Constituent of Symbiosis International University)
Symbiosis International University
#95/1, 95/2, Electronics City, Phase-1, Hosur Road, Bangalore, India.
A. Vidyasagar,
Professor - Marketing
Symbiosis Institute of Business Management, Bangalore (Constituent of Symbiosis International University)
Symbiosis International University
#95/1, 95/2, Electronics City, Phase-1, Hosur Road, Bangalore, India.
ABSTRACT
More and more people in India are becoming aware of the eco-friendly practices that would
reduce the collective damage being done to our planet. Needless to add, there are substantial
financial benefits that would accrue by adopting certain eco-friendly practices that are not only
easy to put into place but would start showing positive results within a very short period. There
is general belief that once there is awareness of eco-friendly practices, there is a desire to adopt
them. This paper attempts to study the awareness and implementation of eco-friendly practices
among managers and future managers (students of MBA). It will also attempt to test several
hypotheses of eco-friendly behavior based on Educational Background, Age, place of origin,
work-experience etc. Data for the same will be collected from primary and secondary sources
Keywords: Awareness, Managers, Future Managers, eco-friendly.
Introduction:
In the new millennium concern about the environment has becomes not only a significant public
issue but also a crucial topic in academic research. A positive change with consumers behavior
towards environmental related products can be seen due to the increased level of environmental
awareness since the 1970s (Alwitt and Pitts, 1996). This change contributed to the start of the
green practices revolution to prevent further damage to the environment .More and more people
in India are becoming aware of the eco-friendly practices that would reduce the collective
damage being done to our planet. There are substantial financial benefits that would accrue by
adopting certain eco-friendly practices that are not only easy to put into place but would start
showing positive results within a very short period.
Green practices refer to actions that protect the environment and/or products made with little
environmental harm because they are produced in an environmentally and ecologically friendly
way (Tzschentke et al., 2004, 2008). Examples of green practices include using renewable
resources, conserving water and implementing a recycling program
In Bangalore itself there are several organizations who have taken concrete steps to not only
spread awareness about eco-friendly practices but have implemented some of the practices in
their organization for eg. Energy savings by using CFL‟s, encouraging car-pools, providing
transportation to employees, recycling of waste & segregation, reusing paper that has printingon
only one side, reduction in paper usage etc.
Review of Literature:
Kaplan (1991) found that a person‟s knowledge about an issue significantly influences one‟s
decision making regarding that issue. For example, people‟s knowledge about green practices
and their own use of them will influence their decision to choose a business that also follows
green practices. Moreover, numerous studies have shown that knowledge about the environment
generally motivates people to behave in an environmentally responsible manner and choose
have looked at the impact of demographic factors and how they relate to the perception of green
practices and consumer behavior (Gronhoj and Olander , 2007; Hu et., 2010; Newell and Green,
1997; Roberts. 1996; Schubert et al., 2010 Zimmer et al., 1994). The studies have found that in
general demographic factors are significantly related to consumer beliefs about green practices
and environmental practices by organizations, but the results are not always consistent.
The research related to gender and perception of green practices is also not consistent. In a study
done in the USA by Schubert et al. (2010) the research found that female respondents thought
that restaurants that utilize green practices are healthier for them. They also consistently rated
the importance of green practices higher than males. In a different study done in Taiwan, Hu et
al. (2010) found no significant differences between the genders in their study of restaurant
patrons regarding customers intention to patronize a green restaurant. Another study that was
done in Denmark with 100 families surveyed male and female spouses in order to determine if
there were any differences between them (Gronhoj and Olander , 2007). This study showed that
though there were differences between the genders related to the roles and role behaviors in the
family, there were not statistically significant differences related to consumer behavior and
perception of green behaviors quantitatively. Females in this study were more apt to consider
their environmental actions as they relate to society as a whole and to be more cognizant of green
behaviors (Gronhoj and Olander, 2007).Research related to education level has shown that the
more educated a person is , the more that they tend to know about green practices and the higher
value that they place on those green practices (Hu et al., 2010).Another study by Newell and
Green (1997) analyzed the racial differences that exist between people related to their
perceptions of environmental behaviors. Their study found that there is not as much of a
difference between races as the education and income level of the people increased. The study
found that higher education and income levels of people are related to stronger positive opinions
about green practices and environmental concern (Newell and Green, 1997).
The current paper aims to study the awareness of managers and future managers about eco
awareness of eco friendly practices at the work place with respect to the designation and
specialization of the respondents.
.
Research Methodology
This study analyzed the awareness of green practices among managers and would be managers
(students). The study used a convenience sample of 199 respondents who responded via email in
January 2014. The survey was sent to 1000 email addresses with two reminder emails. The data
were analyzed with SPSS version 17 using descriptive statistics, independent samples t test, Chi
Square test, Cross tabs, ANOVA and post hoc tests in order to respond to the research questions.
The survey asked respondents about the eco friendly practices they were aware of and the ones
they followed, especially at the workplace. The idea being that higher awareness would lead to
higher implementation of eco friendly practices at the workplace. The survey asked 197
respondents about the level of importance using a Likert type scale that they placed on various
practices ranging from 1 Strongly Disagree, to 5 Strongly Agree. Respondents were also asked to
indicate their level of agreement with regard to a variety of statements about the use of green
practices in various industries. Data was analysed with respect to age, gender, education,
seniority at workplace and functional area.
Objective
The primary objective of this paper was to study the awareness and implementation of
eco-friendly practices among managers and future managers (students of MBA). To help achieve this
primary objective, the following research questions were analyzed for this study.
H1: There are no differences between demographic variables such as age related to respondents
awareness and usage of eco friendly practices
H2: There are no differences between demographic variables such as gender related to
H3: There are no differences between different functional areas (operations/finance/HR/
Marketing) related to respondents awareness and usage of eco friendly practices
Findings
The results have shown remarkable level of consistency with earlier studies where the responses
are uniform with respect to age, management levels in organizations and educational
backgrounds. There are differences in some parameters with respect to gender and area of
specialization. Unlike in the west, it has been noticed that the female gender is by and large more
eco friendly. In the same vein, it was noticed that students as well as working managers in the
area of Operations come out as being more eco-friendly.
The reliability test was carried out for four dimensions- based on Likert. The resulting Cronbachs
Alpha was 0.900 which showed that there was high internal consistency.
A simple descriptive analysis was carried out on all the data.
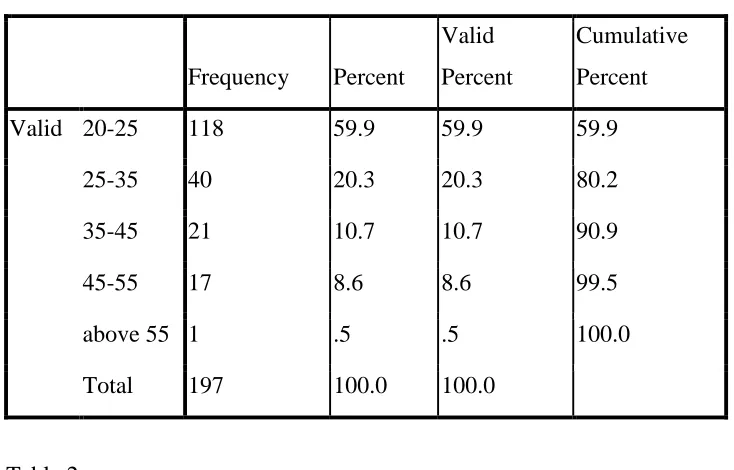
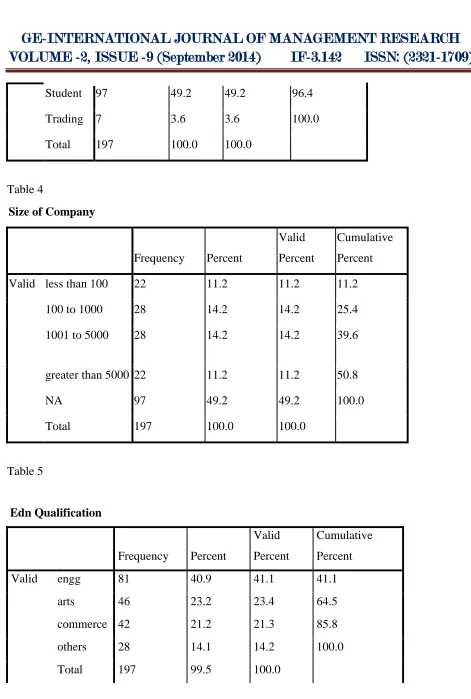
Tables 1 to 7 present the demographic profile of the respondents. There were a total of 197
respondents with a larger part of the sample belonging to the age group 20-25. Respondents were
equally divided among the two genders with 97 female and 100 male respondents.
Approximately 26 % of the sample was from the IT industry and about 50 % of the sample
consisted of students. Other respondents were from the manufacturing, services and trading
industries. The size of the company varied from less than 100 to 5000. Half of the sample
consisted of students and half of working people with the largest share (21.3 %) belonging to
lower management levels. Respondents were drawn nearly equally from various specializations
with 26.4% from Operations, 27.9 % from marketing, 22.3 % from Finance and 23.4 % from
Human Resources.
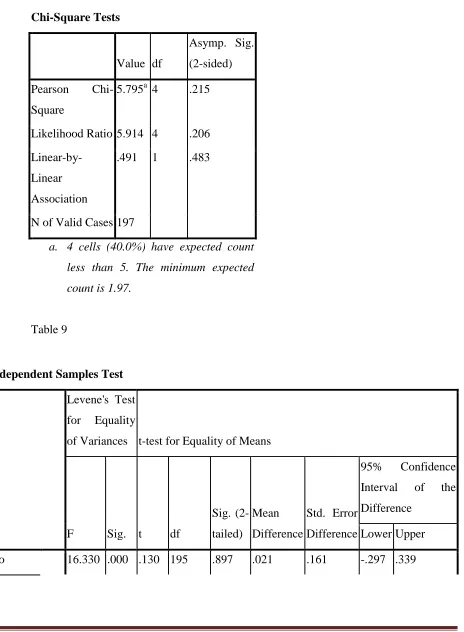
In Table 8 we have presented a cross tab to analyze if consumers actually consider the effect on
the environment before purchasing day to day products. A Likert scale has been used for the
responses and a chi-square test has been applied. It was analysed that consideration is
In Table 9, the same data was analysed with respect to age, area of specialization and educational
levels. There was no significant statistical difference among the various demographic variables.
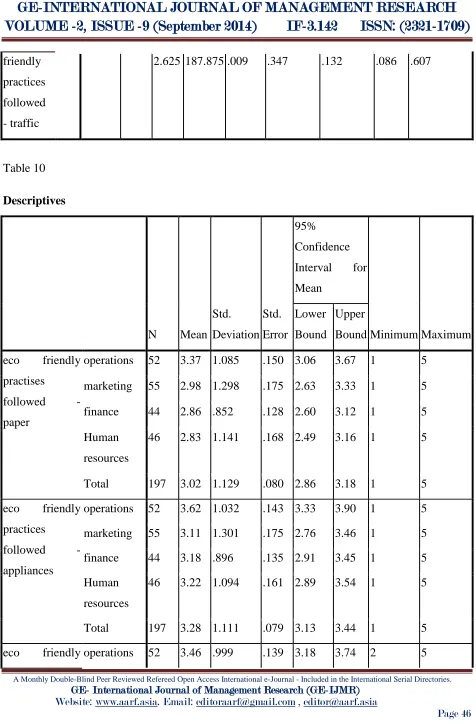
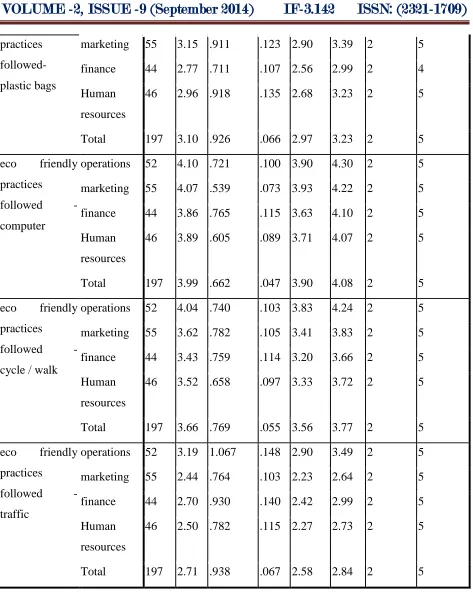
Table 10 checked the eco-friendly practices the respondents were following. There were six
statements to which respondents had to give their degree of concurrence on a 5 point Likert
scale. Out of the six statements that were responded to, there were differences with respect to
gender on only two parameters i.e for walking short distances and behavior at traffic stops.
Women were more eco friendly than men.
Table 12 checked for differences on the same parameters with respect to specializations; out of
the six attributes there were differences with respect to three attributes. Ratings on three
attributes i.e on usage of plastic bags, cycling/ walking to work and turning off vehicle engines at
traffic stops were statistically significant.
Respondents with Operations specialization were the most eco friendly (Table 11) with the
highest mean on all statements.
Further Tukeys post hoc test (Table 13) was applied to see in which specializations the
differences were Statistically significant. It was seen that Operations scores on all 3 statements
were significantly different and higher form all other specializations.
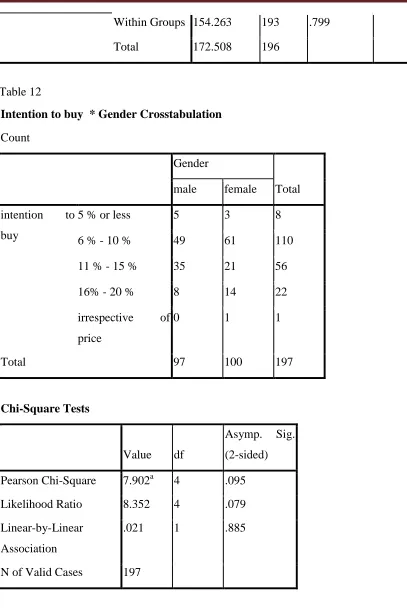
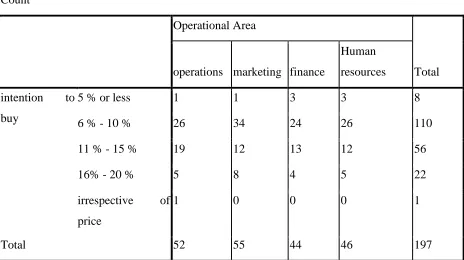
In Table 14 & 15, we tried and estimated the price sensitiveness to eco-friendly products.
Irrespective of gender or specialization, a large majority of respondents – approximately 56%,
were willing to pay 6-10 % more for eco friendly products.
While analyzing for awareness a Likert type scale was applied to 7 statements on a scale of 1-5
which varied from „not at all‟ eco friendly to „highly‟ eco friendly.
Student's t-test was applied (Table 16) to check for differences on all parameters with respect to
gender. There was statistically significant difference between the genders on two parameters i.e
to the usage of paper plates (0.08) and to throwing away of shopping bags (.006) By applying
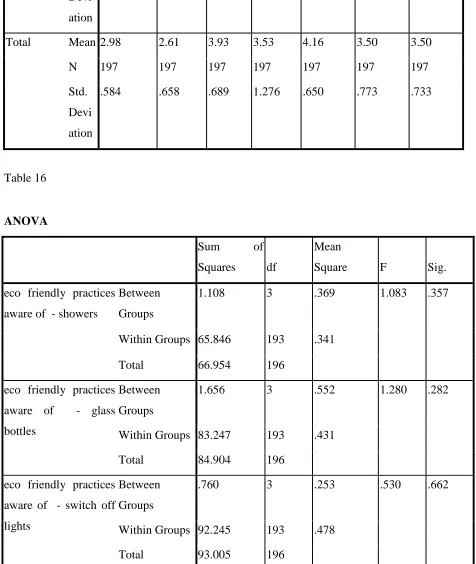
ANOVA (Table 18) with respect to specializations it was found there was no significant
difference between the different specializations. However, while examining means (Table 17) it
We then moved to looking at organizations overall philosophy regarding sustainability. Students
t-test was applied to the data (Table 19). Out of the 8 parameters tested, Men and women reacted
the same way except on one (p=0.03) “we evaluate our policies/ procedures to reduce negative
impact on the environment”. ANOVA was applied to check for differences with respect to
specializations (Table 20). There was statistical difference in two parameters only. The
difference was in the statement
“Organizations in developing countries need to worry about sustainable growth” (p=.045)
and
“We feel environmentally friendly practices can help to save money in the long run”
(p=0.44)
Applying Tukey‟s test it was found that the difference (p=0.49) was between Operations and
finance specializations only (Table 21)
In any research, it is imperative to check if there is an inclination to be proactive when it came
down to actually implementing green practices. In this context, we restricted the final question
only to managers and probed on how much they thought that they will be able to influence
decisions regarding eco friendly practices in their organizations.
Again more women than men felt that they would be able to influence decisions. A t-test analysis
showed that the two genders differed significantly on only three out of eight parameters (Table
22). Chi Square and ANOVA did not yield significant results hence simple cross tabs were done
by tabulating across specializations (Table 23).
Data Analysis
Descriptives
Age of respondent
Frequency Percent
Valid
Percent
Cumulative
Percent
Valid 20-25 118 59.9 59.9 59.9
25-35 40 20.3 20.3 80.2
35-45 21 10.7 10.7 90.9
45-55 17 8.6 8.6 99.5
above 55 1 .5 .5 100.0
[image:8.612.70.491.73.713.2]Total 197 100.0 100.0
Table 2
Gender
Frequency Percent
Valid
Percent
Cumulative
Percent
Valid female 97 49.2 49.2 49.2
male 100 50.8 50.8 100.0
[image:8.612.69.436.105.340.2]Total 197 100.0 100.0
Table 3
Industry
Frequency Percent
Valid
Percent
Cumulative
Percent
Valid IT 52 26.4 26.4 26.4
Mfg 26 13.2 13.2 39.6
Student 97 49.2 49.2 96.4
Trading 7 3.6 3.6 100.0
Total 197 100.0 100.0
Table 4
Size of Company
Frequency Percent
Valid
Percent
Cumulative
Percent
Valid less than 100 22 11.2 11.2 11.2
100 to 1000 28 14.2 14.2 25.4
1001 to 5000 28 14.2 14.2 39.6
greater than 5000 22 11.2 11.2 50.8
NA 97 49.2 49.2 100.0
[image:9.612.65.536.6.705.2]Total 197 100.0 100.0
Table 5
Edn Qualification
Frequency Percent
Valid
Percent
Cumulative
Percent
Valid engg 81 40.9 41.1 41.1
arts 46 23.2 23.4 64.5
commerce 42 21.2 21.3 85.8
others 28 14.1 14.2 100.0
Total 198 100.0
Table 6
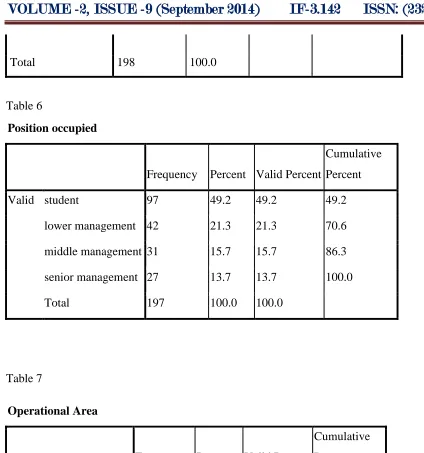
Position occupied
Frequency Percent Valid Percent
Cumulative
Percent
Valid student 97 49.2 49.2 49.2
lower management 42 21.3 21.3 70.6
middle management 31 15.7 15.7 86.3
senior management 27 13.7 13.7 100.0
[image:10.612.66.490.54.507.2]Total 197 100.0 100.0
Table 7
Operational Area
Frequency Percent Valid Percent
Cumulative
Percent
Valid operations 52 26.4 26.4 26.4
marketing 55 27.9 27.9 54.3
finance 44 22.3 22.3 76.6
Human resources 46 23.4 23.4 100.0
Total 197 100.0 100.0
[image:10.612.69.459.454.692.2]As a consumer consider the effect on environment * Gender Cross tabulation
Gender
Total
female male
As a consumer consider
the effect on
environment
strongly Disagree 2 2 4
Disagree 18 29 47
Neither 57 50 107
Agree 18 13 31
strongly Agree 2 6 8
Total 97 100 197
Chi-Square Tests
Value df
Asymp. Sig.
(2-sided)
Pearson
Chi-Square
5.795a 4 .215
Likelihood Ratio 5.914 4 .206
Linear-by-Linear
Association
.491 1 .483
Chi-Square Tests
Value df
Asymp. Sig.
(2-sided)
Pearson
Chi-Square
5.795a 4 .215
Likelihood Ratio 5.914 4 .206
Linear-by-Linear
Association
.491 1 .483
N of Valid Cases 197
a. 4 cells (40.0%) have expected count
less than 5. The minimum expected
[image:12.612.84.548.80.712.2]count is 1.97.
Table 9
Independent Samples Test
Levene's Test
for Equality
of Variances t-test for Equality of Means
F Sig. t df
Sig.
(2-tailed)
Mean
Difference
Std. Error
Difference
95% Confidence
Interval of the
Difference
Lower Upper
friendly
practises
followed -
paper
.130 179.515 .896 .021 .161 -.296 .338
eco
friendly
practices
followed -
appliances
9.176 .003 .567 195 .572 .090 .159 -.223 .403
.569 182.097 .570 .090 .158 -.222 .402
eco
friendly
practices
followed-
plastic
bags
.040 .841 1.257 195 .210 .166 .132 -.094 .425
1.259 192.816 .209 .166 .131 -.094 .425
eco
friendly
practices
followed -
cycle /
walk
.334 .564 2.150 195 .033 .234 .109 .019 .448
2.149 193.801 .033 .234 .109 .019 .448
eco
friendly
practices
followed
-
computer
.325 .569 .641 195 .522 .061 .095 -.126 .247
.642 194.063 .521 .061 .094 -.126 .247
friendly
practices
followed
- traffic
[image:14.612.69.545.37.761.2]2.625 187.875 .009 .347 .132 .086 .607
Table 10
Descriptives
N Mean
Std.
Deviation Std.
Error 95%
Confidence
Interval for
Mean
Minimum Maximum Lower
Bound
Upper
Bound
eco friendly
practises
followed -
paper
operations 52 3.37 1.085 .150 3.06 3.67 1 5
marketing 55 2.98 1.298 .175 2.63 3.33 1 5
finance 44 2.86 .852 .128 2.60 3.12 1 5
Human
resources
46 2.83 1.141 .168 2.49 3.16 1 5
Total 197 3.02 1.129 .080 2.86 3.18 1 5
eco friendly
practices
followed -
appliances
operations 52 3.62 1.032 .143 3.33 3.90 1 5
marketing 55 3.11 1.301 .175 2.76 3.46 1 5
finance 44 3.18 .896 .135 2.91 3.45 1 5
Human
resources
46 3.22 1.094 .161 2.89 3.54 1 5
Total 197 3.28 1.111 .079 3.13 3.44 1 5
practices
followed-
plastic bags
marketing 55 3.15 .911 .123 2.90 3.39 2 5
finance 44 2.77 .711 .107 2.56 2.99 2 4
Human
resources
46 2.96 .918 .135 2.68 3.23 2 5
Total 197 3.10 .926 .066 2.97 3.23 2 5
eco friendly
practices
followed -
computer
operations 52 4.10 .721 .100 3.90 4.30 2 5
marketing 55 4.07 .539 .073 3.93 4.22 2 5
finance 44 3.86 .765 .115 3.63 4.10 2 5
Human
resources
46 3.89 .605 .089 3.71 4.07 2 5
Total 197 3.99 .662 .047 3.90 4.08 2 5
eco friendly
practices
followed -
cycle / walk
operations 52 4.04 .740 .103 3.83 4.24 2 5
marketing 55 3.62 .782 .105 3.41 3.83 2 5
finance 44 3.43 .759 .114 3.20 3.66 2 5
Human
resources
46 3.52 .658 .097 3.33 3.72 2 5
Total 197 3.66 .769 .055 3.56 3.77 2 5
eco friendly
practices
followed -
traffic
operations 52 3.19 1.067 .148 2.90 3.49 2 5
marketing 55 2.44 .764 .103 2.23 2.64 2 5
finance 44 2.70 .930 .140 2.42 2.99 2 5
Human
resources
46 2.50 .782 .115 2.27 2.73 2 5
[image:15.612.72.545.54.659.2]Total 197 2.71 .938 .067 2.58 2.84 2 5
ANOVA
Sum of
Squares df
Mean
Square F Sig.
eco friendly practises
followed - paper
Between
Groups
9.089 3 3.030 2.428 .067
Within Groups 240.830 193 1.248
Total 249.919 196
eco friendly practices
followed - appliances
Between
Groups
8.057 3 2.686 2.215 .088
Within Groups 234.025 193 1.213
Total 242.081 196
eco friendly practices
followed- plastic bags
Between
Groups
12.570 3 4.190 5.204 .002
Within Groups 155.400 193 .805
Total 167.970 196
eco friendly practices
followed - computer
Between
Groups
2.113 3 .704 1.621 .186
Within Groups 83.867 193 .435
Total 85.980 196
eco friendly practices
followed - cycle / walk
Between
Groups
10.710 3 3.570 6.551 .000
Within Groups 105.179 193 .545
Total 115.888 196
eco friendly practices
followed - traffic
Between
Groups
Within Groups 154.263 193 .799
[image:17.612.73.480.76.690.2]Total 172.508 196
Table 12
Intention to buy * Gender Crosstabulation
Count
Gender
Total
male female
intention to
buy
5 % or less 5 3 8
6 % - 10 % 49 61 110
11 % - 15 % 35 21 56
16% - 20 % 8 14 22
irrespective of
price
0 1 1
Total 97 100 197
Chi-Square Tests
Value df
Asymp. Sig.
(2-sided)
Pearson Chi-Square 7.902a 4 .095
Likelihood Ratio 8.352 4 .079
Linear-by-Linear
Association
.021 1 .885
Chi-Square Tests
Value df
Asymp. Sig.
(2-sided)
Pearson Chi-Square 7.902a 4 .095
Likelihood Ratio 8.352 4 .079
Linear-by-Linear
Association
.021 1 .885
N of Valid Cases 197
a. 4 cells (40.0%) have expected count less than 5. The
[image:18.612.73.537.395.655.2]minimum expected count is .49.
Table 13
Intention to buy * Operational Area Crosstabulation
Count
Operational Area
Total operations marketing finance
Human
resources
intention to
buy
5 % or less 1 1 3 3 8
6 % - 10 % 26 34 24 26 110
11 % - 15 % 19 12 13 12 56
16% - 20 % 5 8 4 5 22
irrespective of
price
1 0 0 0 1
Chi-Square Tests
Value df
Asymp. Sig.
(2-sided)
Pearson Chi-Square 9.256a 12 .681
Likelihood Ratio 9.148 12 .690
Linear-by-Linear
Association
1.676 1 .195
N of Valid Cases 197
a. 9 cells (45.0%) have expected count less than 5. The
[image:19.612.70.546.393.656.2]minimum expected count is .22.
Table 14
Eco Friendly practices (Q11) by gender
Independent Samples Test
Levene's
Test for
Equality
of
Variances t-test for Equality of Means
F Sig. t df
Sig.
(2-tailed) Mean
Difference
Std. Error
Difference 95%
Confidence
Interval of
the
Difference
eco friendly
practices
aware of -
showers
Equal
variances
assumed
1.121 .291 -.127 195 .899 -.011 .084 -.175 .154
Equal
variances
not
assumed
-.128 188.887 .899 -.011 .083 -.175 .154
eco friendly
practices
aware of -
glass bottles
Equal
variances
assumed
.904 .343
-2.430
195 .016 -.225 .093 -.408 -.042
Equal variances not assumed -2.440
185.851 .016 -.225 .092 -.407 -.043
eco friendly
practices
aware of -
switch off
lights
Equal
variances
assumed
.211 .647 -.849 195 .397 -.083 .098 -.277 .110
Equal
variances
not
assumed
-.850 194.453 .396 -.083 .098 -.277 .110
eco friendly
practices
aware of -
car pooling
Equal
variances
assumed
3.133 .078 -.860 195 .391 -.156 .182 -.515 .202
Equal
variances
not
assumed
eco friendly
practices
aware of -
paper plates
Equal
variances
assumed
7.083 .008
-1.264
195 .208 -.117 .092 -.299 .065
Equal
variances
not
assumed
-1.267
192.953 .207 -.117 .092 -.299 .065
eco friendly
practices
aware of -
shopping
bags
Equal
variances
assumed
7.699 .006
-1.245
195 .215 -.137 .110 -.354 .080
Equal
variances
not
assumed
-1.249
187.329 .213 -.137 .110 -.353 .079
eco friendly
practices
aware of -
printing
multiple
copies
Equal
variances
assumed
2.415 .122 -.533 195 .595 -.056 .105 -.262 .151
Equal
variances
not
assumed
-.534 192.507 .594 -.056 .104 -.262 .150
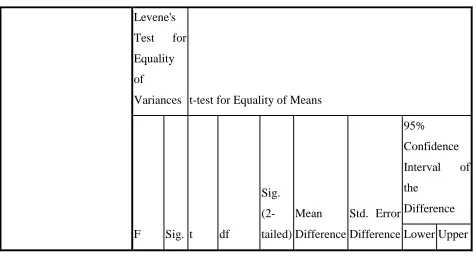
Table 15
Q11 by operational areas
Operational Area eco
friendly
practices
aware of -
showers
eco
friendly
practices
aware of
- glass
bottles eco
friendly
practice
s aware
of -
switch off lights eco friendly practices
aware of
- car
pooling eco
friendly
practices
aware of
- paper
plates
eco
friendly
practices
aware of
- shopping
bags
eco
friendly
practices
aware of
- printing
multiple
copies
operations Mean 3.10 2.69 3.92 3.65 4.19 3.62 3.50
N 52 52 52 52 52 52 52
Std.
Devi
ation
.693 .875 .763 1.153 .715 .796 .728
Marketing Mean 2.98 2.67 4.02 3.65 4.25 3.56 3.56
N 55 55 55 55 55 55 55
Std.
Devi
ation
.561 .579 .707 1.542 .645 .811 .764
Finance Mean 2.89 2.45 3.91 3.36 4.14 3.36 3.36
N 44 44 44 44 44 44 44
Std.
Devi
ation
.538 .548 .640 .865 .554 .718 .685
Human
resources
Mean 2.96 2.59 3.85 3.41 4.04 3.43 3.57
Std.
Devi
ation
.515 .541 .631 1.392 .665 .750 .750
Total Mean 2.98 2.61 3.93 3.53 4.16 3.50 3.50
N 197 197 197 197 197 197 197
Std.
Devi
ation
[image:23.612.68.544.122.686.2].584 .658 .689 1.276 .650 .773 .733
Table 16
ANOVA
Sum of
Squares df
Mean
Square F Sig.
eco friendly practices
aware of - showers
Between
Groups
1.108 3 .369 1.083 .357
Within Groups 65.846 193 .341
Total 66.954 196
eco friendly practices
aware of - glass
bottles
Between
Groups
1.656 3 .552 1.280 .282
Within Groups 83.247 193 .431
Total 84.904 196
eco friendly practices
aware of - switch off
lights
Between
Groups
.760 3 .253 .530 .662
Within Groups 92.245 193 .478
eco friendly practices
aware of - car pooling
Between
Groups
3.496 3 1.165 .713 .545
Within Groups 315.540 193 1.635
Total 319.036 196
eco friendly practices
aware of - paper
plates
Between
Groups
1.194 3 .398 .941 .422
Within Groups 81.608 193 .423
Total 82.802 196
eco friendly practices
aware of - shopping
bags
Between
Groups
1.928 3 .643 1.075 .361
Within Groups 115.321 193 .598
Total 117.249 196
eco friendly practices
aware of - printing
multiple copies
Between
Groups
1.235 3 .412 .764 .515
Within Groups 104.013 193 .539
[image:24.612.70.544.40.471.2]Total 105.249 196
Table 17
Q12 by gender
Independent Samples Test
Levene's
Test for
Equality of
F Sig. t df
Sig.
(2-tailed) Mean
Difference
Std. Error
Difference 95%
Confidence
Interval of
the
Difference
Lower Upper
we evaluate
to reduce
negative
impact
Equal
variances
assumed
9.379 .003
-2.123
195 .035 -.255 .120 -.493 -.018
Equal
variances
not
assumed
-2.129
191.325 .035 -.255 .120 -.492 -.019
too costly Equal
variances
assumed
.943 .333 -.982 195 .327 -.117 .120 -.353 .118
Equal
variances
not
assumed
-.982 194.735 .328 -.117 .120 -.353 .119
concerned Equal
variances
assumed
1.998 .159
-3.598
195 .000 -.404 .112 -.625 -.182
Equal
variances
not
assumed
-3.609
responsible Equal
variances
assumed
.854 .357 -.287 195 .774 -.030 .106 -.239 .179
Equal
variances
not
assumed
-.287 194.628 .774 -.030 .106 -.239 .178
costly, but
necessary
Equal
variances
assumed
2.388 .124 -.743 195 .458 -.086 .115 -.313 .142
Equal
variances
not
assumed
-.745 191.211 .457 -.086 .115 -.313 .141
developing
countries -
sustainable
growth
Equal
variances
assumed
.094 .760 .811 195 .418 .072 .088 -.102 .246
Equal
variances
not
assumed
.812 194.888 .418 .072 .088 -.102 .245
save money Equal
variances
assumed
2.215 .138 .850 195 .397 .085 .100 -.113 .284
Equal
variances
not
assumed
educate
employees
Equal
variances
assumed
.010 .921 -.854 195 .394 -.076 .089 -.251 .099
Equal
variances
not
assumed
[image:27.612.73.544.346.701.2]-.854 194.890 .394 -.076 .089 -.251 .099
Table 18
Q12 by operational areas
ANOVA
Sum of
Squares df
Mean
Square F Sig.
we evaluate to reduce
negative impact
Between
Groups
1.554 3 .518 .712 .546
Within Groups 140.527 193 .728
Total 142.081 196
too costly Between
Groups
3.256 3 1.085 1.554 .202
Within Groups 134.795 193 .698
Total 138.051 196
concerned Between
Groups
1.496 3 .499 .756 .520
Within Groups 127.316 193 .660
responsible Between
Groups
3.651 3 1.217 2.253 .084
Within Groups 104.237 193 .540
Total 107.888 196
costly, but necessary Between
Groups
4.642 3 1.547 2.420 .067
Within Groups 123.409 193 .639
Total 128.051 196
developing countries -
sustainable growth
Between
Groups
3.045 3 1.015 2.724 .045
Within Groups 71.909 193 .373
Total 74.954 196
save money Between
Groups
3.982 3 1.327 2.746 .044
Within Groups 93.297 193 .483
[image:28.612.67.545.49.515.2]Total 97.279 196
Table 19
Q 13 by gender
Independent Samples Test
Levene's Test
for Equality
F Sig. t df Sig. (2-tailed) Mean Difference
Std. Error
Difference 95%
Confidence
Interval of
the Difference Lower Upper separation of waste Equal variances assumed
.007 .935
-1.417
195 .158 -.236 .167 -.565 .093
Equal variances not assumed -1.418
194.681 .158 -.236 .167 -.565 .092
switch off
computers
Equal
variances
assumed
4.551 .034
-2.292
195 .023 -.379 .165 -.705 -.053
Equal variances not assumed -2.289
192.523 .023 -.379 .165 -.705 -.052
eliminating
paper cups
and plates
Equal
variances
assumed
1.919 .168
-1.841
195 .067 -.306 .166 -.634 .022
Equal variances not assumed -1.840
eco friendly cleaning agents Equal variances assumed
3.124 .079
-1.933
195 .055 -.371 .192 -.749 .008
Equal variances not assumed -1.930
190.945 .055 -.371 .192 -.750 .008
encouraging
car pooling
among staff
Equal
variances
assumed
7.811 .006
-2.663
195 .008 -.482 .181 -.839 -.125
Equal variances not assumed -2.656
187.674 .009 -.482 .182 -.840 -.124
reduction of
printing
Equal
variances
assumed
.011 .917
-1.479
195 .141 -.281 .190 -.657 .094
Equal variances not assumed -1.479
194.843 .141 -.281 .190 -.657 .094
recycling of
partly used
paper
Equal
variances
assumed
2.063 .153
-1.943
195 .053 -.406 .209 -.818 .006
Equal variances not assumed -1.942
introduce an
eco friendly
prog for
staff
Equal
variances
assumed
1.226 .270
-2.016
195 .045 -.277 .137 -.548 -.006
Equal
variances
not
assumed
-2.015
193.644 .045 -.277 .138 -.549 -.006
Limitations of the Research:
1. Sample chosen has been restricted to management students and working managers. There
are other stake holders for an organization to be truly eco-friendly which cannot be
captured in a research of this size.
2. The size of the sample is quite small and skewed and therefore not truly representative of
the population.
3. This study should also be carried out over an extended period like a longitudinal study,
where a comparison can be made and a progressive analysis done.
Conclusions of the Research:
1. Women both among the student and in the organizations come out quite strongly as more
eco-friendly.
2. People who are in operations appear to be more eco-friendly, unlike in the other
disciplines.
3. By and large, the awareness among all groups seem to be slightly around the average and
Future Plans for the research:
Given that this was more in the nature of a pilot study, we propose to expand the research in
terms of regions across the country and over an extended period of time to check on the
evolution of eco-friendly practices in the country.
References
1. Alwitt, L.F., Pitts, R.E. (1996), “Predicting purchase intentions for an environmentally sensitive product”, Journal of Consumer Psychology, Vol.5 No.1, pp.49-64.
2. Diamantopoulos, A., Schlegelmilch, B., Sinkovics, R., Bohlen, G. (2003), "Can
socio-demographics still play a role in profiling green consumers? A review of the evidence
and an empirical investigation", Journal of Business Research, Vol. 56 No.6, pp.465-473.
3. Gronhoj, A., Olander, F. (2007), "A gender perspective on environmentally related
family consumption", Journal of Consumer Behaviour, Vol. 6 No.4, pp.216-228.
4. Hu, H.H., Parsa, H.G., Self, J. (2010), "The dynamics of green restaurant
patronage", Cornell Hospitality Quarterly, Vol. 51 No.3, pp.344-362.
5. Kaplan, S. (1991), "Beyond rationality: clarity-based decision making", in Garling, T.,
Evans, G. (Eds),Environment, Cognition and Action, Oxford University Press, New
York, NY, pp.171-190.
6. Newell, S.J., Green, C.L. (1997), "Racial differences in consumer environmental
concern", Journal of Consumer Affairs, Vol. 31 No.1, pp.53-69.
7. Peattie, K. (1995), Environmental Marketing Management: Meeting the Green
Challenge, Pitman, London, .
8. Roberts, J.A. (1996), "Green consumers in the 1990s: profile and implications for
advertising", Journal of Business Research, Vol. 36 No.3, pp.217-231.
9. Schubert, F., Kandampully, J., Solnet, D., Kralj, A. (2010), "Exploring consumer
perceptions of green restaurants in the US", Tourism and Hospitality Research, Vol. 10
10. Tzschentke, N., Kirk, D., Lynch, P.A. (2004), "Reasons for going green in serviced
accommodation establishments", International Journal of Contemporary Hospitality
Management, Vol. 16 No.2, pp.116-124.
11. Welford, R. (2000), Hijacking Environmentalism, Earthscan, London, .
12. Zimmer, M., Stafford, T., Stafford, M. (1994), "Green issues: dimensions of