International Research Journal of Marketing and Economics
Vol. 2, Issue 12, Dec 2015 IF- 2.988 ISSN: (2349-0314)© Associated Asia Research Foundation (AARF)
Website: www.aarf.asiaEmail : [email protected], [email protected]UTTARAKHAND STATE: AN ECONOMICAL PARADOX OF
POVERTY AMIDST SOCIO- ECONMIC INDICATORS OF
GROWTH AND DEVELOPMENT
1
Vivek Bahukhandi & 2O. P. Shukla
1
Research Scholar
Symbiosis School of Economics
Symbiosis International University, Pune.
2
Principal
National Defence Academy, Khadakwasla, Pune-26.
ABSTRACT
Uttarakhand state though provides very good picture in terms of Socio Economic indicators of
growth and development however paradox is that there lies utter poverty, abject equalities in
regional development and an ever increasing hill plain divide. The important feature of the
geographical distribution of population in state is its concentration in plains and valley areas
and this leads to the entire inequalities in regional development. Paper proposes
decentarlisation of power and governance to grass root level and strengthening of Panchayati
Raj institution to deliver social and economic justice to people.
Introduction
Uttarakhand, located in the north western part of India in Himalayan ranges between 280 -43’N
to 210- 27’N latitude and 770 - 34’ E to 810 - 02 E longitude is spread over an 53483 square
kilometers, of which about 46035 square kilometers (86 percent of the total areas) is hilly and
and southeast, Uttarakhand shares international boundaries with Tibet Autonomous Region of
China and Nepal respectively. In northwest its borders with another Himalayan state Himachal
Pradesh and in south and southwest by Uttar Pradesh. Carved out of Uttar Pradesh, on 9th
November 2000, the state is organized in two divisions Garhwal and Kumoan with 13 districts.
As per census 2011, Uttarakhand, has population of about 1.01 crore people. The average
density of population in the state is 189 persons per square kilometers. In terms of population
only Jammu and Kashmir (1.25 crore) is larger than Uttarakhand. In terms of population and
area, Uttarakhand is the second most populated and fourth largest among the 10 States in the
Himalayan region of the country. Only Jammu and Kashmir, Arunachal Pradesh and Himachal
Pradesh have larger area compared to Uttarakhand. (Appendix 1 Area and Population of
Himalayan States of India 2011). The district wise distribution of population of the Uttarakhand
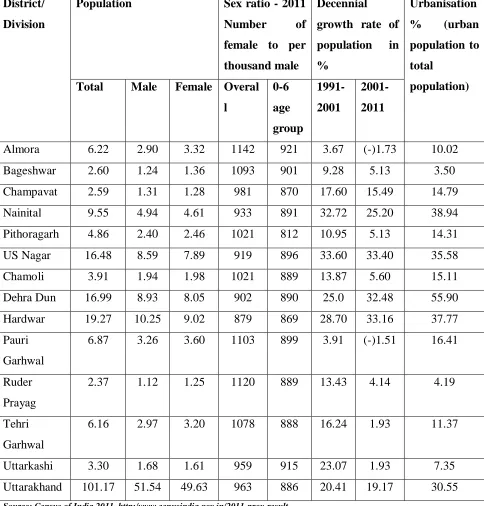
Table 1: Uttarakhand: Demographic Composition 2011
District/
Division
Population Sex ratio - 2011
Number of
female to per
thousand male
Decennial
growth rate of
population in
%
Urbanisation
% (urban
population to
total
population) Total Male Female Overal
l 0-6 age group 1991-2001 2001-2011
Almora 6.22 2.90 3.32 1142 921 3.67 (-)1.73 10.02
Bageshwar 2.60 1.24 1.36 1093 901 9.28 5.13 3.50
Champavat 2.59 1.31 1.28 981 870 17.60 15.49 14.79
Nainital 9.55 4.94 4.61 933 891 32.72 25.20 38.94
Pithoragarh 4.86 2.40 2.46 1021 812 10.95 5.13 14.31
US Nagar 16.48 8.59 7.89 919 896 33.60 33.40 35.58
Chamoli 3.91 1.94 1.98 1021 889 13.87 5.60 15.11
Dehra Dun 16.99 8.93 8.05 902 890 25.0 32.48 55.90
Hardwar 19.27 10.25 9.02 879 869 28.70 33.16 37.77
Pauri
Garhwal
6.87 3.26 3.60 1103 899 3.91 (-)1.51 16.41
Ruder
Prayag
2.37 1.12 1.25 1120 889 13.43 4.14 4.19
Tehri
Garhwal
6.16 2.97 3.20 1078 888 16.24 1.93 11.37
Uttarkashi 3.30 1.68 1.61 959 915 23.07 1.93 7.35
Uttarakhand 101.17 51.54 49.63 963 886 20.41 19.17 30.55
Source: Census of India 2011, http:/www.cenusindia.gov.in/2011-prov-result
The important attribute of the geographical distribution of population is its concentration in
plains and valley areas. Four districts, viz. - Dehra Dun, Haridwar and US Nagar, and southern
part of Nainital District have relatively flat topography, better infrastructure and high rate of
urbanisation .These four districts are the most populous district of the state and account for about
mountainous are small in population. The table 1 reveals that, as per census 2011, about seventy
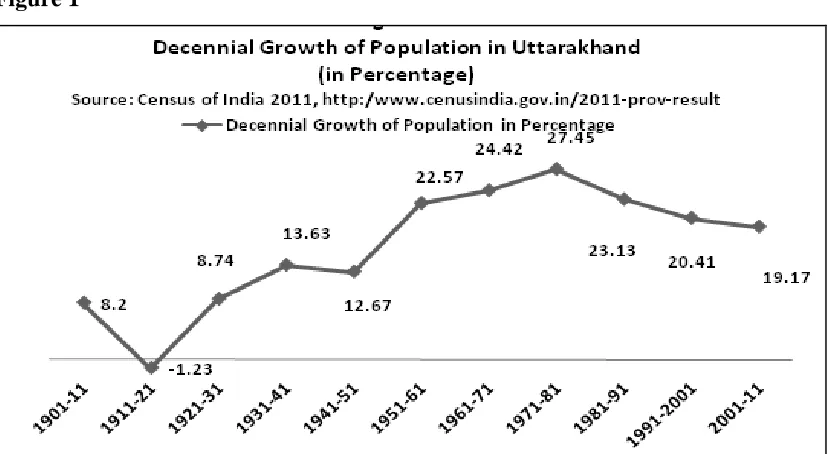
percent population of the state is rural, scattered in small mountainous villages. The decennial
growth of population in the state, as the following figure suggests, in the decade immediately
preceding independence registered sharp increase and thereafter grew with good rate reaching to
its peak in the decade 1971-81 and thereafter started decelerating. In the decade 2001-11 this
process has hasten further as population of two districts Almora and Pauri Garhwal, which
account for about 13 percent population of the states have declined in absolute terms by 1.51 and
1.73 percent respectively. In other mountainous districts too, growth rate of population has
decelerated substantially. However, in districts which are in plains or have substantial plain area
- the pattern of population growth is different. For example, in Dehra Dun and in Haridwar
districts population has increased at faster rate by 33 percent between year 2001-11. The Village
level data as per census -2011 are yet to be available, but as the per census of 2001 about 49.5
percent villages of the state are of a population size of up to 200 persons and 31.1 percent
villages population ranges between 201-500 person (Appendix 2). The population distribution,
will be further sparse as not only natural growth of population in mountains districts is declining
but large number of families are migrating from rural areas of mountains to urban areas and out
of the state (region) for livelihood opportunities (Bora R.S 1996). Also Sekhar (2007) found that
women’s participation in the rural economy is noteworthy. Migration even tends to be highly
gender-specific: in Uttarakhand it is the male population who leave their villages to engage in
off-farm activities while women remain behind to maintain domestic affairs .This spatial pattern
of population distribution, in absence of minimum population thresholds makes it difficult to
plan and provide social facilities optimally. Problem if elementary schooling is more intricate -
especially in rural areas - as population in the age group of 0-6 years, in villages is declining, and
this decline in Uttarakhand (9.68 percent) is glaringly large vis-à-vis national average. In some
Figure 1
Uttarakhand has sex ratio, 963 female to per thousand male, which is any time better than
national average (940) and many other states including the state of Uttar Pradesh (908) from
which it was carved and six Himalayan states. Study of the Table 1 reveals that there are
variations in the sex ratio across districts. In seven districts of the state, viz. Almora, Bageshwar,
Chamoli, Pauri Garhwal, Pithoragarh, Ruderprayag, Tehri Garhwal, which are primarily hill
districts females outnumber males. However, female outnumbering males, does not displays
women empowerment and gender equality but a paradox which reflects the state of women
because of heavy migration of male workers to plains and other parts of country for finding
sustainable source of livelihood. . Rashmi Gangwar (2007) points out aptly as to how due to high
migration rate of men in Hills women are left behind to make both their ends meet that also with
insufficient and infertile land In absence of employment opportunities. Domestic agriculture
production of peasant households in majority of the cases in the mountain state is hardly sufficed
to meet requirement and consequently, youth are forced to migrate to better pasture land and
engage in low remuneration jobs in formal and non formal sectors to sustain their families back
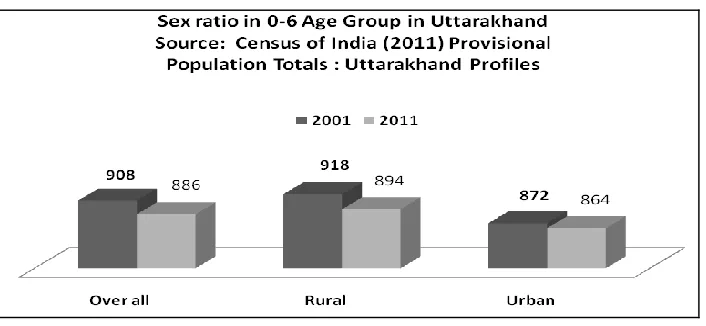
Figure 2
This proves considerably that female outnumbering male as proven by Government figures is
not an indicator of female empowerment. This fact is proved by the skewed and declining
gender ratio in 0-6 age group (Figure 2). The matter of worry is that juvenile sex ratio between
year 2001-11 has declined both in urban and rural areas in many districts. Experimental studies
have proved that this feature of the economy of the state is an outcome of the mismatch between
the resource utilisation, people need and development efforts (Bora R.S 1996) and has its roots
in the colonial rule (1815-1947). Among the seven Himalayan State, the economy of
Uttarakhand is largest in term of Gross State Domestic Product (GSDP). The GSDP (at 2004-05
price) of Uttarakhand in the year 2010-11 was about Rs.77,580/- cores which is about 1.06
percent of the GDP of India. The average annual growth rate of the state (Growth of GSDP at
constant price) has been reported about 9 percent from 1999-2000 to 2008-09, higher than the
corresponding figure of 7.2 percent for the nation. This implies that the state is growing at a rate
higher than national economy. It is pertinent to mention that in the year 1999-2000 the Per
Capita income in the state of Uttarakhand (at that time it was part of Uttar Pradesh) was
Rs.13516 (at the prices of 1999-2000) about 85.10 percent of the nation per capita income but
gradually this gap is narrowing down to the extent that in 2008-09 the per capita income of state
was Rs.36520, about 95.90 percent of the national per capita income. Given these trends it is
expected that the economy of the region will grow at a greater pace than the national economy
(Government of Uttarakhand, Directorate of Economics and Statistics - year not stated) and soon
this gap between the per capita national income and state per capita income will be bridged
(Government of India, Planning Commission 2009 p.75) However, it is noteworthy that that out
Tehri-Garhwal (16.1), US Nagar (11.8) and Nanital (9.1) accounts for about 73.8 percent of the total
Net State Domestic Product of the state. Economies of other districts are so small that none of
accounts for more than 6 percent of the Net State Domestic Product (Appendix 3). The economy
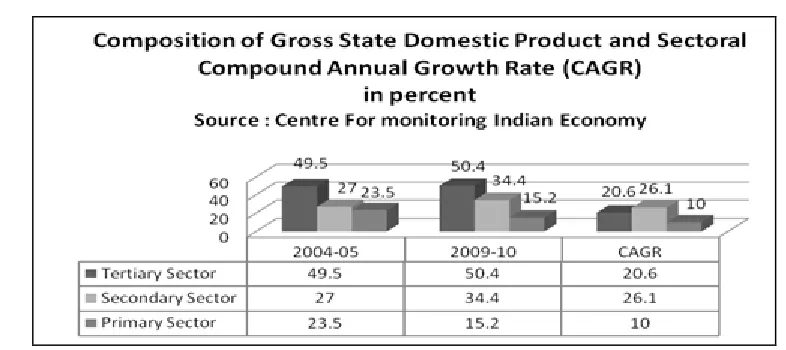
of the state is gradually transforming. As illustrated in (figure 3) the secondary sector activities
[image:7.612.92.485.173.348.2]are gaining impetus at greater pace.
Figure 3
However, the composition of secondary sector reveals construction activities - largely
government investment in road construction, constitute most of the output of the sector
Manufacturing industry which is supposed to be the most vibrant among all secondary activities,
registered a growth of 34.1 percent, from 2004-05 and 2009-10, is largely concentrated in the
plain and valley areas. The share of other than household industries in about one percent or less
than one percent in the Net Domestic Product of 9 districts viz., Almora (1.02 percent),
Bageshwar (0.32), Champavat (0.33), Pithoragarh (0.10) Chamoli (0.10), Dehra Dun (0.25)
Ruder Prayag (0.42), Tehri Garhwal (1.01) and Uttarkashi (0.39). All these districts are
predominantly mountainous districts. The tertiary sector – accounts for nearly fifty percent of the
state product. In this sector, Hotel and Restaurant services are growing faster than other (about
15.7 percent in the period 2004-05 to 2009-10). However, the economy is predominately rural
and most of the activities other than agriculture are concentrated in urban areas as apparent in the
Table 2. Primary sector too, which is basis of the people in rural areas, is also undergoing
changes with time. The matter of concern is that despite strong agriculture base, Uttarakhand is
an average state in terms of per capita agricultural production and yield per hectare, The
If the plain and valley districts are excluded from these data the condition will worsen further.
[image:8.612.65.541.139.287.2]This is because there have not been much improvement in agriculture.
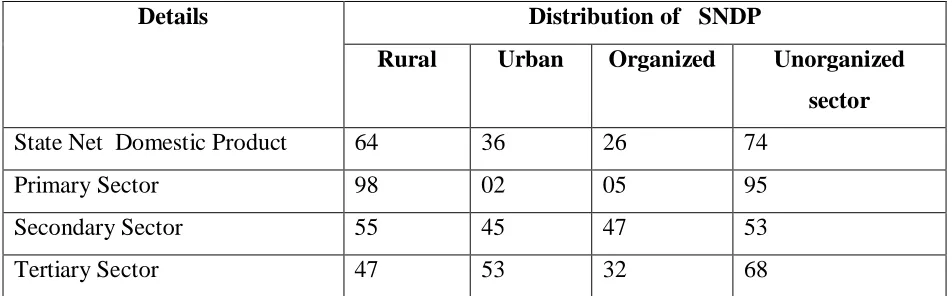
Table 2: Sector wise Spatial Distribution of State Net Domestic Product 2008-09
Details Distribution of SNDP
Rural Urban Organized Unorganized
sector
State Net Domestic Product 64 36 26 74
Primary Sector 98 02 05 95
Secondary Sector 55 45 47 53
Tertiary Sector 47 53 32 68
Source: Estimates of Domestic Product of Uttarakhand 1999-2000 to 2008-09 with base year 1999-000 Government of Uttarakhand Directorate of Statistics and Economics, Dehra Dun.
The agriculture sector faces many institutional and topographical constraints like 72 percent land
holdings are of less than one hectare Moreover, because of geographical constraints in absence
of any innovation makes irrigation, as challenging task and as a result most of the arable land in
the district is un-irrigated (only 44 percent of the total cultivated area is irrigated). The irrigated
area too with increase in altitudes tends to decline to the extent that in mountainous districts,
80-90 percent land is un-irrigated. Because of these constrains- despite a natural storehouse of
biodiversity, agriculture in the state is predominantly survival oriented as on average more than
80 percent cultivable area is under cereals.
The other prominent feature of the economic structure, as given in Table 2 is supremacy of
unorganised sector in every sector. These indicators could explain the paradox, of high incidence
of poverty amidst high growth rates. Given the fact that growth rate in the state is higher than
of national average and the gap between the national per capita income and state per capita
income is narrowing down at a good pace, it is expected that in Uttarakhand the proportion of
people living below poverty line will be not high. But the facts belie this expectation. At the
poverty line of Rs.478.02 per month in rural areas and Rs.637.67 in urban area, the percentage of
people living below poverty line in the state in the year 2004-05 was 40.80 percent in rural areas
average of state of UP (33.4 and 30.6) and Himachal Pradesh (10.7 and 3.7) of people living
below poverty line (Government of India, Planning Commission 2009 p 193). The extents of
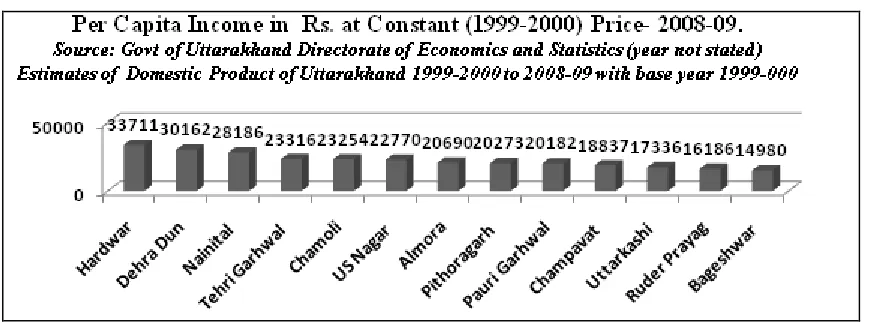
regional disparity is apparent from the following Figure 4 that districts Dehra Dun, Nainital,
Haridwar and US Nagar are either in plains or have substantial plain areas and have higher
income compared to other districts. The mountain districts have economies – in which
[image:9.612.71.512.196.357.2]agriculture is the main stay of the people and the next to it is employment in tertiary sector .
Figure 4
Bright Way Ahead
India being one of the oldest and strongest democracy with concept of welfare state enshrined in
constitution will be haunted by the evils of inequalities and exclusion on a mass scale.
Accordingly, the Government as enabler and driver may face challenges and inordinate delay
compounded with reduced efficiency in delivering basic social and economic services to the
citizens. This is because the bureaucratic administrative machinery, intertwined in procedural
bottleneck, finds it difficult to timely and appropriately respond to the specific needs and thus do
justice to different regions and communities. Therefore, in India since the adoption of
constitution, strong need has had always been felt to delegate powers to the grass root level
institutions, to ensure more public participation and encourage local commitment to provision of
basic key services like health, hygiene, sanitation etc . Therefore, to facilitate the decentralisation
of governance to grass root level, the historical 73rd and 74th constitutional amendments were
grass root level, towards delegation of powers of governance to commoners and nurturing sense
of accountability among stakeholders at local level. For the state of Uttarakhand these social
traditions along with people as most important assets undoubtedly provide very conducive
environment for delegating powers to grass root level institutions of governance. It is only by
strengthening grass root institutions like Panchayati Raj that Uttarakhand as a state can mitigate
socio economic evils which have eclipsed the state due to Hill- plain divide . The paradox of
poverty and retarded growth amidst indicators of socio economic growth can be arrested and
Appendix 1: Area and population of Himalayan State
Source: http:/www.censusindia.gov.in/ 2011-prov-result
State Area in
Square
kilometers
Population Sex
ratio
number
of
female
to per
thousan
d male
Density
of
populati
on
(Person
per km2)
Decrial
growth
rate of
population
Total Male Female
1. Arunachal Pradesh 83,743 13,82,611 720232 662379 920 17 25.92
2. Himachal Pradesh 55,673 68,56,590 3473892 3382617 974 124 23.71
3. Jammu & Kashmir 2,22,236 12548926 6665561 5883365 883 124 23.71
4. Manipur 22,327 2721756 1369764 1391992 987 122 18.65
5. Meghalaya 22,429 2964007 1492668 1471339 986 132 27.82
6. Mizoram 21,081 1091014 552339 538675 975 52 22.78
7. Nagaland 16,579 1980602 1025707 954895 931 119 - 0.47
8. Sikkim 7,096 607688 321661 286077 889 86 12.36
9. Tripura 10,492 3671032 1871867 1799165 961 350 14.75
10. Uttarakhand 53,566 1011675 5154178 4962574 963 189 19.17
Total Himalayan state 515,222 43980947 22,647,869 21,333,078 942 85 18.79
Appendix 2:Population size of the villages of Uttarakhand 2001
Figures in brackets denote percentage to total
Source: Government of Uttarakhand, Department of Planning: Statistical Diary 2007-08
Population Size Number of village Population Size Number of Town
Up to 200 7797
(49.5)
Up to 1000 3
(3.49)
201-500 4902
(31.1)
1001-2000 4
(4.65)
501-1000 1878
(11.9)
2001-5000 11
(12.79)
1001-2000 752
(4.8)
5001-1000 28
(32.56)
2001-5000 350
(2.2)
10001-20000 16
(18.60)
5000 and above 82
(0.5)
20001-50000 16
(18.60)
Total 15761
(100)
50001-100000 5
(5.81)
Above 100000 3(3.49)
Appendix 3: Net District Domestic Products at Constant (1999-2000) Prices (in Rs. Lakh)
Source: Govt of Uttarakhand Directorate of Economics and Statistics Estimates of Domestic Product of Uttarakhand 1999-2000 to 2008-09 with base year 1999-000, Dehra Dun http://des.uk.gov.in/files/books/b8_9.pdf Retrieved on 24th Jan, 2012
District Primary Sector Secondary Sector Tertiary Sector District Net
Domestic product
(NDDP)
Rs. Percent
to
NDDP
Rs. Percent
to
NDDP
Rs. Percent
to
NDDP
Rs. Percent
to total
Uttarak
hand
Almora 43915 29.8 39792 27.0 63778.0 43.2 147485.0 5.5
Bageshwar 9196 21.8 14529 34.4 18519 43.8 42244 1.6
Champavat 16091 33.7 12468 26.1 19257 40.3 47816 1.8
Nainital 47490 19.5 66296 27.3 129303 53.2 243089 9.1
Pithoragarh 24540 23.2 34425 32.5 46984 44.3 105949 3.9
US Nagar 79283 24.9 88479 27.8 150301 47.3 318063 11.8
Chamoli 22466 23.1 37739 38.8 37154 38.2 97359 3.6
Dehra Dun 33320 7.6 126085 28.8 277774 63.5 437179 16.3
Hardwar 74941 13.6 268194 48.6 208380 37.8 551515 20.5
Pauri Garhwal 26795 16.8 53825 33.8 78484 49.3 159104 5.9
Ruder Prayag 8275 19.1 14702 34.0 20284 46.9 43261 1.6
Tehri Garhwal 304224 70.2 66102 15.3 62877 14.5 433203 16.1
Uttarkashi 18597 32.0 15183 26.1 24307 41.8 58087 2.2
Uttrakhnad
(total)
REFRENCES
Bora R.S. (1996) “Himalayan Migration: A study of Hill region of Uttar Pradesh”, New Delhi, Sage
Census of India (1951) “Census Hand Book District Tehri-Garhwal”, Allahabad, Government press
Census of India (2011) http://censusindia.gov.in/2011-prov-results/data_files/indi _chapter6.pdf. Retrieved on 3rd December, 2011
Census of India (2011) http://www.imaginmor.com/census-of-india Retrieved on 27th August, 2011.
Gangwar, R(2007). Empowering Self-Help Groups to Address Gender Inequity Center for Environment Education- Himalaya, Lucknow,
Government of Uttarakhand Directorate of Statistics and Economics (year not stated (a) Estimates of Domestic Product of Uttarakhand 1999-2000 to 2005-06 with Government of Uttarkhand, Planning Department, Directorate of Economics and Statistics. GSDP at Current Prices 1999-2000, 2008-09. http://des.uk.gov.in/pages/display/112-estimate Retrieved on 30th January, 2012