5
II
February 2017
www.ijraset.com Volume 5 Issue II, February 2017 IC Value: 45.98 ISSN: 2321-9653
International Journal for Research in Applied Science & Engineering
Technology (IJRASET)
Data Mining in Higher Education Sector
Peeyush Vyas
Asst. Professor, CE/IT Department of Vadodara Institute of Engineering, Vadodara
Abstract: Data mining is the process of extracting hidden and useful information from a huge amount of data. It analyzes the data from different sources and convert them into significant information. Today, there is a big challenge for the institutions for predicting the career path related to higher education of the students. So, it would be a big task for the institutions to find the students who will be suitable for a particular course according to their expertise & area of interests and to find the students who will need more guidance and counselling in a specific area. Management of institution also need to have more information related to the results of the students, their success rate in the new courses offered etc. Here, the problem faced by students and higher education institutions for higher education will be discussed. So, ‘Data Mining’ is to solve all these types of problems. It is a better tools to analyze & predict result of the students and helps to institutions in the decision making more smartly and accurately. In this paper, there is a small try to make use of one of the data mining techniques-J48 algorithm to predict the result of the students along with Data Mining tool ‘Weka’ which will be used for the classification of the data.
Keywords : Knowledge Discovery, Higher Education, Classification, J48 Algorithm, Weka.
I. INTRODUCTION
The overall goal of the data mining technique is to extract hidden information from a large data set and transform it into an understandable structure for further use. For the institutions or universities, Data Mining tools can predict future trend to make knowledge-driven decisions. So, these tools can save the time and can answer any kind of query in the less time as compare to the traditional procedures, helping in the decision support systems. The amazing predictive information and hidden patterns pertaining to academics can be found using Data mining tools. Using these tools, institution can predict with more accuracy that which student will be more suitable for a particular higher course or who will become graduate. This way, institution or university can use this information to pay more attention towards the weak students as well. To understand the concept of Data Mining let us first know some of the fundamental concept- Classification:
Classification is a data mining (machine learning) technique used to predict group membership for data instances. It identifies associations and clusters and separates subjects under study. Popular classification techniques include decision trees and neural
networks. Classification models predict categorical class labels; and prediction models predict continuous valued functions. It is a
supervised technique where we will design our model.\ Categorization
Categorization uses rule induction algorithms to handle categorical results, like “Persist” or “Dropout,” and “Transfer” or “Stay.” Estimation
Estimation includes predictive functions and deals with continuous outcome variables, such as GPA and salary level. Visualization
Visualization uses interactive graphs to show mathematically induced rules and scores. These graphs are more refined than any traditional bar chart or a pie chart. To show 3D geographic locations of mathematical coordinates, visualization is the bes technique.
So, higher education institutions can make use of classification for a comprehensive analysis of student characteristics, or use estimation to predict the likelihood of a variety of outcomes, such as transferability, persistence, retention, and course success. Other than these, various Data Mining tools and algorithms can be as follows –
Machine Learning
Computer Science, heuristics and Induction algorithm Neural Networks Artificial Intelligence etc.
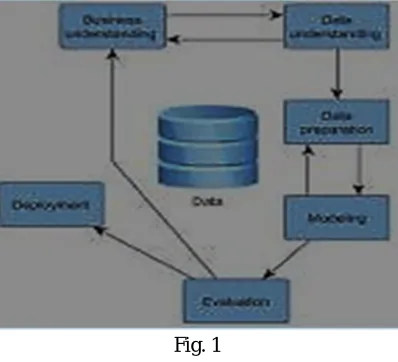
Biological models, psychology and engineering Phases of Data Mining
Fig. 1
A data mining mission begins with the understanding of the problem. Specialists of data mining, business experts, and domain experts work together to describe the project goals and also they find out the requirements from the business point of view. The various phases can be explained as below –
Problem DefinitionIn this project, our area or domain is data related to the field of academic such as records of students, results of the college, strength of the students year wise or department wise etc. The specialist members or experts can be considered as heads of the departments and principal of the college.
Data ExplorationIn this phase, data are explored using the conventional tools like statistics.
Data Preparationthis phase allows to squeeze data many times. The main aim is simply to prepare data for modeling tool while selecting various databases, tuples and attributes without altering the basic meaning of the original data. If require, different types of mining functions can also be used.
Modelinghere, domain experts make some interaction with the data preparation phase to evaluate the model. If the proposed model does not meet the requirements and expectations and model is rebuilt while changing the suitable considerations until the desired model is made. We, finally, deploy the model, when we are satisfied.
A. Data collection & analysis tools
The following are the various types of tools required to perform the various tasks of the project like analyzing data, designing data, data implementation, developing software etc.
Weka Data Mining Tools, Tanagra Data Mining Tool, Web Miner, Ms-Access, MySql, SPSS etc.
B. Data mining experiment
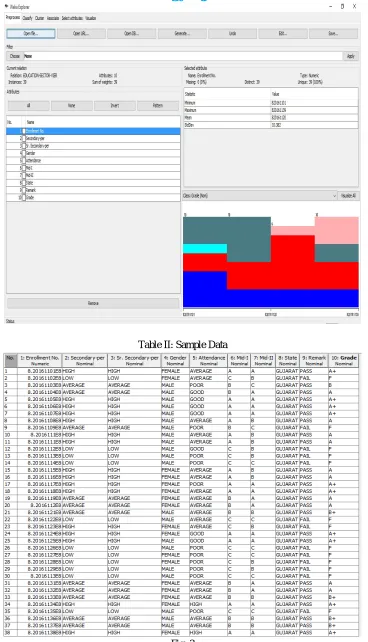
Herein, some data is collected from one of the best colleges of Baroda for the research work. First of all, data are cleaned and integrated. The following table shows the various attributes with their respective values taken for the problem.
Table I: Selected Attributes S.No. Attribute Description
1 Secondary_per Low, Average, High 2 Sen_Sec_per Low, Average, High
3 Gender Male, Female
4 Attendance Below, Good, Average
5 MidTerm1 A,B,C,D,F
6 MidTerm2 A,B,C,D,F
7 State Gujarat, Rajasthan, Other
8 Result Fail, R, Pass Low, Pass Average, Pass High
[image:3.612.126.492.574.717.2]www.ijraset.com Volume 5 Issue II, February 2017 IC Value: 45.98 ISSN: 2321-9653
[image:4.612.118.486.75.717.2]International Journal for Research in Applied Science & Engineering
Technology (IJRASET)
[image:4.612.121.481.411.714.2]Table II: Sample Data
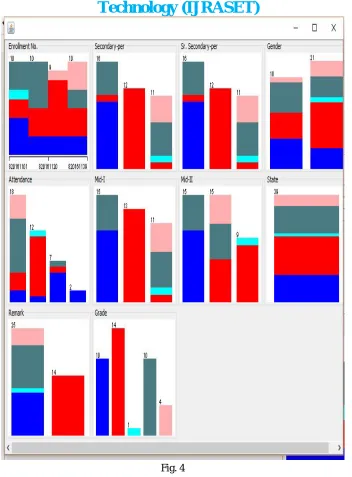
Fig. 4
Once data are integrated and cleaned, they are classified using data mining tool ‘Weka’. For classification and predication J48 algorithm is used which is based on C4.5 algorithm from the machine learning. J48 algorithm is widely used algorithm of the Weka tool. It provides great strength between accuracy, speed and predictions of the results. It uses decision tree and using decision tree we can easily identify those students who are likely to be failed or we can predict the weak or brilliant students. On the basis of the current profile of the students, classification process can also be used to predict the chances of success or failure to pass the academic exams based on their profile. With the help of the decision tree we can easily find out those students who have maximum chances of failure or we can identify the weak students. With the help of this type of conclusion we can work hard on those students so that their performance and results can be improved. So, we can quote answers to the following questions with the help of data mining –
What are the interesting subjects of the students?
Who is the weak student How to improve result of the college? Predicting the results?
www.ijraset.com Volume 5 Issue II, February 2017 IC Value: 45.98 ISSN: 2321-9653
International Journal for Research in Applied Science & Engineering
Technology (IJRASET)
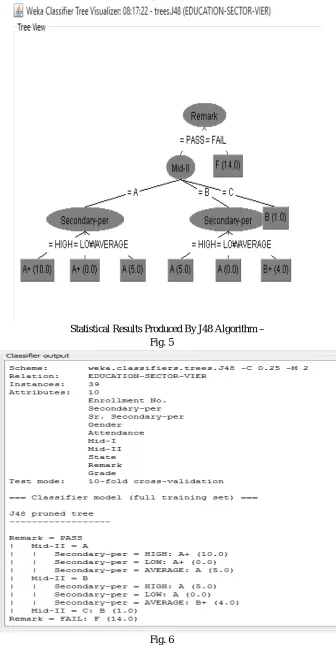
[image:6.612.139.475.76.722.2]Statistical Results Produced By J48 Algorithm – Fig. 5
II. CONCLUSION
www.ijraset.com Volume 5 Issue II, February 2017 IC Value: 45.98 ISSN: 2321-9653
International Journal for Research in Applied Science & Engineering
Technology (IJRASET)
REFERENCES
[1] Hideko Kitahama, “Data Mining through Cluster Analysis Evaluation on Internationalization of Universities in Japan”.
[2] Bruce L. Golden R. H. Smith School of Business University of Maryland College Park, MD 20742 “An Example of Visualization in Data Mining”
[3] Jing Luan, PhD Chief Planning and Research Officer, Cabrillo College Founder, Knowledge Discovery Laboratories “Data Mining Applications in Higher Education”
[4] Thulasi [email protected], University of Northern Iowa “ Theoretical Basis for Data Mining Approach to Higher Education Research”.
[5] N.V.Anand Kumar Research Scholar, Department of Computer Science and engineering Anna university, Chennai G.V.Uma Assistant professor, Department of Computer Science and Engineering Anna university, Chennai “Improving Academic Performance of Students by Applying Data Mining Technique”. [6] Brijesh Kumar Bhardwaj, Saurabh Pal “Data Mining: A prediction for performance improvement using classification” (IJCSIS) International Journal of
Computer Science and Information Security, Vol. 9, No. 4, April 201
[7] S. Anupama Kumar and M. N. Vijayalakshmi “RELEVANCE OF DATA MINING TECHNIQUES IN EDIFICATION SECTOR” International Journal of Machine Learning and Computing, Vol. 3, No. 1, February 2013
[8] Mrs. Bharati M. Ramageri “DATA MINING TECHNIQUES AND APPLICATIONS” Indian Journal of Computer Science and Engineering Vol. 1 No. 4 301-305.
[9] Ramageri, M. Bharti “Data Mining Techniques and App lications.” Indian Journal of Computer sciences and Engineering, Vol.1 No.4, (Dec-Jan 2010- 2011): 301-305.