R E S E A R C H
Open Access
Genome-wide nucleotide patterns and
potential mechanisms of genome
divergence following domestication in
maize and soybean
Jinyu Wang
1, Xianran Li
1*, Kyung Do Kim
2, Michael J. Scanlon
3, Scott A. Jackson
2, Nathan M. Springer
4and Jianming Yu
1*Abstract
Background:Plant domestication provides a unique model to study genome evolution. Many studies have been
conducted to examine genes, genetic diversity, genome structure, and epigenome changes associated with domestication. Interestingly, domesticated accessions have significantly higher [A] and [T] values across genome-wide polymorphic sites than accessions sampled from the corresponding progenitor species. However, the relative contributions of different genomic regions to this genome divergence pattern and underlying mechanisms have not been well characterized.
Results:Here, we investigate the genome-wide base-composition patterns by analyzing millions of SNPs segregating among 100 accessions from a teosinte-maize comparison set and among 302 accessions from a wild-domesticated soybean comparison set. We show that non-genic part of the genome has a greater contribution than genic SNPs to the [AT]-increase observed between wild and domesticated accessions in maize and soybean. The separation between wild and domesticated accessions in [AT] values is significantly enlarged in non-genic and pericentromeric regions. Motif frequency and sequence context analyses show the motifs (PyCG) related to solar-UV signature are enriched in these regions, particularly when they are methylated. Additional analysis using population-private SNPs also implicates the role of these motifs in relatively recent mutations. With base-composition across polymorphic sites as a genome phenotype, genome scans identify a set of putative candidate genes involved in UV damage repair pathways. Conclusions:The [AT]-increase is more pronounced in genomic regions that are non-genic, pericentromeric, transposable elements; methylated; and with low recombination. Our findings establish important links among UV radiation, mutation, DNA repair, methylation, and genome evolution.
Keywords:Evolution, Domestication, Base composition, Genome divergence, Solar UV, Mutation, Methylation, UV damage repair
© The Author(s). 2019Open AccessThis article is distributed under the terms of the Creative Commons Attribution 4.0 International License (http://creativecommons.org/licenses/by/4.0/), which permits unrestricted use, distribution, and reproduction in any medium, provided you give appropriate credit to the original author(s) and the source, provide a link to the Creative Commons license, and indicate if changes were made. The Creative Commons Public Domain Dedication waiver (http://creativecommons.org/publicdomain/zero/1.0/) applies to the data made available in this article, unless otherwise stated.
* Correspondence:lixr@iastate.edu;jmyu@iastate.edu
1Department of Agronomy, Iowa State University, Ames, IA 50011, USA
Background
Domestication is a special mode of evolution. Extensive studies have been carried out to understand the domes-tication process and genes associated with morpho-logical changes [1–4]. Meanwhile, genomes also went through profound changes during domestication. Recent studies documented the base-composition difference and mutation rate difference between populations separated by either domestication or demographic bottleneck event, which provide novel insights on genome evolution [5–7]. Further investigation in DNA base composition, mutation spectrum, and the potential relationship be-tween them is necessary to advance our understanding of genome changes.
DNA base composition is an essential genomic feature. Remarkable research progress has been made in several areas, including codon usage bias [8], isochore structure [9,10], and GC-biased gene conversion [11]. Recently, a conserved base-composition pattern, modern accessions having significantly higher [A] and [T] values across genome-wide polymorphic sites than accessions sampled from their wild relatives, was discovered with natural populations across multiple species [5]. Different gen-omic regions exhibit different patterns of a number of genomic features such as DNA methylation, GC content, and recombination rate [12–15]. It would be interesting to study the regional variation of genome change pat-tern, captured by base composition summarized from polymorphic sites.
Mutation is a fundamental factor that generates the genetic variation upon which selection, drift, and recom-bination act. Point mutations are the most common type of mutations with a universal bias toward high AT, pri-marily due to the high rate of transition mutations [16]. Recent studies indicated that mutation rate can be dif-ferent across populations [6, 7]. Divergence in mutation rates or types between populations are one of several factors that affect genetic variation patterns [17]. Ana-lysis of data from multiple mutation accumulation ex-periments, either accumulating spontaneous or induced mutations, demonstrated higher [AT] values across mu-tation sites in derived lines at the end of mumu-tation exper-iments than in ancestral lines, which suggested that base-composition difference can emerge from mutation sites [5]. Characterization of mutation spectrum in nat-ural populations may help unravel the mechanism of genome change [18].
Organisms have evolved a complex system to monitor and repair DNA damage caused by various exogenous mutagens, such as solar-ultraviolet (UV) radiation, react-ive oxygen species, excess boron or aluminum, and patho-genic microorganisms [19]. For plants, solar-UV radiation is a major exogenous mutagen as they use sunlight for photosynthesis. The primary solar UV-induced DNA
lesion, cyclobutane pyrimidine dimers (CPDs), induces C→T base transitions [20]. CPDs distort the DNA’s double-helix structure, which influences DNA unwinding and DNA replication, and ultimately affect cell cycle [21]. Using sets of SNPs private to different human popula-tions, a recent study suggested that UV might have been involved in the mutation spectrum change [6].
DNA methylation is a major form of epigenetic modifi-cation in many eukaryotic genomes. It not only regulates gene expression and silences transposons and repeat se-quences, but also affects mutation rates [22–25]. DNA methylation occurs in CG, CHG (where H = A, C, or T), and CHH sequence contexts in plants [26,27]. The rela-tive frequency of DNA methylation varies substantially along chromosome. DNA methylation is primarily distrib-uted in the heterochromatin regions that are mostly com-posed of tandem repeats and transposons [12,13, 28]. It has been shown that methylation of cytosine residue at CpG sites can enhance the solar UV-promoted CPD for-mation [25]. We can ask whether the rate of solar UV-induced mutations varies along the chromosome and whether base composition can summarize such variation.
In this study, we report findings from the analysis of millions of SNPs segregating among 100 accessions from a teosinte-maize comparison set and among 302 acces-sions from a wild-domesticated soybean comparison set. First, we show that higher [AT] values in domesticated accessions relative to wild accessions, or [AT]-increase, are consistently observed for SNPs found in either genic or non-genic portions of the genome, with non-genic SNPs having a greater contribution to the [AT]-increase. Interestingly, we also find that the divergence in [AT] is much higher in pericentromeric regions than in other regions. All 4 sequence motifs related to solar-UV signa-ture consistently have higher frequencies in methylated regions than unmethylated regions. With a different set of population-private SNPs, we also discover the enrich-ment of mutations related to the solar-UV signature in domesticated accessions. Using base-composition across polymorphic sites as the phenotype, genome-wide scans identify a set of putative candidate genes involved in UV damage repair pathways. Together, these findings seem to suggest that solar-UV radiation and differential muta-tion repair are critical components in the genome diver-gence process that resulted in domesticated accessions’ greater numbers of nucleotides A and T.
Results
Genome-wide [AT]-increase
We obtained a set of 8,852,678 SNPs in 100 teosinte-maize accessions and a set of 4,870,265 SNPs in 302 wild-domesticated soybean accessions from the ori-ginal studies [29,30] (Additional file1: Figure S1). These SNPs are designated as common SNP sets to compute
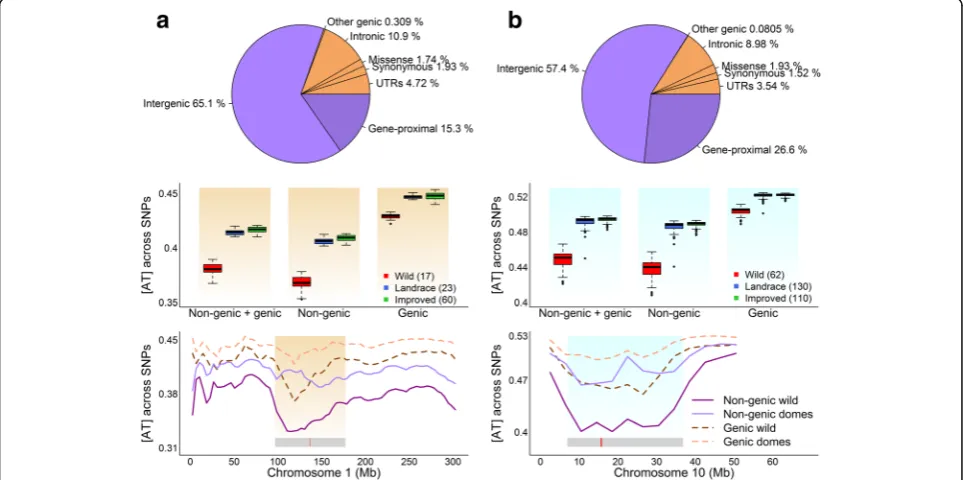
the genome-wide base-composition across polymorphic sites without concerning about sampling issues due to low minor allele frequency (MAF) or high missing rate [5]. For each accession, we obtained an [AT] value calcu-lated as the fraction of SNP alleles that are either base A or T. The choice of [AT] was based on the finding that single-strand parity rule 2 (PR2) applies to base compos-ition across SNPs [5], i.e., [A]≈[T] and [G]≈[C]. In both maize and soybean sets, wild and domesticated (in-cluding landraces and improved cultivars) accessions are clearly separated by [AT] (P value is 1.49e−14 for maize and 1.02e−44for soybean). Domesticated accessions have more nucleotides A and T at the polymorphic sites (Fig. 1), termed as [AT]-increase (domesticated > wild accessions). In maize, the average value of [AT] in wild accessions is 0.380 (SD = 0.006), while the average values of [AT] in landraces and improved cultivars are 0.414 (SD = 0.003) and 0.417 (SD = 0.003), respectively. In soy-bean, the average value of [AT] in wild accessions is 0.449 (SD = 0.010), while the average values of [AT] in landraces and improved cultivars are 0.492 (SD = 0.006) and 0.494 (SD = 0.003), respectively.
Base composition among DNA substitution types
Bi-allelic SNPs can be grouped into six substitution types without defining the ancestral allele. To further under-stand the consistent [AT]-increase pattern, we examined the contribution to [AT]-increase from each substitution type (Additional file 1: Figure S2). Two transition types, A/G and C/T, are the major types detected in maize and soybean genomes, with each having a frequency of ~ 34%, much higher than the expected frequency by chance (i.e., ~ 17% or 1/6). The average frequency for each of four transversion types (A/C, A/T, C/G, and G/T) is less than 10%, with C/G type being the least frequent one.
We then calculated the base-composition value across polymorphic sites conditional on each substitution type. The contribution to the overall [AT]-increase varied among substitution types (Fig. 2). Two transition types (A/G and C/T) are the major contributors due to their high frequencies and that the majority of wild accessions possess G or C allele for these types, while the domesti-cated typically have A or T. For A/C and G/T types, sig-nificant base-composition differences between wild and domesticated groups are also evident, and the propor-tional increase in A or T is similar to that of A/G and C/T types. However, because of their relatively low fre-quencies (≤9%), these two types contribute less to the overall [AT]-increase. Neither A/T nor C/G type con-tributes to the overall [AT]-increase.
Base-composition pattern at different genomic regions It is known that different genomic regions exhibit different patterns for a number of genomic features including DNA methylation, GC content, and recombination rate [12–15], which naturally led us to investigate the base-composition distribution at different parts of the genome. To facilitate this, we first classified the genome-wide SNPs to 7 gen-omic annotation sets: intergenic, gene-proximal, UTRs, synonymous, missense, intronic, and other genic [31, 32] (Fig. 3). Intergenic SNPs are the most common group (65.1% in maize and 57.4% in soybean), followed by gene-proximal (15.3% in maize and 26.6% in soybean) and intronic (10.9% in maize and 8.98% in soybean). Because the numbers of SNPs were relatively too small in several genomic annotation sets, we combined intergenic and gene-proximal sets to form the non-genic SNP set and combined the rest five original genomic annotation sets to form the genic SNP set. The non-genic set contains 7,120,981 SNPs in maize and 4,088,443 SNPs in soybean,
Fig. 1Genome-wide base-composition pattern in maize and soybean.aThe distribution of [AT] among 8.9 million SNPs in 100 maize accessions.
[image:3.595.61.538.524.703.2]and the genic set contains 1,731,687 SNPs in maize and 781,822 SNPs in soybean.
We calculated the [AT] value for each accession from genic and non-genic SNP sets separately. [AT] of domesti-cated accessions is consistently higher than that of wild ac-cessions in both genic and non-genic SNPs (Fig. 3).
However, non-genic SNPs have greater contributions to the [AT]-increase, and the [AT]-difference between wild and domesticated accessions is about twice that of genic SNPs. Since the total number of non-genic SNPs are 4 to 5.5 times larger than genic SNPs, we randomly sampled an equal number of SNPs from genic and non-genic SNP sets
Fig. 2Base-composition distribution at each of the six substitution types in maize (a) and soybean (b). The genome-wide SNPs were classified into six substitution types. Base composition was calculated for each accession conditional on each substitution type. The red arrows show the [A] and [T] increase at A/G and C/T substitution types
Fig. 3The distribution of base composition calculated with genic and non-genic SNPs in maize (a) and soybean (b). The upper panel shows the distribution of SNPs across different genomic annotation sets. The middle panel shows the base-composition distribution with genic and non-genic SNPs. The lower panel illustrates the base-composition distribution across 5 Mb segments with non-genic and non-non-genic SNPs. To simplify the plot in the lower panel, landraces and improved cultivars are combined to be the domesticated group to compare with the wild group. For each accession, base composition was calculated using a moving average approach with a 5-Mb window size and a 4-Mb step size. Each point in the plot represents the mean [AT] of the specified group across a 5-Mb window. The gray bar in the bottom indicates the position of the
pericentromeric region, and the red bar within the gray bar shows the position of the centromeric region
[image:4.595.59.539.88.269.2] [image:4.595.57.539.413.653.2]to obtain the [AT] value for comparison. We obtained a consistent trend from 100 subsets, demonstrating that the greater contribution to the overall [AT]-increase from non-genic SNPs is not only because of its larger SNP num-ber but also due to its higher proportional increase in [AT] than genic SNPs (Additional file1: Figure S3). As expected, further comparisons of [AT] distribution between missense, synonymous, and intergenic SNP sets (Additional file 1: Figure S4A-B) show that while [AT]-difference between wild and domesticated accessions from missense and syn-onymous SNP sets are similar to each other, both of them are smaller than intergenic SNP set. We also evaluated the impact of allele frequency on the different contributions from genic and non-genic SNPs. Compared with non-genic SNP set, genic SNP set generally has more SNPs with high MAF and fewer SNPs with low MAF (Additional file1: Fig-ure S5), which may suggest that the genic region is more conserved than the non-genic regions.
Both species are known to have low gene density in pericentromeric regions [29,33,34], so we examined the [AT] distribution with genic and non-genic SNPs along chromosomes (Fig. 3, Additional file 1: Figures S6-S8). Along each chromosome, (a) higher [AT] in domesti-cated group than wild group is consistently observed for both genic and non-genic SNPs; (b) [AT]-difference be-tween domesticated and wild group for non-genic SNPs is generally larger than that for genic SNPs; and (c) [AT] for each accession is higher for genic SNPs than for non-genic SNPs. More interestingly, the divergence in [AT] is significantly enlarged in the pericentromeric re-gions, especially for non-genic SNPs.
Because of the dramatic difference of [AT] distribu-tions between pericentromeric regions and chromosome arms, we further compared the [AT] distribution be-tween genic and non-genic regions conditional on the pericentromeric regions and chromosome arms separ-ately (Additional file 1: Figure S4C-F). The [AT]-differ-ence between wild and domesticated accessions at the non-genic region is consistently about twice that of the genic regions for both pericentromeric regions and chromosomal arms. And the [AT]-difference between wild and domesticated accessions at the pericentromeric region is much larger than that of chromosome arms, which is true for both non-genic and genic SNPs.
We speculate the enlarged [AT]-difference in the pericen-tromeric regions is associated with the fact that these regions mainly consist of repetitive sequences and transposable ele-ments [33–36] that are mostly arranged in heterochromatin [37] and generally have low recombination rates [30,33,34,
38]. To verify the speculation, we first examined the distribu-tion of base composidistribu-tion at transposable element (TE) and non-transposable element (non-TE) regions. The [AT]-differ-ences at TE regions are much larger than non-TE regions (Additional file 1: Figure S9). We then plotted the
[AT]-difference and crossover rate for maize and recombin-ation rate for soybean along each chromosome (Add-itional file1: Figures S10-S12). Negative correlations between [AT]-difference and crossover/recombination rate are signifi-cant for all 10 maize chromosomes and 18 soybean chromo-somes. We observed relatively low and fluctuating MAF within the pericentromeric regions (Additional file1: Figures S13-S15), which may be related to the low efficiencies in pur-ging out deleterious alleles [39].
As the phenotypic differences between the wild and do-mesticated accessions mainly shaped by the artificial selec-tion, we then compared the base-composition distribution at domestication selective sweep and non-selective sweep regions to test if the domestication process was partially responsible for the detected base-composition difference. The [AT]-difference between wild and domesticated ac-cessions at selective sweep regions is much larger than that at non-selective sweep regions (Additional file1: Fig-ure S16). This suggests that the domestication process in-deed have an effect on the detected base-composition difference at the polymorphic sites.
Enrichment of motifs related to solar-UV signature surrounding SNP sites
To test whether SNPs occurred more frequently in certain sequence contexts, we first classified SNPs into 96 tri-nucleotide motifs by considering 1 base directly adjacent upstream and downstream of the SNP site. Then, we exam-ined the frequency and the enrichment of tri-nucleotide motifs. With 96 possible motifs, the expected frequency is 0.010 (≈1/96) and a ratio of 1.000 between the frequency of motif at SNP sites and that at random sites if SNPs oc-curred randomly in the genome. We detected 14 common motifs between maize and soybean with both frequencies and ratios greater than the expected, and 11 out of 14 were from A/G and C/T transition types (Fig.4). In both species, 5′-CNG-3′ (N is the polymorphic site) around C/T type has the highest ratio with 2.007 in maize and 2.228 in soy-bean. In addition, 5′-TNG-3′is enriched around C/T type, with a ratio of 1.477 in maize and 1.311 in soybean. Because most wild accessions have C allele at C/T type (Fig. 2), these SNPs were more likely changed from 5′-PyCG-3′to 5′-PyTG-3′, where Py is either pyrimidine C or T. Corres-pondingly, the reverse and complementary motifs 5′-CNG-3′and 5′-CNA-3′around A/G type are also over-represented, which suggests the high chance of 5′-CGPu-3′ to 5′-CAPu-3′mutations, where Pu is purine G or A.
motifs related to solar-UV signature. In both species, mCG level is negatively correlated with gene density and enriched in the pericentromeric regions [12, 13, 28,41], which sug-gests that motifs related to solar-UV signature might occur more frequently outside of the genic regions and be overrep-resented in the pericentromeric regions. To test this, we per-formed two sets of comparisons: frequencies of motifs related to solar-UV signature between genic and non-genic SNPs, and between SNPs from pericentromeric and non-pericentromeric regions. As expected, all four motifs re-lated to solar-UV signature have higher frequencies within non-genic SNP sets than genic SNP sets, and they have higher frequencies among SNPs from pericentromeric re-gions than among SNPs from non-pericentromeric rere-gions (Additional file1: Figures S17-S18).
We then examined the role of DNA methylation by cal-culating the frequencies of motifs related to solar-UV
signature conditional on methylated and unmethylated re-gions [42–44]. We found that all four motifs related to solar-UV signature consistently have higher frequencies in methylated regions than in unmethylated regions with genic SNPs, non-genic SNPs, SNPs from pericentromeric regions, and SNPs from non-pericentromeric regions (Add-itional file 1: Figures S17-S18). This suggests the higher probability of C→T and G→A transitions, potentially stim-ulated by DNA methylation, in non-genic regions and peri-centromeric regions, which agrees with our findings of non-genic SNPs’ larger contributions to [AT]-difference and the enlarged [AT]-difference in pericentromeric regions.
Mutation spectra of population-private variation
The findings of sequence motifs related to solar-UV sig-nature enriched in common SNP sets encourage us to
Fig. 4Motif enrichment analysis in maize and soybean. The upper panel illustrates the composition of tri-nucleotide motifs and the induction of motifs related to solar-UV signature on double strand DNA. Each tri-nucleotide motif is formed by incorporating reference base pairs immediately upstream and downstream to the middle SNP site. Ninety-six motifs are divided into 6 classes based on the substitution types of the SNP. The lightning sign shows the mutation site, and the purple rectangle highlights the motifs related to the solar-UV signature. The middle and lower panels show the frequency of motif in maize and soybean, respectively. For each motif, the left bar is the overall frequency around SNP sites, while the right bar is the overall frequency of the same motif around random sites (an empirical 95th percentile drawn from 100 random sample scenarios). The colored bar indicates the common motif between maize and soybean with a frequency greater than 1/96, and the frequency of motif at SNP sites is higher than that at random sites. The bar with a star on top highlights the motif related to solar-UV signature
[image:6.595.58.538.89.422.2]verify the pattern with rare segregating SNPs that oc-curred as relatively recent mutations [45, 46]. Therefore, following the procedures laid out in a previous study [6], we compiled private SNP sets that contain 2,651,790 population-private SNPs in maize and 681,791 population-private SNPs in soybean from original studies [29, 30] (Additional file1: Figure S1). These private SNP sets are different from the earlier common SNP sets with a small overlap. A SNP is considered as population private if it is segregating in 1 lineage but fixed ancestral allele in other lineages. For each crop, we obtained 4 population-private SNP sets: private wild SNPs (PW), pri-vate domesticated SNPs (PD), pripri-vate landrace SNPs (PL), and private improved cultivar SNPs (PI). PW designates SNPs that are segregating in the wild group but are fixed ancestral alleles in the landrace and the improved cultivar groups; PL means those SNPs are segregating in the land-race group but are fixed ancestral alleles in the wild and the improved cultivar groups, and similarly for other pri-vate SNP sets. Analyzing such SNPs enables us to assess the mutation rate difference among different lineages after diverged from the most recent common ancestor.
Next, we tested the differences in the spectrum of muta-genesis between populations with population-private vari-ants as described in the previous study [6]. With ancestral allele information, population-private SNPs can be parti-tioned into 96 mutation types by considering the base im-mediately upstream and downstream of the variable site [47]. In both species, most C→T transitions have higher frequencies in PL and PI than in PW, which agrees with the previous finding in a human study [6] (Fig.5). This ob-servation suggests although genomes of domesticated and wild accessions were continuing to evolve after divergence, domesticated accessions might have higher C→T mutation rate. We observed a higher rate of mutations related to solar-UV signature 5′-TCG-3′→5′-TTG-3′ and 5′-CCG-3′→5′-CTG-3′(hereafter abbreviated as TCG→T and CCG→T) in domesticated accessions than in wild ac-cessions (Fig.5, Additional file1: Figure S19). For instance, in maize, TCG→T has a frequency of 3.45% in PL and 3.55% in PI compared with 2.99% in PW. The higher fre-quencies of TCG→T and CCG→T in domesticated than wild accessions are consistent for all chromosomes (Add-itional file 1: Figure S20). We further split each population-private SNP set to genic-private SNPs and non-genic-private SNPs, and pericentromeric-private SNPs and non-pericentromeric-private SNPs. As shown by Add-itional file1: Figure S21, in both species, the TCG→T and CCG→T mutations generally have higher frequencies with non-genic-private SNPs and pericentromeric-private SNPs.
This overrepresentation of mutations related to solar-UV signature found in the private SNP sets together with the enrichment of motifs related to solar-UV signa-ture found in the common SNP sets suggests that solar
UV is potentially one of the major forces driving the [AT]-increase pattern during domestication.
Overrepresentation of genes repairing UV-damaged DNA near loci associated with genome divergence
With genome-wide association studies (GWAS), the pvious study in human found the enrichment of DNA re-pair genes surrounding loci associated with genome divergence captured by base-composition across poly-morphic sites [5]. The enrichment of solar-UV signature mutations in domesticated accessions suggests that solar-UV radiation plays an important role in driving the [AT]-increase pattern. Plant genomes encode a complex system to monitor and repair DNA damage. We assessed whether genes involved in UV damage repair pathways are enriched near loci associated with genome divergence for [AT].
Using the [AT] values obtained from the common SNP sets as a genome phenotype, GWAS identified a series of loci significantly associated with base-composition across polymorphic sites (Additional file1: Figure S22). Based on either the sequence similarity of rice genes orArabidopsis
genes [48], 334 maize and 107 soybean genes were com-piled as related to UV-damaged DNA repair (UV-related gene hereafter). Proportion tests indicate that the UV-related genes were more likely to reside nearby GWAS signals than by chance (Additional file 1: Tables S1-S4). In maize, for the 500-kb segments around signifi-cantly associated SNPs, we identified 4.2% of UV-related genes, but these regions only encode 1.8% of all annotated genes. In soybean, for the 500-kb segments around signifi-cantly associated SNPs, 20.6% of UV-related genes were identified, while only 13.8% of annotated genes were encoded in these regions. The tagged genes involved in all the steps for global genome nucleotide excision repair (NER) pathway to repair UV damage are shown in Additional file1: Figure S23.
Figure S24). Soybean genome encodes two copies ofLig1, and we did not detect signals forLig1on chromosome 12.
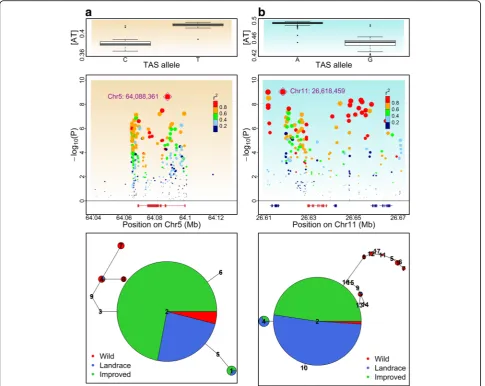
BothATRandLig1are located within selective sweep re-gions identified in previous studies [30,49], which suggest the possibility that polymorphisms within ATR and Lig1
went through domestication bottleneck. We then con-ducted haplotype network analysis of these two genes. There are two distinct clusters of haplotypes in both ATR
andLig1(Fig.6), one composed mostly of domesticated ac-cession haplotypes and the other composed mostly of wild accession haplotypes. We refer to these clusters as domesti-cated cluster haplotype (DCH) and the wild cluster haplo-type. InATR, DCH is present in > 98% of maize but < 18% of teosinte; while inLig1, DCH is present in > 97% of do-mesticated soybean but < 5% of wild soybean. Intriguingly, the major haplotype (haplotype2) in both genes are shared
by most of the domesticated accessions and a small number of wild accessions. Haplotype2 in ATR is shared among 86.7% of maize and 17.6% of teosinte, and haplotype2 in
Lig1is shared by 86.7% of domesticated soybean and 2% of wild soybean. Considering that domestication largely in-volved selection of favorable alleles from standing allelic variation in wild ancestors [1], it is likely that the major haplotypes for bothATRandLig1were present in the an-cestral populations with low frequency, and their frequen-cies increased rapidly during domestication.
Discussion
Our understanding of how plant genomes have changed following domestication bottlenecks remains limited. In this study, we aim to address the question from a novel angle by surveying the genome-wide base-composition
Fig. 5Enrichment test of mutations related to solar-UV signature with population-private SNPs.a,bCompare the mutation frequency between landraces and wild accessions in maize and soybean, respectively, and thexcoordinate of each point indicates the fold frequency difference (fPL(m)−fPW(m))/fPW(m).c,dCompare the mutation frequency between improved cultivars and wild accessions in maize and soybean,
respectively, and thexcoordinate of each point indicates the fold frequency difference (fPI(m)−fPW(m))/fPW(m). Theycoordinate indicates
Pearson’sχ2value that measures the significance of the difference betweenfm(P1) andfm(P2). Outlier points are labeled with the ancestral state of
the mutant nucleotide flanked by two neighboring bases, and the color of the points indicate the ancestral and derived alleles of the mutant site. The purple rectangle highlights the mutations related to solar-UV signature. Here, TCG on the plot represents mutation 5′-TCG-3′→5′-TTG-3′ and its reverse complement 5′-CGA-3′→5′-CAA-3′, CCG represents mutation 5′-CCG-3′→5′-CTG-3′and its reverse complement 5′-CGG-3′→5′ -CAG-3′, and similarly for all the other dots on the plot
[image:8.595.58.539.89.435.2]pattern and its potential associated mechanisms. Focus-ing on a genome phenotype summarized from millions of polymorphic sites along the chromosome, we provide novel insights on genome evolution at different parts of the genome: genic versus non-genic, pericentromeric versus non-pericentromeric, and methylated versus unmethylated. This study also presents a first case where a few critical components in genome evolution are brought together: “base composition”, “mutation”, “UV radiation”,“DNA repair”, and“methylation”.
The [AT]-increase in domesticated over wild acces-sions is consistently observed with the overall genome-wide SNPs, SNPs within major genomic
annotation sets, and SNPs from different genomic re-gions. These findings indicate the presence of common underlying mechanisms that drive the domesticated ac-cessions to build their genomes with more A and T nucleotides.
Demographical analyses have shown that plant and ani-mal species experienced population size changes associ-ated with domestication and range expansion [50–54]. The effective population size of maize has decreased strik-ingly from the onset of domestication (≈10,000 years ago) to the recent past (≈1100–2400 years ago) and increased during post-domestication expansion [50]. In contrast to maize, the wild parviglumis experienced an increase in
[image:9.595.57.543.88.474.2]effective population size which also lasts until the recent past (≈1100–1800 years ago) [50]. In plants, the increased mutational load has been observed in populations that undergo declines in effective population size [50, 55, 56]. Thus, one interpretation for our findings is that domesti-cated populations have historically lower effective popula-tion size, which results in a stronger genetic drift, and consequently lead to higher mutation numbers compared with their wild relatives. Meanwhile, our discovery of the overrepresentation of mutations related to a solar-UV sig-nature in domesticated accessions indicated a varied mu-tation rate across populations. Therefore, an alternative interpretation is that alleles of UV damage repair genes have different repair efficiency (lower in domesticated ac-cessions) and affect the number of de novo mutations in different lineages.
Regarding the increased [AT] in domesticated acces-sions, one natural question to ask is: What is the conse-quence of building genomes with more A and T nucleotides? One possibility will be more efficient energy usage. Energy usage efficiency is a trait under universal selection that has shaped various genomic aspects. For example, highly expressed proteins use cheaper amino acids [57–60] and are generally shorter than lowly expressed ones [61,62]. Synthesizing a G+C basepair re-quires a larger amount of energy and nitrogen than pro-ducing an A+T basepair [63]. Base stacking for G and C is more energetically expensive compared with that for A and T, as G binds to C with three hydrogen bonds while A binds to T with two hydrogen bonds [64]. Therefore, it may be interesting to ask whether domesti-cated accessions build their genomes with more A and T so that more energy is saved for other biological pro-cesses toward better yield potential.
Recent studies have shown the high heterogeneity of mutation rate across genomic regions [65–67]. Our sur-vey discovered the enrichment of motifs related to solar-UV signature surrounding SNPs, especially for SNPs located in non-genic and pericentromeric regions, which suggests solar-UV radiation is likely one of the major contributors for plant genome divergence. In gen-eral, DNA methylation level of non-genic regions is higher than that of genic regions, and pericentromeric regions higher than non-pericentromeric regions [13,
28]. Higher methylation levels in non-genic and pericen-tromeric regions potentially provide a greater amount of base materials for solar UV-induced C→T transition at the 5′-Py-mCG-3′ context, which is also supported by our findings of higher frequencies of motifs related to the solar-UV signature from methylated regions than unmethylated regions. DNA methylation is highly enriched within transposable elements and repetitive se-quences [12, 13, 28]. Thus, this interesting connection between DNA methylation and solar UV-induced
mutation propels us to ask a critical question: Is the fre-quent transition of methylated C to T actually a cost that genomes have to pay for having transposons and repeti-tive sequences methylated?
Compared with chromosome arms, pericentromeric regions are highly enriched with repetitive sequences and transposable elements and generally have higher methylation levels, lower gene density, and lower recom-bination rates [13, 28, 30, 33–36]. In this study, we ob-served associations between [AT]-difference and methylation level, transposable element, and recombin-ation rate. A previous study illustrated that DNA trans-poson activity is associated with an increased number of mutations in the sequences close to the transposon [68]. This suggests that enriched transposable elements at pericentromeric regions may contribute to the increased accumulation of mutations within these regions. In sex-ual organisms, non-recombining regions of a genome were found to be subjected to Muller’s ratchet [69–72], and regions with active recombination are more efficient in the purging of the deleterious mutations [39]. This may also partially explain the findings of enriched muta-tions related to solar-UV signature and enlarged [AT]-difference in the pericentromeric regions.
Solar UV primarily induces C→T base transition at 5′-PymCG-3′ sequence context [20, 40, 73], and CG methylation can enhance solar-UV-induced mutation at 5′-PymCG-3′ sites [25]. However, a few questions still need to be addressed to understand the increased rate of mutations related to a solar-UV signature in domesticated accessions. The first question is how DNA methylation varies across populations as variation in DNA methylation level may lead to the observed difference in the rate of mutations related to solar-UV signature between domesti-cated and wild groups. A recent study on 51 diverse maize inbred lines identified 172 maize-teosinte differentially methylated regions (DMRs), which are biased toward more examples of higher methylation levels in teosinte than maize [74]. Because those DMRs only represent a very small portion of the genome and the majority of the methylated regions are conserved within the maize, the identified DMRs should not be a major contributor to the observed difference in the rate of mutations related to solar-UV signature between the two groups. The other question is how UV could induce germline mutations as germline cells are generally shielded from direct solar ra-diation. The damaging effects of solar UV are often limited to the epidermis cells due to low UV-B penetration into plant tissues through flavonoid layer [75, 76]. However, some evidences suggest that UV-B may penetrate into meristematic tissues as increased genome instability in plant germline has been observed even with low UV-B ra-diation [77]. In addition, plant germline cells divide several times during the vegetative growth stage and separated
into sex-specific lineages only during late flower develop-ment [78]. Thus, we suspect that mutations induced by solar UV during vegetative growth in cells of the apical meristem may be inherited into the progeny.
Using a phenotype summarized from millions of SNPs, we identified a set of UV-related genes nearby signals as-sociated with genome divergence. We speculate at some point before domestication, during gametogenesis, spon-taneous mutations randomly took place within a UV-related gene. The gene with altered sequence may have a mild difference in terms of locating or repairing DNA errors [79]. Therefore, the lineages in which muta-tions in UV-related genes were segregating began to ac-cumulate systematic difference in DNA repair, which contributed to the genome divergence patterns captured by base composition. In the mutation accumulation ex-periments, once an Escherichia coli lineage acquired 1 bp insertion in mutT gene at the 26,500th generation, the later generations from this lineage began to show greatly elevated mutation rates and bias toward substitu-tion type from A to C than the progenies from other lin-eages [73]. The recent study that compared the accumulated mutations after 20 generations between wild-type and DNA repair-deficient mice suggested dif-ferent patterns in rate and direction between 2 lineages [80]. A similar phenomenon has been observed for som-atic mutations in cancer cell. The substitution type and rate vary for patients with different variations in DNA repair genes [81]. The varied mutation rate has been re-ported in natural populations at the genome level [82], the family level [83], and the subpopulation level [6]. These findings suggested the hypothesis that polymor-phisms within UV-related genes played a role in differ-ent DNA repair efficiency, which in turn affected the mutation rate differently in different lineages.
Initiation of domestication typically involved a set of key genes controlling for domestication syndrome, a set of traits differentiating wild and domesticated accessions. The causal polymorphisms underlying the domestication syndrome are sought to be the direct targets of artificial selection [1, 3, 4]. Although the UV-related genes were detected through a genome phenotype clearly separated between domesticated and wild accessions, we speculate that these genes were probably not the direct targets be-cause these polymorphisms were less likely to lead to visible agronomic traits that human ancestors desired. The observation that wild and domesticated accessions share the same haplotype for ATR and Lig1 suggested that the polymorphisms in these two genes more likely emerge earlier than the onset of domestication. The con-sequence of changing these UV-related genes probably promoted the occurrence of desired traits, which was subject to the direct selection. The identified UV-related genes indicate almost every step in the NER pathway
contributes to the overall [AT]-increase (Additional file1: Figure S23), suggesting the complexity of molecular mechanisms.
Molecular experiments need to be carried out to pro-vide epro-vidence supporting the function of these UV-related genes and their connection to the base-composition pat-tern. Although it is beyond the scope of this study to ad-dress the functional difference between wild and domesticated alleles and the molecular mechanisms af-fecting the repair efficiency, this study pointed to a new direction for addressing some fundamental questions about the genome itself. We think that mutation repair genes, like ATR and Lig1, harboring significant changes such as altered gene structure, should be the next priority to study and provide molecular evidences. Induced muta-tion accumulamuta-tion experiments with UV as the mutagen and near-isogenic lines (NILs) segregating only at the re-gions surrounding mutation repair genes as starting mate-rials will be preferable to demonstrate the connection between UV-induced mutation and base composition change. Sequencing lines that derived from starting mate-rials carrying mutations at UV-damaged DNA repair gene regions may also provide additional support.
Conclusions
Base-composition difference between domesticated ac-cessions and wild acac-cessions at the dynamic part of the genome suggests the important role of AT-bias mutation in shaping the overall pattern of base-composition vari-ation. Regional variations of base-composition pattern indicate that non-genic SNPs and pericencentromeric regions have greater contributions to the observed pat-tern. This finding together with the discovery of solar UV’s potential role in driving the genome divergence es-tablishes the connection between DNA methylation and base-composition variation. By focusing on the evolu-tionary outcome, our genome scans in maize and soy-bean identified a set of UV damage repair genes. Rapidly improved genomics and epigenomics capacity would fur-ther facilitate our efforts to probe potential connections among base composition, mutation, methylation, DNA repair, and genome evolution.
Methods
Sequence information and SNP extraction
and 110 improved cultivars) [30]. Information for maize and soybean accessions are provided in Additional file1: Table S5 and Table S6, respectively. With CrossMap v0.2.5 [84], genome coordinates of the original SNP sets in B73 AGPv2 and Williams 82 version 1.1 were con-verted to that in B73 AGPv4 and Williams 82 version 2.0, respectively. In maize, the assembly chain file for CrossMap is available at ftp://ftp.ensemblgenomes.org/ pub/plants/release-39/assembly_chain/zea_mays/ AGPv2_to_AGPv4.chain.gz. And in soybean, the assem-bly chain file is available at ftp://ftp.ensemblgenomes. org/pub/plants/release-39/assembly_chain/glycine_max/ V1.0_to_Glycine_max_v2.0.chain.gz.
Then, for each species, we obtained 2 sets of SNPs (common SNP set and population-private SNP set) from the original SNP sets by applying different filtering cri-teria (Additional file 1: Figure S1). The common SNP sets containing 8,852,678 SNPs in maize and 4,870,265 in soybean are obtained by filtering with a MAF thresh-old of 5% and a missing rate threshthresh-old of 20%. These common SNP sets are used for all analyses except population-private SNP analysis.
For population-private SNP sets, we followed the proced-ure laid out in a previous study [6] to obtain 2,651,790 population-private SNPs in maize and 681,791 population-private SNPs in soybean. The private SNP sets are different from the common SNP sets with a small over-lap. Ancestral state of the maize allele was inferred based on the allele ofTripsacum[49]. To infer the ancestral state of the soybean allele, BLASTN [85] (version 2.2.28+) was used to identify the orthologous regions between soybean andMedicago truncatula. Each SNP and its 58 bases flank-ing sequences were extracted from the soybean genome then blasted to theMedicago truncatulagenome sequence [86] with anevalue <1e−1and only the best hit was consid-ered. A SNP is considered as population private if it is seg-regating in 1 group but fixed ancestral allele in other groups. Based on this definition, we obtained 1,137,732 pri-vate wild SNPs (PW) that are segregating in the wild group but fixed ancestral allele in the landrace and improved cul-tivar groups; 1,514,058 private domesticated SNPs (PD) that are segregating in either the landrace or improved group but fixed ancestral allele in the wild group; 270,390 private landrace SNPs (PL) that are segregating in the landrace group but fixed ancestral allele in the wild and improved cultivar groups; and 537,259 private improved cultivar SNPs (PI) that are segregating in the improved cultivar group but fixed ancestral allele in the wild and landrace groups. In soybean, we obtained 571,756 PW, 110,035 PD, 20,543 PL, and 1798 PI. The total numbers of SNPs (2,651,790 in maize and 681,791 in soybean) in private SNP sets are obtained by summing up PW and PD because there are no overlapping SNPs between the two population-private SNP sets by definition.
For maize, all analyses were done using maize B73 genome (version AGPv4) as references. For soybean, all analyses were done using soybean Williams 82 genome (version 2.0) as references.Medicago truncatulagenome sequence (version Mt4.0) was downloaded from Phyto-zome. Short reads from representative soybean acces-sions were downloaded from GenBank.
Bioinformatics
DNA reads were mapped to the soybean reference gen-ome by BWA with the BWA-MEM algorithm [87]. R packages Rsamtools [88] and GenomeGraphs [89] were used to analyze and display the sequence coverage in candidate genes. The missing genotypes in candidate genes were imputed by fastPhase under the context in-cluding up- and downstream 20 kb regions [90]. R pack-age pegas was used to reconstruct the haplotype networks with SNPs detected in the genes [91]. All the other analyses are done with in-house scripts written in Perl or R. Base-composition across genome-wide SNP sites was calculated as described in a previous study [5]. Because of PR2, i.e., nucleotide A content ([A]) from SNP sites is roughly equals to [T] ([A]≈[T]) and [C]≈[G] [5], the value of [AT] was used in this study.
Base-composition distribution among substitution types Bi-allelic SNPs can be grouped into 6 substitution types (A/C, A/G, A/T, C/G, C/T, and G/T) without a defined ancestral allele. For example, if C and T alleles are de-tected in 1 SNP site, which might arise either from C to T change or from T to C change, it is a C/T substitution type. For each substitution type, the total number of each nucleotide type possessed by each accession was counted and divided by the total number of polymorphic sites (8.9 million in maize and 4.9 million in soybean for the accession without missing calls).
Base-composition distribution at different genomic regions
SNP effects were predicted with the SnpEff v4.3 [92]. In maize, we built the database with reference genome se-quences available at ftp://ftp.ensemblgenomes.org/pub/ plants/release-39/fasta/zea_mays/dna/Zea_mays.AGPv4. dna.toplevel.fa.gz and gene annotation available at ftp:// ftp.ensemblgenomes.org/pub/plants/release-39/gff3/zea_ mays/Zea_mays.AGPv4.39.chr.gff3.gz. In soybean, we built the database with reference genome sequences available at
ftp://ftp.ensemblgenomes.org/pub/plants/release-39/fasta/ glycine_max/dna/Glycine_max.Glycine_max_v2.0.dna. toplevel.fa.gz and gene annotation available at ftp://ftp. ensemblgenomes.org/pub/plants/release-39/gff3/glycine_ max/Glycine_max.Glycine_max_v2.0.39.chr.gff3.gz.
Seven genomic annotation sets (intergenic, gene-proximal, UTRs, synonymous, missense, intronic, and other genic)
were obtained by classifying SNPs based on the predicted SNP effect. SNPs were classified to be gene-proximal if they fell within 5 kb upstream of the transcription start site. Then, intergenic set together with the gene-proximal set is consid-ered as non-genic SNP set, and the rest five SNP sets are considered to be genic SNP set. After that, base-composition across polymorphic sites was calculated for genic SNP set and non-genic SNP set separately.
The physical positions for maize centromeric correspond-ing to the genome (version AGPv4) were referred from a previous study [93]. Then, a 40-Mb segment directly adja-cent upstream and downstream of the adja-centromeric region was considered as pericentromeric regions based on a pre-vious study [33]. And the physical coordinates for soybean centromeric and pericentromeric regions were obtained from [34] and Soybean Genome Browser at SoyBase
https://soybase.org/gb2/gbrowse/gmax2.0/.
To analyze the base-composition distribution along chromosomes, we calculated the [AT] for each accession with a moving average approach of a 5-Mb window size and a 4-Mb step size on each of the maize and soybean chromosomes with both genic and non-genic SNPs. In-deed, we examined the [AT] distribution with a series of window size including 1 Mb, 2 Mb, 5 Mb, and 10 MB. The patterns for all of those window sizes are similar. We decided to go with the 5 Mb for the analyses be-cause it contains a good amount of SNPs in each win-dow and the line of [AT] distribution is smoother than the smaller window size.
The position of crossovers (COs) in maize was referred from [39]. Then, [AT]-difference and crossover (CO) rate were calculated using a 5-Mb sliding window. Re-combination rate data in soybean was referred from [30]. [AT]-difference and recombination rate were lated using a 1-Mb window. The correlation was calcu-lated between [AT]-difference and CO rate or recombination rate for each chromosome.
Transposable element (TE) regions in maize and soy-bean are referred from [93,94]. Then, base-composition across polymorphic sites was calculated for SNPs within TE regions and non-TE regions separately.
Selective sweep regions in maize and soybean are re-ferred from [29, 30]. Then, base-composition across polymorphic sites was calculated for SNPs within select-ive sweep and non-selectselect-ive sweep regions separately.
The maize methylation data was generated from whole-genome bisulfite sequencing (WGBS) of the leaf tissue of maize B73 seedling [42]. Genome coordinates of B73 methylation data in AGPv2 were converted to that in AGPv4 with the CrossMap v0.2.5 [84]. Then, the maize genome was separated into methylated and unmethylated regions based on whether the percentage of CG methyla-tion within each 100 bp non-overlapping window is greater than 40% or not. The soybean methylation data
was generated from WGBS of the leaf of soybean Williams 82 [43] and GsojaD [44].
MethylC-seq reads of GsojaD were first mapped to its own genome assembly to get methylation call. Then, the genome coordinates of GsojaD methylation were con-verted to the coordinates in Williams 82 genome version 2. Genome coordinates of Williams 82 methylation data in Williams 82 version 1.1 were converted to those in version 2.0 with the CrossMap v0.2.5 [84]. Then, the soybean genome was separated into the methylated and unmethylated regions based on CG methylation sites that are common to both Williams 82 and GsojaD.
Motif enrichment analysis
For each SNP site, the directly adjacent upstream and downstream bases were extracted from reference ge-nomes; meanwhile, the adjacent sequences of 1 ran-domly selected site from 1 kb flanking region were also extracted. For each of the 96 possible tri-nucleotide mo-tifs (5′-NXN-3′, X is the polymorphic site or randomly selected site), an empirical threshold at the 95th percent-ile was drawn from 100 random sample scenarios. A motif is considered as enriched if the ratio of its fre-quency at SNP site over the 95th percentile at random site is greater than 1.
Population-private SNP analysis
We used the procedure laid out in a previous study [6] to test the mutation spectrum differences between popu-lations with population-private SNPs. SNPs within each private SNP set were partitioned into 96 mutation types through considering the base immediately upstream and downstream of the variable site [47]. Count data Cp(m)
of typemmutations in setPfor each mutation typem=
B50BAB30 →B50BDB30 of each private SNP setPwere
ob-tained. Then, with aχ2test,fPI(m) andfPL(m) were com-pared with fPW(m). For the χ2 test, we used χ2 value instead of P value to indicate the significance of differ-ence because P value cannot be obtained for very large
χ2
value in our data.
To assess the variance off(TCG→T) andf(CCG→T), private SNP sets PL, PI, and PW in maize and PD and PW in soybean was partitioned into non-overlapping bins of 1000 consecutive SNPs. Then, f(TCG→T) and
f(CCG→T) for each bin were calculated.
GAPIT version 3.35 [97]. Parameters in MLM were determined by model selection process [95, 96]. Five principle components (PC2-PC6) were selected in maize, and 0 PC was selected in soybean. PC1 was not under the model selection process because of its near-perfect correlation with [AT] [5]. The signifi-cance threshold P value was determined by Bonfer-roni correction.
The 334 maize genes and 107 soybean genes associ-ated with repairing UV-damaged DNA were compiled based on either the sequence similarity of rice genes or
Arabidopsis genes [48]. We conducted enrichment test of UV-related genes with a series of window sizes cen-tered by significantly associated SNPs as described in a previous study [31]. The proportion of UV-related genes within each window was compared with its genome-wide proportion. The gene was counted when it was tagged by at least 2 significantly associated SNPs. Then, we tested whether the proportion of UV-related genes within the window is significantly higher than that across the whole genome using a proportion test. The window size smaller than 500 kb in maize and 200 kb in soybean was not tested because their numbers of tagged UV-related genes were less than 10, which violated the condition of the proportion test.
Additional file
Additional file 1:Figure S1.Diagram of SNP filtering process.Figure S2.
Frequency of SNP substitution types.Figure S3.Base-composition distribution for randomly sampled genic and non-genic SNPs.Figure S4.
Comparison of base-composition distribution between different regions of the genome.Figure S5.Distribution of MAF for genome-wide genic and non-genic SNPs.Figure S6-S8.Base-composition distribution for genic and non-genic SNPs across chromosomes.Figure S9.Base-composition distribution at TE and non-TE regions.Figure S10.Base-composition distribution between domesticated and wild accessions and crossover rate for maize chromosomes.Figure S11-S12. Base-composition distribution between domesticated and wild accessions and recombination rate for soybean chromosomes.Figure S13-S15.Distribution of MAF calculated with genic and non-genic SNPs across chromosomes.Figure S16. Base-composition distribution at selective sweep and non-selective-sweep regions.Figure S17.Frequencies of motifs related to solar-UV signature among genic and non-genic SNPs conditional on methylated and unmethylated regions.Figure S18.Frequencies of motifs related to solar-UV signature among SNPs from pericentromeric and non-pericentromeric regions under methylated and unmethylated conditions.Figure S19.
Enrichment test of mutations related to solar-UV signature with population-private SNPs.Figure S20.Distribution off(TCG) andf(CCG) across population-private SNPs.Figure S21.Distribution off(TCG) andf(CCG) at different genomic regions.Figure S22.GWAS-identified genomic regions underlying base-composition variation.Figure S23.GWAS tagged genes in NER pathway.Figure S24.Polymorphisms in soybeanDNA ligase1.Table S1.UV-related genes are enriched near the associated loci in maize.Table S2.UV-related genes tagged by the associated SNPs in maize.Table S3.
UV-related genes are enriched near the associated loci in soybean.Table S4.UV-related genes tagged by the associated SNPs in soybean.Table S5.
Summary of 100 maize accessions.Table S6.Summary of 302 soybean accessions. (PDF 3092 kb)
Abbreviations
CO:Crossover; CPDs: Cyclobutane pyrimidine dimers; DCH: Domesticated cluster haplotype; DMRs: Differentially methylated regions; GWAS: Genome-wide association studies; MAF: Minor allele frequency; NER: Nucleotide excision repair; PD: Private domesticated SNPs; PI: Private improved cultivar SNPs; PL: Private landrace SNPs; PW: Private wild SNPs; TE: Transposable element; UV: Ultraviolet; WGBS: Whole-genome bisulfite sequencing
Acknowledgements
We thank our colleagues Dr. Tingting Guo, Dr. Adam Vanous, Matthew Dzievit, James McNellie, Qi Mu, Jialu Wei, and Laura Tibbs for their useful suggestions about the research. We are also grateful to the critical comments from anonymous reviewers.
Funding
This work was supported by the National Science Foundation grant IOS-1238142, by the Iowa State University Raymond F. Baker Center for Plant Breeding, and by the Iowa State University Plant Science Institute.
Availability of data and materials
The original datasets analyzed in the current study were reported previously [29,30], and can be downloaded fromhttp://www.panzea.org/genotypesand http://figshare.com/articles/Soybean_resequencing_project/1176133. The lists of accessions used in the current study were provided in Additional file1: Table S5 and Table S6.
The pipeline and custom scripts utilized in this paper are documented in the following Zenodo repository (DOI:https://doi.org/10.5281/zenodo.2566552[98]).
Authors’contributions
JY, XL, and JW designed the study. JW, XL, KKD, MJS, SAJ, and NMS conducted the analyses. JW, XL, and JY wrote the manuscript with inputs from all authors. All authors read and approved the final manuscript.
Ethics approval and consent to participate
Not applicable
Consent for publication
Not applicable
Competing interests
The authors declare that they have no competing interests
Publisher’s Note
Springer Nature remains neutral with regard to jurisdictional claims in published maps and institutional affiliations.
Author details
1
Department of Agronomy, Iowa State University, Ames, IA 50011, USA.
2Center for Applied Genetic Technologies, University of Georgia, Athens, GA
30602, USA.3Plant Biology Section, School of Integrative Plant Science,
Cornell University, Ithaca, NY 14853, USA.4Department of Plant and Microbial
Biology, University of Minnesota, St. Paul, MN 55108, USA.
Received: 2 October 2018 Accepted: 28 March 2019
References
1. Doebley JF, Gaut BS, Smith BD. The molecular genetics of crop domestication. Cell. 2006;127:1309–21.
2. Purugganan MD, Fuller DQ. The nature of selection during plant domestication. Nature. 2009;457:843–8.
3. Meyer RS, Purugganan MD. Evolution of crop species: genetics of domestication and diversification. Nat Rev Genet. 2013;14:840–52. 4. Olsen KM, Wendel JF. A bountiful harvest: genomic insights into crop
domestication phenotypes. Annu Rev Plant Biol. 2013;64:47–70.
5. Li X, Scanlon MJ, Yu J. Evolutionary patterns of DNA base composition and correlation to polymorphisms in DNA repair systems. Nucleic Acids Res. 2015;43:3614–25.
6. Harris K. Evidence for recent, population-specific evolution of the human mutation rate. Proc Natl Acad Sci U S A. 2015;112:3439–44.
7. Mallick S, Li H, Lipson M, Mathieson I, Gymrek M, Racimo F, Zhao M, Chennagiri N, Nordenfelt S, Tandon A, et al. The Simons genome diversity project: 300 genomes from 142 diverse populations. Nature. 2016;538:201–6. 8. Sharp PM, Matassi G. Codon usage and genome evolution. Curr Opin Genet
Dev. 1994;4:851–60.
9. Bernardi G. The isochore organization of the human genome. Annu Rev Genet. 1989;23:637–61.
10. Bernardi G. Isochores and the evolutionary genomics of vertebrates. Gene. 2000;241:3–17.
11. Duret L, Galtier N. Biased gene conversion and the evolution of mammalian genomic landscapes. Annu Rev Genomics Hum Genet. 2009;10:285–311. 12. Springer NM, Schmitz RJ. Exploiting induced and natural epigenetic
variation for crop improvement. Nat Rev Genet. 2017;18:563–75. 13. Song QX, Lu X, Li QT, Chen H, Hu XY, Ma B, Zhang WK, Chen SY, Zhang JS.
Genome-wide analysis of DNA methylation in soybean. Mol Plant. 2013;6: 1961–74.
14. Glemin S, Clement Y, David J, Ressayre A. GC content evolution in coding regions of angiosperm genomes: a unifying hypothesis. Trends Genet. 2014; 30:263–70.
15. Nachman MW. Variation in recombination rate across the genome: evidence and implications. Curr Opin Genet Dev. 2002;12:657–63. 16. Hershberg R, Petrov DA. Evidence that mutation is universally biased
towards AT in bacteria. PLoS Genet. 2010;6:e1001115.
17. Mathieson I, Reich D. Differences in the rare variant spectrum among human populations. PLoS Genet. 2017;13:e1006581.
18. Massey DJ, Koren A. Mismatch repair prefers exons. Nature Genet. 2017;49: 1673–4.
19. Hu Z, Cools T, De Veylder L. Mechanisms used by plants to cope with DNA damage. Annu Rev Plant Biol. 2016;67:439–62.
20. Ikehata H, Ono T. The mechanisms of UV mutagenesis. J Radiat Res. 2011;52: 115–25.
21. Nawkar GM, Maibam P, Park JH, Sahi VP, Lee SY, Kang CH. UV-induced cell death in plants. Int J Mol Sci. 2013;14:1608–28.
22. Jones PA. Functions of DNA methylation: islands, start sites, gene bodies and beyond. Nat Rev Genet. 2012;13:484–92.
23. Law JA, Jacobsen SE. Establishing, maintaining and modifying DNA methylation patterns in plants and animals. Nat Rev Genet. 2010;11:204–20. 24. Walser JC, Ponger L, Furano AV. CpG dinucleotides and the mutation rate of
non-CpG DNA. Genome Res. 2008;18:1403–14.
25. Tommasi S, Denissenko MF, Pfeifer GP. Sunlight induces pyrimidine dimers preferentially at 5-methylcytosine bases. Cancer Res. 1997;57:4727–30. 26. Cokus SJ, Feng S, Zhang X, Chen Z, Merriman B, Haudenschild CD, Pradhan
S, Nelson SF, Pellegrini M, Jacobsen SE. Shotgun bisulphite sequencing of theArabidopsisgenome reveals DNA methylation patterning. Nature. 2008; 452:215–9.
27. Feng S, Jacobsen SE, Reik W. Epigenetic reprogramming in plant and animal development. Science. 2010;330:622–7.
28. West PT, Li Q, Ji L, Eichten SR, Song J, Vaughn MW, Schmitz RJ, Springer NM. Genomic distribution of H3K9me2 and DNA methylation in a maize genome. PLoS One. 2014;9:e105267.
29. Chia JM, Song C, Bradbury PJ, Costich D, de Leon N, Doebley J, Elshire RJ, Gaut B, Geller L, Glaubitz JC, et al. Maize HapMap2 identifies extant variation from a genome in flux. Nat Genet. 2012;44:803–7.
30. Zhou Z, Jiang Y, Wang Z, Gou Z, Lyu J, Li W, Yu Y, Shu L, Zhao Y, Ma Y, et al. Resequencing 302 wild and cultivated accessions identifies genes related to domestication and improvement in soybean. Nat Biotechnol. 2015;33: 408–14.
31. Li X, Zhu C, Yeh CT, Wu W, Takacs EM, Petsch KA, Tian F, Bai G, Buckler ES, Muehlbauer GJ, et al. Genic and nongenic contributions to natural variation of quantitative traits in maize. Genome Res. 2012;22:2436–44.
32. Wallace JG, Bradbury PJ, Zhang N, Gibon Y, Stitt M, Buckler ES. Association mapping across numerous traits reveals patterns of functional variation in maize. PLoS Genet. 2014;10:e1004845.
33. Gore MA, Chia JM, Elshire RJ, Sun Q, Ersoz ES, Hurwitz BL, Peiffer JA, McMullen MD, Grills GS, Ross-Ibarra J, et al. A first-generation haplotype map of maize. Science. 2009;326:1115–7.
34. Schmutz J, Cannon SB, Schlueter J, Ma J, Mitros T, Nelson W, Hyten DL, Song Q, Thelen JJ, Cheng J, et al. Genome sequence of the palaeopolyploid soybean. Nature. 2010;463:178–83.
35. Wolfgruber TK, Sharma A, Schneider KL, Albert PS, Koo DH, Shi J, Gao Z, Han F, Lee H, Xu R, et al. Maize centromere structure and evolution: sequence
analysis of centromeres 2 and 5 reveals dynamic loci shaped primarily by retrotransposons. PLoS Genet. 2009;5:e1000743.
36. Lin JY, Jacobus BH, SanMiguel P, Walling JG, Yuan Y, Shoemaker RC, Young ND, Jackson SA. Pericentromeric regions of soybean (Glycine maxL. Merr.) chromosomes consist of retroelements and tandemly repeated DNA and are structurally and evolutionarily labile. Genetics. 2005;170:1221–30. 37. Wang Y, Tang X, Cheng Z, Mueller L, Giovannoni J, Tanksley SD.
Euchromatin and pericentromeric heterochromatin: comparative composition in the tomato genome. Genetics. 2006;172:2529–40. 38. Kong A, Gudbjartsson DF, Sainz J, Jonsdottir GM, Gudjonsson SA,
Richardsson B, Sigurdardottir S, Barnard J, Hallbeck B, Masson G, et al. A high-resolution recombination map of the human genome. Nat Genet. 2002;31:241–7.
39. Rodgers-Melnick E, Bradbury PJ, Elshire RJ, Glaubitz JC, Acharya CB, Mitchell SE, Li C, Li Y, Buckler ES. Recombination in diverse maize is stable, predictable, and associated with genetic load. Proc Natl Acad Sci. 2015;112: 3823–8.
40. Ikehata H, Ono T. Significance of CpG methylation for solar UV-induced mutagenesis and carcinogenesis in skin. Photochem Photobiol. 2007;83: 196–204.
41. Wang P, Xia H, Zhang Y, Zhao S, Zhao C, Hou L, Li C, Li A, Ma C, Wang X. Genome-wide high-resolution mapping of DNA methylation identifies epigenetic variation across embryo and endosperm in maize (Zea may). BMC Genomics. 2015;16:21.
42. Li Q, Gent JI, Zynda G, Song JW, Makarevitch I, Hirsch CD, Hirsch CN, Dawe RK, Madzima TF, McGinnis KM, et al. RNA-directed DNA methylation enforces boundaries between heterochromatin and euchromatin in the maize genome. Proc Natl Acad Sci U S A. 2015;112:14728–33.
43. Kim KD, El Baidouri M, Abernathy B, Iwata-Otsubo A, Chavarro C, Gonzales M, Libault M, Grimwood J, Jackson SA. A comparative epigenomic analysis of polyploidy-derived genes in soybean and common bean. Plant Physiol. 2015;168:1433–47.
44. El Baidouri M, Do Kim K, Abernathy B, Li Y-H, Qiu L-J, Jackson SA. Genic C-methylation in soybean is associated with gene paralogs relocated to transposable element-rich pericentromeres. Mol Plant. 2018;11:485–95. 45. Genomes Project C, Abecasis GR, Auton A, Brooks LD, De Pristo MA, Durbin
RM, Handsaker RE, Kang HM, Marth GT, McVean GA. An integrated map of genetic variation from 1,092 human genomes. Nature. 2012;491:56–65. 46. Genomes Project C, Abecasis GR, Altshuler D, Auton A, Brooks LD, Durbin
RM, Gibbs RA, Hurles ME, McVean GA. A map of human genome variation from population-scale sequencing. Nature. 2010;467:1061–73.
47. Alexandrov LB, Nik-Zainal S, Wedge DC, Campbell PJ, Stratton MR. Deciphering signatures of mutational processes operative in human cancer. Cell Rep. 2013;3:246–59.
48. Ganpudi AL, Schroeder DF. UV damaged DNA repair & tolerance in plants. Croatia: Intech Open Access Publisher; 2011.
49. Hufford MB, Xu X, van Heerwaarden J, Pyhajarvi T, Chia JM, Cartwright RA, Elshire RJ, Glaubitz JC, Guill KE, Kaeppler SM, et al. Comparative population genomics of maize domestication and improvement. Nat Genet. 2012;44: 808–11.
50. Wang L, Beissinger TM, Lorant A, Ross-Ibarra C, Ross-Ibarra J, Hufford MB. The interplay of demography and selection during maize domestication and expansion. Genome Biol. 2017;18:215.
51. Beissinger TM, Wang L, Crosby K, Durvasula A, Hufford MB, Ross-Ibarra J. Recent demography drives changes in linked selection across the maize genome. Nat Plants. 2016;2:16084.
52. Zhou Y, Massonnet M, Sanjak JS, Cantu D, Gaut BS. Evolutionary genomics of grape (Vitis viniferassp.vinifera) domestication. Proc Natl Acad Sci U S A. 2017;114:11715–20.
53. Marsden CD, Ortega-Del Vecchyo D, O’Brien DP, Taylor JF, Ramirez O, Vila C, Marques-Bonet T, Schnabel RD, Wayne RK, Lohmueller KE. Bottlenecks and selective sweeps during domestication have increased deleterious genetic variation in dogs. Proc Natl Acad Sci U S A. 2016;113:152–7.
54. McCoy RC, Akey JM. Patterns of deleterious variation between human populations reveal an unbalanced load. Proc Natl Acad Sci U S A. 2016;113: 809–11.
55. Liu Q, Zhou Y, Morrell PL, Gaut BS. Deleterious variants in Asian rice and the potential cost of domestication. Mol Bio Evol. 2017;34:908–24.
![Fig. 1 Genome-wide base-composition pattern in maize and soybean. a The distribution of [AT] among 8.9 million SNPs in 100 maize accessions.b The distribution of [AT] across 4.9 million SNPs in 302 soybean accessions](https://thumb-us.123doks.com/thumbv2/123dok_us/8590603.863521/3.595.61.538.524.703/genome-composition-distribution-accessions-distribution-million-soybean-accessions.webp)