Dynamic Wave Modeling and Flood Mapping For a
Reach of Krishna River Using Spatial Techniques
Priyanka .R. Dhumal1, Anand.B.Kudoli2
1
Assistant Professor, 2 Assistant Professor Pimpri Chinchwad College of Engineering and Research Ravet, Pune (INDIA)
Abstract: Among all kinds of natural hazards, floods is the probably most devastating, wide spread and frequent. For formulating any flood management strategy the first step is to identify the area most vulnerable to flooding. This step is even more critical for the developing countries in the monsoon in Asia, as the funding available for developmental activities is very limited. Flood maps play an increasingly prominent role in government strategies for flood risk management. This focuses on the theoretical concepts of hydraulic flood routing model, with time-varying roughness updating to simulate flows through natural channels, based on the quasi-steady dynamic wave and full dynamic wave theory, emphasizing the solving of the intricate Saint Venant’s equation (continuity & momentum equation). The conventional means to record hydrological parameters of a flood often fail to record an extreme event. Remote sensing technology along with geographic information system (GIS) has become the key tool for flood monitoring in recent years. The central focus in this field revolves around
delineation of flood zones and preparation of flood hazard maps for the vulnerable areas. For Flood Hazard map GIS software
Arc GIS and HEC-Geo RAS as well as hydraulic software HEC-RAS are used. The work presents a review of application of
remote sensing (ASTER DEM 30M) and GIS in Dynamic wave routing and flood mapping with particular focus on Krishna,
Koyana Reach.
Keywords: HEC-RAS, Dynamic Wave Routing, Hydraulic model, Flood mapping, Krishna, Koyana Reach, HEC-Geo RAS, Arc-GIS.
I. INTRODUCTION
capability and in validating the model. The forecasting results show that the stage recalculated by updating the Manning N, in current time has a good agreement with the observed stage.
Also, it encompasses the flood mapping in the reach of Krishna using HEC Geo-RAS developed in Arc GIS 10.2 environment. Flood mapping for year 2005 shows the how much area gets affected due to the flood from the main River and also from Koyana. It is helpful to know property damage due to the flood. Flood is a natural disaster in particular requires implementation of such measures like flood forecasting and early warning systems, which necessarily rely on technological and scientific advances.
II. STUDY AREA AND DATA SETS
Considering the availability of hydrological, meteorological, soil, and other collateral data, the reaches in Krishna River were selected as the study area for the present Dynamic waveroutingand flood plain modelling of study.
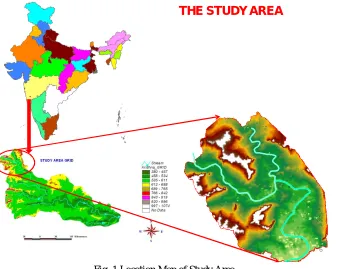
THE STUDY AREA
[image:3.612.142.482.209.478.2]6
Fig. 1 Location Map of Study Area
In India the Krishna River rises from Western Ghats near Maabeleshwar in Maharashtra state and after traversing a length of 304 Km. in Maharashtra, it enters into Karnataka state. Total length of the river is 1392 Km. and passes through Maharashtra, Karnataka and Andhra states joins the Bay of Bengal (Figure1). The Krishna basin in Maharashtra is broadly classified in two sub basins viz. Krishna sub-basin and Bhīma sub-basin. In the upper reaches of Krishna River in Maharashtra, rainfall is found to the tune of 4000 to 7000 mm. There are 11 Major, 12 Medium and 263 minor dams located in Upper Krishna basin. Total live storage capacity of these dams is 7136 Mm3. Looking to all these aspects; dams have limited scope in limited flood control. Therefore, heavy floods are observed and are always possible in future when there is intensive precipitation in all over area of Krishna sub-basin.
A. Data sets
The accuracy of the model depends on the detail and accuracy of the river geometry that is input to the model (as well as the choice of appropriate time and distance steps). Input data for each cross section must describe channel slope and geometry; over bank storage; natural and man-made constructions (such as bridges); channel and over bank roughness coefficients, and lateral inflows or outflows. In addition each model needs upstream and downstream “boundary conditions” – usually a flow hydrograph at the upstream end and some form of stage-discharge relationship at the downstream end.
2) Boundary condition: The simulation period from 27thJuly 2005, 28thJuly 2005 is constrained by the availability of data to prescribe the models boundary condition. The upstream boundary condition is in the form of stage/ flow Hydrograph. The downstream boundary condition is represented by a rating curve constructed from observed water levels and discharge measurements at Kurundwad provided by the Upper Krishna Division, Pune.
III. METHODOLOGY
The development of the present flood model integrates GIS with the HEC-RAS river hydraulic model. Hydraulic model produced flood events and water surface profiles over the length of the modeled stream. With the companion of GIS utility, HEC-GeoRAS, these water surface profiles are converted to flood inundation maps. Several RAS Themes are created in the process of developing the geometric data file to import in HEC-RAS. Flood maps are generated by exporting the HEC RAS model output results to Arc-GIS. The peak flows from observations are used as an input in HEC-RAS for developing flood inundation map. The different GIS and Hydrological software used are as follow
Table 1: Summary of Software Used In Analysis
Software Purpose
HEC-RAS v.4.1 Water surface computation program. Unsteady-flow module used.
HEC-GeoRAS v.10.2 Pre-processing of geometric data for import into HEC-RAS. Post-processing of HEC-RAS results. GeoRAS is an Arc Map toolbar.
Arc-GISv.10.2 GIS used for processing and visualization of spatially distributed data.
The methodology used in the reported work consists of three steps: (i) Pre-processing of geometric data for RAS, using GeoRAS tool; (ii) Hydraulic analysis in RAS. (iii) Post-processing of RAS results and floodplain mapping, using HEC-GeoRAS.
Pre-Processing Post-Processing
Tin Data Extracted Input Output GIS Themes Created Cross-sections Data Data Cross section cut lines
Stream centerline Exchange HEC-RAS Exchange File Bounding polygons Stream bank linesFile Water surface TINs
Flow lines Floodplain polygons
Fig. 2 Flowchart for Methodology
A. Pre-Processing (HEC-GeoRAS)
HEC-GeoRAS was used to create a geometric import file to import into HEC-RAS. The necessary geometry files for HEC-RAS simulation were generated using the Triangulated Irregular Network (TIN) model and the GIS tool HEC-GeoRAS in ArcGIS 10.2 with the spatial analyst and 3D analyst extension. The geometry file created contains river, reach and station information, cross-section cut lines, bank stations, reach lengths for left and right overbanks and channel and roughness coefficients.
B. Hydraulic Analysis
The last step was to export the GIS data to HEC-RAS for further modeling. The input requirement for the RAS model setup is the channel and floodplain information in the form of geometric data and hydrologic information in the form of unsteady flow.
surface elevations for each profile attached to each cross section. The export file also contains bounding polygon information for each profile on each reach. Bounding polygon information was used to define the limits of the hydraulic model.
C. Post-Processing (HEC-GeoRAS)
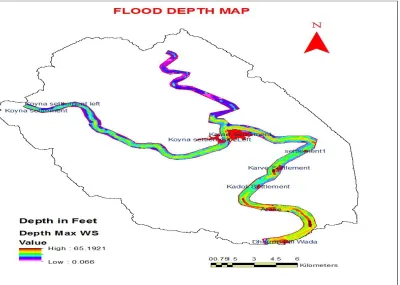
[image:5.612.112.512.293.578.2]Water surface profile data and velocity data exported from HEC-RAS was processed for floodplain delineation, inundation depth, and velocity GIS data sets. In this step, the water surface elevation data exported from HEC- RAS simulations were processed in HEC- GeoRAS for GIS analysis. The GIS data exchange between RAS and Arc GIS was done through a specifically formatted GIS data exchange (*.sdf) file. During the post processing of HEC- RAS results, GIS layers for inundation depth and flood plain boundary were created. Data exported from HEC-RAS included water surface elevations at each cross section, velocity information at distributed points along each cross section, and bounding polygon information. The bounding polygon information defined the extent of each cross section as modeled in HEC-RAS for the given flow. The GIS layers developed were based on the HEC- RAS export file and the terrain (TIN) data. The water surface TIN was generated by intersecting the water surface elevations with the cross section cut lines. Thus, the flood plain polygon was created by intersecting the water surface TIN with the terrain surface. Floodplain delineation and velocity data were developed which adhered to the bounding criterion. HEC- GeoRAS allows selecting multiple water surface profiles and creates a flood plain polygon for each profile. Thus, the Floodplain Delineation polygons were created.
Fig. 2 Water Depth Grid (2005)
D. Conversion from Flow to Inundation Depth
To assess the impacts of the change in flood peak on inundation in a simple study, where detailed flood-plain mapping information is not available, Manning’s equation can be used to get the flood depth. In a uniform reach of river, information on channel width and roughness can be used to convert river flows into river levels using Manning’s equation or a similar approach.
D = [Q n / (W Sf1/2)]3/5Where
1) Q is flow in cubic metres per second
4) n is the Manning roughness coefficient.
Depth of flood = {6392 X 0.041 /(385*0.00025^0.5)}^3/5= 9.67 m, and depth calculated using HEC-GeoRAS is 9.18 m so which is ell agreed with the obtained value at Kurundwad station.
IV. GROUND TRUTH WITH GOOGLE EARTH
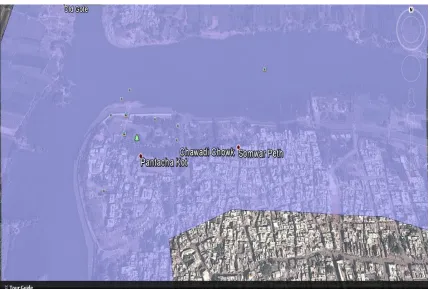
[image:6.612.93.523.219.508.2]For validating the result of floodplain mapping, the themes have been overlaid on Google earth for the key regions. To familiarize with the material and flood mapping that exist within the image boundaries the ground truth information that corresponds with the flood extent can be used to develop qualitative and quantitative relationship between the settlements and affected areas. with consistently vigilant quality the work has been done to capture the photograph displaying flood map and affected area by flood on Google earth which have been depicted in the following figure maps so overlaid compared well the flood extent map generated using GIS.
Fig. 3 Karad Junction on Google Earth Affected Area By Flood
V. RESULTS AND DISCUSSION
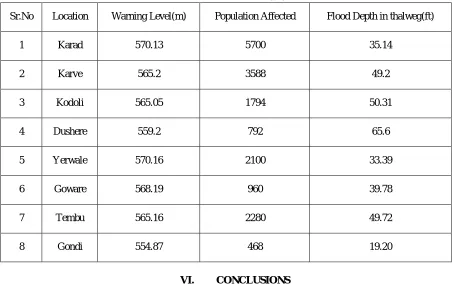
Table 2: Result Table for Flood (July 2005)
Sr.No Location Warning Level(m) Population Affected Flood Depth in thalweg(ft)
1 Karad 570.13 5700 35.14
2 Karve 565.2 3588 49.2
3 Kodoli 565.05 1794 50.31
4 Dushere 559.2 792 65.6
5 Yerwale 570.16 2100 33.39
6 Goware 568.19 960 39.78
7 Tembu 565.16 2280 49.72
8 Gondi 554.87 468 19.20
VI. CONCLUSIONS
An approach for dynamic wave modeling and automated floodplain mapping is presented. The spatial dataset for land use, road network, soil type and land use in points are needed while planning for flood emergency. This information can be used for planning an effective flood emergency response in flood-inundated area of the Krishna Koyana reaches. The flood impact analysis can be used to obtain information about the population, property, and environment at risk during occurrence of flood in a specific area. The velocity varied from 0 m/s to 2.42 m/s in the flooded area and the flood extents .The depth of inundation varied from 0 m to 19.875 m in the flood inundated are as also the flood extent was found to be 35.392 Km2. The water resources department can use GIS in case of flooding to find out which street, school, hospital needs to be evacuated. The GIS can calculate the total number of residents within the area, so as to prepare an effective evacuation plan which can be utilized by different rescue agencies.
REFERENCES
[1] A. Woolhiser, J. A. Liggett, Unsteady, one-dimensional flow over a plane-The rising hydrograph, Water Resources Research, Volume 3, Issue 3, pages 753– 771, September 1967.
[2] HEC-RAS, “Hydraulic Reference Manual,” US Army Corps of Engineers, Hydrologic Engineering Center, Davis Version 4.0, 2008.
[3] D.L Fread, NOAA National weather service of hydrology, Hydrologic research laboratory, “Effect of time step size in Implicit Dynamic Routing”.
[4] D.L Fread ,NOAA National weather service of hydrology, Hydrologic research laboratory,” Numerical Properties of Implicit four-point finite difference equation of unsteady flow”.
[5] Journal of HydrologyVolume 24, Issues 1–2, January 1975, Pages 171–185,”An implicit method to solve Saint Venant equations”.
[6] Journal of HydrologyVolume 122, Issues 1–4, January 1991, Pages 275–287,” Finite-element method for the solution of the Saint Venant equations in an open channel network”
[7] Pradhan, B. & Shafie M. (2009) Flood hazard assessment for cloud prone rainy areas in a typical tropical environment. Disaster Advances, 2 (2), 7-15 [8] Profeti, G., & Machintosh, H. (1997) Flood management though Landsat TM and ERS SAR data: a case study. Hydrological Processes, 11, 1397–1408. [9] Townsend, P. A. and Walsh, S. J.: 1998, Modelling flood plain inundation using integrated GIS with radar and optical remote sensing, Geomorphology 21(98),
295–312.
[10] Troutman, B M and M R Kalinger, (1984), on the expected width function for topologically random channel topologically random channel networks. Journal of Appl Prob., 21:836-849
[11] Verstappen, H. T. (1995) Aerospace technology and natural disaster reduction. In Singh, R. P., and Furrer, R. (editors), Natural Hazards: Monitoring and Assessment using Remote Sensing Technique, Elsevier Science, Inc., New York, 3-15.