Analysis of Speed-Flow Relationship of
Heterogeneous Traffic – A Case Study of
Selected Stretch of Dakor Road
Gunjan R. Trivedi1, Prof. Amit A. Amin2
1,2 M.tech Transportation Engineering (civil), B.V.M. Engineering College, Civil Engineering Dept., B.V.M. Engineering college,
Vallabh Vidyanagar
Abstract - The developing cities have generated the high levels of travel demand by motor vehicles in the cities. This has resulted in changing in nature of traffic characteristics on road network and ultimately it affects the capacity of roadway, level of service on stream and congestion on roadway. Flow and speed are the critical parameters used to describe characteristics of traffic flow. In this paper, the relation between speed and flow has established. The R2 value ranges 0.33 to0.40 which shows poor
relationship between them. Hence it is require to consider several other parameters. Based on v/c ratio found out on selected stretches of Dakor - Maudha road and Dakor - Umreth road, the LOS-D
Is found on Dakor – Umreth road and LOS E on Dakor – Maudha road. Keywords: Traffic flow, speed, capacity, level of service
I. INTRODUCTION
For the growing cities transportation system development is the basic needs for its growth and economy with the same goes with the automobile too because growing city also has a growth of automobile. This has resulted in changing in nature of traffic characteristics on road network and ultimately it affects the capacity of roadway, level of service on stream and congestion on roadway. The basic studies in traffic research is that pertaining to the relationship between speed and volume of traffic. Hence reduce in speed, road accidents, traffic jam, increase in travel time etc. are resulted. Therefore, the analysis of traffic stream parameter is needed to study for the effective planning, design, operation and maintenance of roadway system.
Flow, speed, and density are the critical parameters used to describe characteristics of traffic flow. To understand traffic flow,
relationships have been established between the two main characteristics: flow and velocity. Three parameters plays an important
role that is speed flow and density and to characterize the relationship between them diagram is used. In capacity analysis, speed-flow relation models are used to determine the level of service. Using this level of ser vice existing situation on the r oad can be known.
II. AIM AND OBJECTIVES
The aim of study is to analyze the relation between speed and flow of heterogeneous traffic on selected stretch of Dakor. The objectives of study are as following,
To develop analytical relationship speed and flow.
To determine the congestion, capacity and level of service of selected road stretch under study. To suggest the suitable solution for the observed problem of congestion.
III. NEED OF STUDY
Dakor is a pilgrimage area it is observed that a large amount of trip attraction takes place. The surrounding area comprise of large mining activities, as a result of this major traffic observed at the site are multi axle trucks, resulting into considerable congestion. Hence it is necessary to understand the traffic behavior at the chosen site.
IV. DATA COLLECTION AND ANALYSIS
A. Road inventory survey
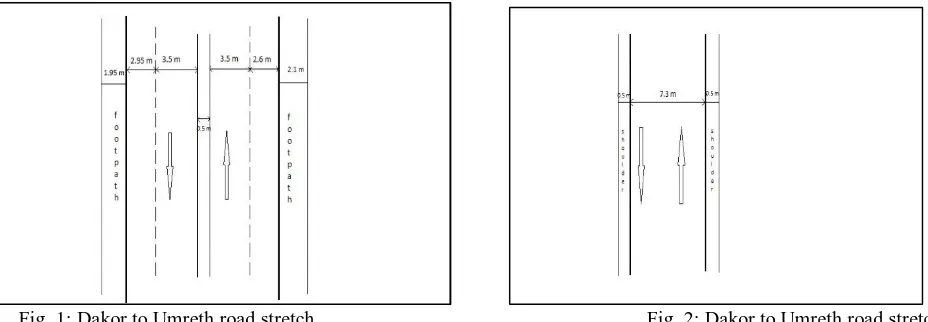
[image:3.612.64.528.125.286.2]The road inventory survey has been done using 30 m measure tape. The road inventory details such as carriageway width, shoulder width, no. of lane are as given in Figure.
Fig. 1: Dakor to Umreth road stretch Fig. 2: Dakor to Umreth road stretch
B. Classified volume count survey
The classified volume count data was collected from two selected stretch of Dakor to Umreth road and Dakor to Maudha road by video recording technique for three days from 9:30 am to 6:30 pm for every 5 minutes time interval at mid-block section. The video camera was fixed in such a manner that each vehicle can identified on entire trap definitely at entry and exit point. The composition of different class of vehicle, traffic flow pattern, peak hour traffic volume is calculated from survey data. The following shows the result.
Fig 3: Traffic composition of Dakor to Umreth road stretch Fig. 4: Traffic composition of Umreth to Dakor road stretch
17%
7%
19% 8%
4% 10% 31%
3.5% 0.5%
composition of traffic (PCU)
2w
3w
car
bus
lcv
truck
multi axle truck
tractor
Fig 5: Traffic composition of Dakor to Maudha road stretch Fig 6: Traffic composition of Maudha to Dakor road stretch
The above traffic composition graph shows that the multi axle vehicle comprise of maximum percent is 31% and 33% on Dakor to Umreth and Umreth to Dakor road respectively. Similarly on Dakor to Maudha and Maudha to Dakor road the multi axle vehicle comprise of maximum percent is 43% and 41% respectively.
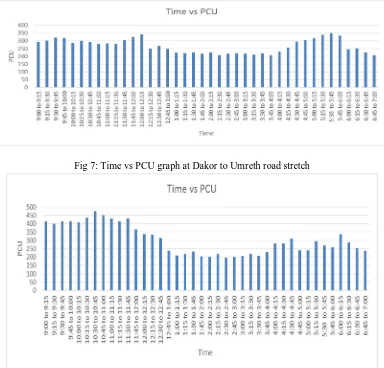
[image:4.612.114.498.340.708.2]Fig 7: Time vs PCU graph at Dakor to Umreth road stretch
Fig 9: Time vs PCU graph at Dakor to Maudha road stretch
Fig 10: Time vs PCU graph at Maudha to Dakor road stretch
Above graph shows that the maximum traffic at Dakor to Umreth road stretch during 11:15 am to 12:15 pm with morning peak traffic volume 1249 PCU/hr and during 5:00 pm to 6:00 pm with evening peak traffic volume 1339 PCU/hr and the maximum traffic at Umreth to Dakor road stretch during 10:30 am to 11:30 am with morning peak traffic volume 1722 PCU/hr and during 5:15 pm to 6:15 pm with evening peak traffic volume 1395 PCU/hr. Same as on second location the maximum traffic at Dakor to Maudha road stretch during 11:15 am to 12:15 pm with morning peak traffic volume 1063 PCU/hr and during 4:45 pm to 5:45 pm with evening peak traffic volume 1101 PCU/hr and the maximum traffic at Maudha to Dakor road stretch during 10:15 am to 11:15 am with morning peak traffic volume 978 PCU/hr and during 4:45 pm to 5:45 pm with evening peak traffic volume 1007 PCU/hr.
C. Spot speed study
Table 1: Spot speed study data on Dakor to Umreth road
[image:6.612.45.574.311.496.2]Table 2: Spot speed study data on Umreth to Dakor road
Table 3: Spot speed study data on Dakor to Maudha road Types of vehicles standard deviation Space mean speed (km/hr) Time mean speed (km/hr) median speed (km/hr) minimum speed (km/hr) maximum speed (km/hr)
2-w 4.77 34.35 34.98 34.19 26.34 45.19
3-w 3.79 27.50 28.02 27.64 20.69 40.91
4-w 5.90 28.57 29.57 26.67 22.27 44.08
Bus 2.66 30.38 30.64 30.17 24.60 37.24
Truck 3.07 26.59 26.98 27.27 21.95 32.14
Multi Axle Truck
4.38 26.33 27.01 25.81 20.69 36.61
LCV 5.84 34.68 35.68 37.89 22.41 43.90
Tractor 2.50 16.19 16.55 16.67 12.46 22.59
Types of vehicles standard deviation Space mean speed (km/hr) Time mean speed (km/hr) median speed (km/hr) minimum speed (km/hr) maximum speed (km/hr)
2-w 5.53 34.64 35.43 34.12 27.14 48.36
3-w 3.77 27.63 28.15 27.69 21.69 39.71
4-w 6.27 28.71 29.79 26.67 24.05 47.37
Bus 2.43 30.37 30.60 30.34 25.00 35.76
Truck 3.30 26.97 27.41 27.27 21.95 33.64
Multi Axle Truck
4.98 26.61 24.45 25.96 20.69 37.37
LCV 5.63 35.22 36.30 37.89 23.08 46.15
Tractor 2.86 16.63 17.04 16.67 14.06 23.53
Types of vehicles standard deviation Space mean speed (km/hr) time mean speed (km/hr) median speed (km/hr) minimum speed (km/hr) maximum speed (km/hr)
2-w 4.94 25.01 25.85 25.17 17014 47.79
3-w 3.18 20.98 21.47 21.09 14.40 32.14
4-w 5.08 24.59 25.55 24.94 16.0 49.54
Bus 3.83 24.06 24.66 24.27 17.76 35.06
Truck 3.70 22.03 22.68 22.86 14.98 35.76
Multi Axle Truck
3.89 19.12 19.84 19.50 14.59 28.88
LCV 3.79 22.28 22.88 22.46 15.47 35.29
[image:6.612.38.575.532.716.2]Table 4: Spot speed study data on Maudha to Dakor road
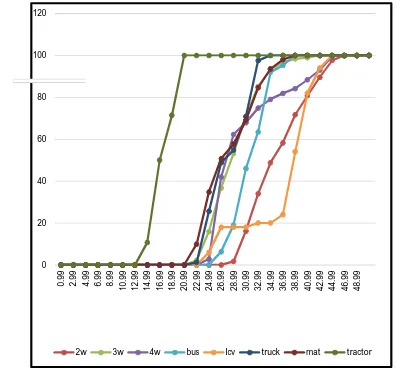
From the above tables, the standard deviation of 2-w and 4-w are greater than other class of vehicles and so their speed is most
affected by mixed traffic. The results of 15th percentile, 50th percentile, 85th percentile and 98th percentile for different class of
vehicle are shown below.
[image:7.612.108.508.325.696.2]
Fig 11: cumulative frequency distribution curve for Umreth to Dakor road Types of vehicles standard deviation Space mean speed (km/hr) time mean speed (km/hr) median speed (km/hr) minimum speed (km/hr) maximum speed (km/hr)
2-w 4.86 25.00 25.83 25.06 17.01 44.08
3-w 3.17 20.97 21.46 21.09 14.44 31.86
4-w 4.95 24.58 25.53 24.94 15.47 43.37
Bus 3.86 23.98 24.60 24.27 17.28 34.29
Truck 3.92 22.08 22.80 22.86 14.40 32.83
Multi Axle Truck
3.87 19.03 19.74 19.12 13.76 29.67
LCV 3.82 22.27 22.89 22.46 15.38 33.96
Tractor 2.47 11.50 11.98 11.63 7.27 17.09
0 20 40 60 80 100 120 0 .9 9 2 .9 9 4 .9 9 6 .9 9 8 .9 9 1 0 .9 9 1 2 .9 9 1 4 .9 9 1 6 .9 9 1 8 .9 9 2 0 .9 9 2 2 .9 9 2 4 .9 9 2 6 .9 9 2 8 .9 9 3 0 .9 9 3 2 .9 9 3 4 .9 9 3 6 .9 9 3 8 .9 9 4 0 .9 9 4 2 .9 9 4 4 .9 9 4 6 .9 9 4 8 .9 9
2w 3w 4w bus lcv truck mat tractor
Fig 12: cumulative frequency distribution curve for Dakor to Umreth road
Fig 13: cumulative frequency distribution curve for Dakor to Maudha road
0 20 40 60 80 100 120 0 .9 9 2 .9 9 4 .9 9 6 .9 9 8 .9 9 10 .9 9 12 .9 9 14 .9 9 16 .9 9 18 .9 9 20 .9 9 22 .9 9 24 .9 9 26 .9 9 28 .9 9 30 .9 9 32 .9 9 34 .9 9 36 .9 9 38 .9 9 40 .9 9 42 .9 9 44 .9 9 46 .9 9 48 .9 9
2w 3w 4w bus lcv truck MAT tractor
0 20 40 60 80 100 120 0 .9 9 2 .9 9 4 .9 9 6 .9 9 8 .9 9 1 0 .9 9 1 2 .9 9 1 4 .9 9 1 6 .9 9 1 8 .9 9 2 0 .9 9 2 2 .9 9 2 4 .9 9 2 6 .9 9 2 8 .9 9 3 0 .9 9 3 2 .9 9 3 4 .9 9 3 6 .9 9 3 8 .9 9 4 0 .9 9 4 2 .9 9 4 4 .9 9 4 6 .9 9 4 8 .9 9
[image:8.612.90.519.298.695.2]Fig 14: cumulative frequency distribution curve for Maudha to Dakor road
Table 5: Percentile speed of Different class of vehicle on Umreth to Dakor road (in kmph)
Table 6: Percentile speed of Different class of vehicle on Dakor to Umreth road (in kmph)
Table 7: Percentile speed of Different class of vehicle on Dakor to Maudha road (in kmph)
Table 8: Percentile speed of Different class of vehicle on Maudha to Dakor road (in kmph)
th th th th
Percentile speed
2w 3w Car bus lcv Truck MAT Tractor
98th 44.08 37.89 43.90 36.86 43.90 32.14 35.88 22.59
85th 40.67 31.83 38.57 33.33 40.15 31.03 32.14 19.15
50th 34.19 27.60 26.67 30.17 37.89 27.27 25.81 16.67
15th 29.83 23.63 25 27.91 25.53 23.13 22.18 14.23
Percentile speed
2w 3w Car bus Lcv Truck MAT Tractor
98th 47.38 37.24 45.38 34.07 44.08 33.23 37.34 23.53
85th 41.96 32.73 38.85 33.64 40.45 31.3 33.64 20.22
50th 34.12 27.69 26.87 30.34 37.79 27.57 25.96 16.77
15th 29.88 23.68 25 27.75 25.73 23.23 22.54 14.67
Percentile speed
2w 3w Car bus lcv Truck MAT Tractor
98th 41.42 30.25 37.37 33.75 31.03 30.59 27.98 17.14
85th 30.51 24.60 30.95 28.42 26.21 26.41 24.66 15
50th 25.17 21.09 24.94 24.27 22.22 22.74 19.50 11.63
15th 21.09 18.15 20.38 20.34 19.60 18.31 17.09 9.89
Percentile speed
2w 3w Car bus lcv Truck MAT Tractor
98th 41.22 30.51 37.37 33.13 31.30 32.24 28.50 17.09
85th 30.68 24.60 31.03 28.62 26.02 26.41 24.44 14.90
50th 25.06 21.12 24.85 24.36 22.12 22.24 19.12 11.43
15th 21.59 18.65 20.85 20.34 19.69 18.42 15.56 9.59
0 20 40 60 80 100 120 0 .9 9 2 .9 9 4 .9 9 6 .9 9 8 .9 9 10 .9 9 12 .9 9 14 .9 9 16 .9 9 18 .9 9 20 .9 9 22 .9 9 24 .9 9 26 .9 9 28 .9 9 30 .9 9 32 .9 9 34 .9 9 36 .9 9 38 .9 9 40 .9 9 42 .9 9 44 .9 9 46 .9 9 48 .9 9
[image:9.612.40.579.504.591.2] [image:9.612.33.579.617.701.2]selected stretch of Dakor to Umreth and Dakor to Maudha road.
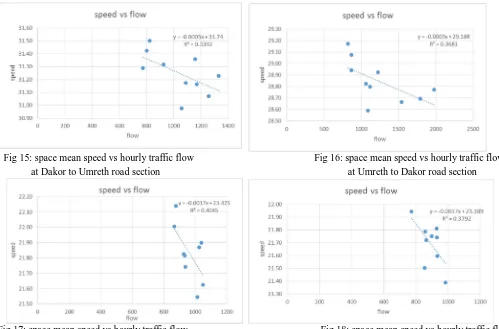
D. Speed-flow relationship
Speed-flow function have been developed by several transportation experts to predict speed on the road network. From the gathered speed and flow data the relationship between speed and flow is observed. The speed-flow graph is plotted with average of space mean speed of all class of vehicle and hourly flow of vehicle in terms of PCU. The results for the Dakor to Umreth road and dark to Maudha road is given below.
The value of R2 is ranges between 0.33 to 0.40 which are lower which means it requires more numbers of observation and more
[image:10.612.52.551.197.526.2]variables to be added for analysis.
Fig 15: space mean speed vs hourly traffic flow Fig 16: space mean speed vs hourly traffic flow at Dakor to Umreth road section at Umreth to Dakor road section
Fig 17: space mean speed vs hourly traffic flow Fig 18: space mean speed vs hourly traffic flow at Dakor to Maudha road section at Maudha to Dakor road section
V. CAPACITY AND LEVEL OF SERVICE
As per IRC: 64-1990 the recommended design service volume for two lane road for plain terrain is 15000 PCU/day. From the traffic volume data the maximum flow is 1339 PCU/hr and 1722 PCU/hr on Dakor to Umreth road and Dakor to Maudha road respectively. By calculating the average v/c ratio of morning and evening peak hour for Dakor to Maudha road section is 0.93 which determines the LOS-E and same LOS is obtain for Maudha to Dakor as its v/c ratio is 0.92. Similarly for Dakor to Umreth the average v/c ratio of morning and evening peak hour is 0.87 indicating LOS D and same LOS is obtain for Umreth to Dakor as its v/c ratio is 0.86.
VI. CONCLUSION
A. After the analyzing the speed and flow rate of traffic on the road stretch it is concluded that present road on which study is
conducted caters very heavy traffic but existing condition of the road is not suitable for such a heavy traffic.
B. On the Dakor to Maudha road and Dakor to Umreth road the R2 value ranges 0.33 to 0.40 which are lesser than 0.5 which
number of lane etc.
C. LOS can be determine using v/c ratio and operating speed of vehicles. Here on Dakor to Maudha road v/c ratio comes to 0.9
and its vehicle speed is comes under the 15 percentile thus it has LOS E while comparatively on Dakor to Umreth road v/c ratio comes to 0.85 and here also vehicles are running with 15 percentile speed thus it comes under LOS D. Looking to the situation of both stretches, road should be widen to increase the capacity and improve the level of service because PCU of Dakor to Maudha road is 1722 pcu/hr while of Dakor to Umreth road is 1339 pcu/hr.
REFERENCES
[1] Ajitha Thankappan, Yamem Tamut and Lelitha Vanajakshi, “Traffic Stream Modeling under Heterogeneous Traffic Condition”, ASCE journal 2010.
[2] Arpan Mehar, Satish Chandra and Velmurugan Senathipathi, “Highway capacity through vissim calibrated for mixed traffic condition”, KSCE journal of Civil Engineering (2014). Pg- 639- 645.
[3] Asish Dhamaniya, Satish Chandra,”Speed characteristics of mixed traffic flow on urban arterials”, International journal of civil, environmental, structural, construction and architectural engineering 2013. Vol:7, pg: 883-888
[4] Amardeep Boora, Indrajit Ghosh and Satish Chandra, “Identification of free flow condition on two lane intercity highways under heterogeneous traffic condition” 27th ARRB conference 2016.
[5] Dipak K. Thakor, Dr. L. B. Zala and Prof. Amit A. Amin, “Traffic flow characteristics for heterogeneous traffic on urban road- a case study of selected stretch of Anand city”, Journal of International Acadamic Research for Multidisciplinary 2014. Vol-2, Pg- 543-550.
[6] Geetam Tiwari, Joseph Fazio, Sushant Gaurav and Niladri Chatteerjee, “Continuity equation validation for non-homogeneous traffic” Journal of Transportation Engineering 2008. Vol-134, Pg-118-127.
[7] Indrajit Ghosh, Satish Chandra and Amardeep Boora, “Operation performance measures for two lane roads: An assessment of methodological alternatives” Elsevier Ltd. Pg-440-448.
[8] Mohammad mardani Nokandeh, Indrajit Ghosh and Satish Chandra, “Determination of passenger car units on two lane intercity highways under heterogeneous traffic conditions” Journal of Transportation Engineering 2015.
[9] Pratha Pratim Dey, Satish Chandra and S. Gangopadhaya, “Speed distribution curve under mixed traffic conditions”, Journal of Transportation Engineering2006, Vol-132, Pg-475-481.
[10]R. S. Dhapudkar, “Analysis and development of traffic stream parameters of heterogeneous traffic at signalized intersection ”, The International Journal of Engineering and Science 2014, Vol-3, Pg-33-39