Article
Utilization of Palm Oil Clinker as Cement
Replacement Material
Jegathish Kanadasan and Hashim Abdul Razak *
Received: 28 July 2015; Accepted: 7 December 2015; Published: 16 December 2015 Academic Editor: Prabir K. Sarker
StrucHMRS Group, Department of Civil Engineering, Faculty of Engineering, University of Malaya, Kuala Lumpur 50603, Malaysia; [email protected]
* Correspondance: [email protected]; Tel.: +60-3-7967-5233; Fax: +60-3-7967-5318
Abstract:The utilization of waste materials from the palm oil industry provides immense benefit to various sectors of the construction industry. Palm oil clinker is a by-product from the processing stages of palm oil goods. Channelling this waste material into the building industry helps to promote sustainability besides overcoming waste disposal problems. Environmental pollution due to inappropriate waste management system can also be drastically reduced. In this study, cement was substituted with palm oil clinker powder as a binder material in self-compacting mortar. The fresh, hardened and microstructure properties were evaluated throughout this study. In addition, sustainability component analysis was also carried out to assess the environmental impact of introducing palm oil clinker powder as a replacement material for cement. It can be inferred that approximately 3.3% of cement production can be saved by substituting palm oil clinker powder with cement. Reducing the utilization of cement through a high substitution level of this waste material will also help to reduce carbon emissions by 52%. A cleaner environment free from pollutants can be created to ensure healthier living. Certain industries may benefit through the inclusion of this waste material as the cost and energy consumption of the product can be minimized.
Keywords:palm oil clinker; palm oil clinker powder; self-compacting mortar; sustainability
1. Introduction
The utilization of waste by-products in concrete has garnered positive outcomes over the past few decades in terms of the cost savings and conservation of natural resources. Some of the resources currently being employed for concrete production are prone to having negative effects on the environment besides being non-renewable. This has resulted in an increase in research to develop alternative feed to reduce and maintain a non-excessive usage of natural sources. The agricultural industry in Malaysia has developed progressively over the past few decades, substantially supporting the economy of the country. The industry has diversified its product output from the basic fresh products up to completely processed goods. Concurrently, a huge amount of waste by-products are also produced during the manufacturing stages which need serious consideration. Eighty million tonnes of dry solid biomass waste was yielded in 2010 by the oil palm industry in Malaysia and is expected to rise up to 85–110 million tonnes by 2020 [1]. In depth research and studies carried out on these waste materials could increase the chances of utilizing or recycling this material again in another industry and thereby reduce the continuous exploitation and conserve the available natural resources for use in future. Around 57 million tonnes of oil was made by Malaysia and Indonesia together by 2012, which makes up 85% of the overall global palm production [2,3]. The palm oil industry in Malaysia plays an integral part of the country’s economic growth. Statistics show that there are 440 fresh fruit bunch (FFB) mills in Malaysia spread throughout Peninsular Malaysia, Sabah
Materials2015,8, 8817–8838
and Sarawak [4]. Figure 1 depicts different types of biomass produced by various industries in Malaysia. Table1tabulates the types of biomass obtained from palm oil mill processing stages and the quantity produced. Malaysian Palm Oil Board (MPOB) [5] reported that 19.22 million tonnes of crude palm oil (CPO) was produced in 2013 in Malaysia which was 2.3% higher than the previous year. Concurrently, the amount of waste biomass generated from the palm oil mill industry is also expected to be increasing proportionally whereby there will be a need for proper waste management system to avoid serious environmental pollution. Sumathiet al.[6] reported that the small oil content within mesocarp fibre (MF) and shell can be utilized as a fuel to produce steam for the mill’s operation. In addition, incineration of shell and fibre in the boiler generates steam which is utilized in CPO production and for some of the electricity for the mill’s consumption [6]. Vijayaet al. [7] reported that, on average, approximately 0.05 tonne of boiler ash is produced for every tonne of CPO when MF and shell are incinerated in the boiler. Thus, taking into account the amount of MF and shell produced annually by oil palm mills, production of boiler ash could be also rising proportionally which increases the need for proper waste disposal and management systems.
Materials 2015, 8, page–page
2
types
of
biomass
produced
by
various
industries
in
Malaysia.
Table
1
tabulates
the
types
of
biomass
obtained
from
palm
oil
mill
processing
stages
and
the
quantity
produced.
Malaysian
Palm
Oil
(MPOB)
[5]
reported
that
19.22
million
tonnes
of
crude
palm
oil
(CPO)
was
produced
in
2013
in
Malaysia
which
was
2.3%
higher
than
the
previous
year.
Concurrently,
the
amount
of
waste
biomass
generated
from
the
palm
oil
mill
industry
is
also
expected
to
be
increasing
proportionally
whereby
there
will
be
a
need
for
proper
waste
management
system
to
avoid
serious
environmental
Sumathi
et
al.
[6]
reported
that
the
small
oil
content
within
mesocarp
fibre
(MF)
and
shell
can
be
utilized
as
a
fuel
to
produce
steam
for
the
mill’s
operation.
In
addition,
incineration
of
shell
and
in
the
boiler
generates
steam
which
is
utilized
in
CPO
production
and
for
some
of
the
electricity
for
the
mill’s
consumption
[6].
Vijaya
et
al.
[7]
reported
that,
on
average,
approximately
0.05
tonne
of
boiler
ash
is
produced
for
every
tonne
of
CPO
when
MF
and
shell
are
incinerated
in
the
boiler.
taking
into
account
the
amount
of
MF
and
shell
produced
annually
by
oil
palm
mills,
production
of
boiler
ash
could
be
also
rising
proportionally
which
increases
the
need
for
proper
waste
disposal
management
systems.
Figure
1.
Biomass
produced
by
different
industries
in
Malaysia
(Adapted
from
Shuit
et
al.
[8]).
Table
1.
Types
of
biomass
and
quantity
produced
(Adapted
from
Sumathi,
Chai
and
Mohamed
[6]).
No.
Type
of
Biomass
Quantity/Annum
(Mt)
1
Empty
fruit
bunch
(EFB)
15.8
2
Fronds
12.9
3
Mesocarp
fibre
(MF)
9.6
4
Trunk
8.2
5
Shell
4.7
Palm
oil
clinker
(POC)
is
a
waste
by
‐
product
gathered
after
the
complete
incineration
process
oil
palm
shell
and
fibre.
Physically
they
are
porous,
grey
in
colour,
irregular
in
shape
and
much
lighter.
Most
of
the
palm
oil
processing
plants
dispose
of
the
clinker
in
them
by
using
them
as
a
cover
for
the
potholes
on
the
roads
within
the
vicinity
of
the
plantation
areas
[7].
Rather
than
utilizing
them
for
some
purpose
that
could
harm
the
environment,
it
would
be
better
and
more
to
channel
them
into
the
construction
industry.
As
POC
aggregate
is
lighter
in
nature,
it
can
be
utilized
for
the
production
of
lightweight
concrete
or
mortar.
This
would
be
a
very
efficient
way
to
avoid
environmental
pollution
besides
benefiting
the
construction
industry
as
an
aggregate
replacement.
Environmentally
friendly
and
highly
energy
efficient
materials
need
to
be
introduced
to
reduce
the
environmental
pollution
arising
from
the
high
carbon
footprint
of
cement
in
its
production
stages.
Substitution
with
environmentally
safer
materials
is
vital
to
ensure
the
concrete
produces
a
lower
emission
factor.
There
are
few
studies
carried
out
on
POC
in
the
past.
A
self
‐
compacting
concrete
using
POC
showed
that
almost
68%
of
the
compressive
strength
can
be
achieved
when
POC
is
replaced
with
natural
aggregates
[9].
Moreover,
studies
performed
by
[image:2.595.147.452.293.513.2]
Figure 1.Biomass produced by different industries in Malaysia (Adapted from Shuitet al.[8]).
Table 1.Types of biomass and quantity produced (Adapted from Sumathi, Chai and Mohamed [6]).
No. Type of Biomass Quantity/Annum (Mt)
1 Empty fruit bunch (EFB) 15.8
2 Fronds 12.9
3 Mesocarp fibre (MF) 9.6
4 Trunk 8.2
5 Shell 4.7
Palm oil clinker (POC) is a waste by-product gathered after the complete incineration process of oil palm shell and fibre. Physically they are porous, grey in colour, irregular in shape and much lighter. Most of the palm oil processing plants dispose of the clinker in them by using them as a cover for the potholes on the roads within the vicinity of the plantation areas [7]. Rather than utilizing them for some purpose that could harm the environment, it would be better and more ideal to channel them into the construction industry. As POC aggregate is lighter in nature, it can be utilized for the production of lightweight concrete or mortar. This would be a very efficient way to avoid environmental pollution besides benefiting the construction industry as an
[image:2.595.152.444.574.649.2]Materials2015,8, 8817–8838
aggregate replacement. Environmentally friendly and highly energy efficient materials need to be introduced to reduce the environmental pollution arising from the high carbon footprint of cement in its production stages. Substitution with environmentally safer materials is vital to ensure the concrete produces a lower emission factor. There are few studies carried out on POC in the past. A self-compacting concrete using POC showed that almost 68% of the compressive strength can be achieved when POC is replaced with natural aggregates [9]. Moreover, studies performed by Kanadasan and Abdul Razak [10] shows that use of POC aggregates produced concrete with “good” category ultrasonic pulse velocity (UPV) values. Incorporation of oil palm boiler clinker in oil palm shell concrete between 0% and 50% managed to lower down the density of the concrete by 21%–27% [11]. Complete replacement of POC as aggregates reduced the weight of concrete by 16% compared to control specimen [12]. A feasibility study performed on POC utilization in construction industry using samples from all states in Malaysia showed that POC specimens can produce structural efficiency in the range of 0.035–0.05 MPa/(kg/m3) which is similar to control specimen [13]. A past study showed that POC only lowered the concrete strength by 13%–31% compared to control specimens [14]. In addition, POC concrete produced satisfactory electrical resistivity values indicating good durability properties [15]. From structural point of view, singly reinforced POC concrete beams which has a reinforcement ratio lower than 0.5% exhibited satisfactory deflection within the acceptable range [16]. Utilization of POC decreased the weight of concrete slabs by 18.3% compared to the normal concrete slabs [17]. Besides that, Mohammed, Al-Ganad and Abdullahi [17] also found from their study that POC slab showed lower structural properties when compared to normal slab as the modulus of elasticity of POC concrete is lower. In a separate study, reinforced POC concrete beam showed similar shear performance as compared to normally reinforced concrete beam [18]. Introducing waste material instead of using other natural resources would be a better way to enhance the sustainability. Considering this situation, POC powder was integrated into the mix proportion to replace cement at various substitution levels, which will lower the emission factor as well as provide an alternative for a proper disposal system. As the amount of natural resources is constant, introducing these by-products ensure their availability to meet future needs.
Recently, the utilization of powder materials in the construction industry has increased. Taking into account the environmental pollution, cement is blended with other waste materials that could improve or enhance the hardened and durability properties. In addition, the cost of the concrete can also be significantly reduced without sacrificing the mechanical performance. Researchers have found that the incorporation of 45% waste concrete powder (WCP) actually increased the sorptivity coefficient by 70% compared to the control [19]. Researchers found that substitution of cement with 30% of municipal solid waste incineration (MSWI) bottom ash has the ability to produce compressive strength of about 38.9 MPa at 28 days which is above the Class 32.5 as specified by Chinese National Standard GB 175-2007 [20]. The incorporation of bamboo leaf ash as a replacement for cement at 10% and 20% produced mortar specimens with a strength loss of 1% and 2.8% compared to that of the control specimens at 28 and 90 days of curing [21]. The addition of class F fly-ash produced lower chloride intrusion results at 90 and 365 days of approximately smaller than 400 and 700 Coulombs, respectively [22]. Researchers have reported that the inclusion of natural pozzolana and marble powder generally showed satisfactory results in terms of the evolution of compressive strength when replaced with cement [23]. Liet al.[24] reported that incorporation of dry composite electroplating sludge (CEPS) in decorative mortar showed comparable compressive strength, flexural strength and tensile bond strength properties with respect to control specimens. Cement mixed with 10% of untreated cement kiln dust (CKD) gave good strength properties but further addition produced lower strength [25]. After 90 days of curing, mortar specimens with 20 µm of ground glass showed 2% higher strength evolution to that of the control mix [26]. Throughout the study, mortar samples with 5% of high calcium wood ash (HCWA) produced higher flexural strength compared to the control concrete [27]. Substitution of 20% waste glass with sand in concrete increased both compressive strength and flexural strength at 28 days by 4.23% and 11.20%, respectively,
Materials2015,8, 8817–8838
above control samples [28]. When finely ground basaltic ash (NP), limestone powder (LP) and ordinary Portland cement (OPC) were used in the ternary blend with a ratio of 55OPC:15LS:30NP, the chloride ingression could be reduced significantly and would decrease the CO2 emissions by
48% [29]. Blending reburnt rice husk ash (RHA) with cement at 30% substitution produced concrete with good reduction in terms of chloride permeation, chloride diffusion and water permeability by about 75%, 28% and 35%, respectively [30]. The replacement of 10% of waste LCD glass powder produced 94%–99% of the compressive strength and 96%–99% of the flexural strength compared to an ordinary Portland cement (OPC) mix [31]. Researchers reported that the compressive strength, flexural strength and splitting tensile strength of lightweight foamed concrete with 10%–20% of palm oil fuel ash (POFA) as filler were higher compared to 100% sand filler lightweight foamed concrete [32]. In addition, incorporation of ground palm oil fuel ash (GPA) for high strength concrete production reduced the water permeability of the concrete which is about half compared to Type 1 Portland cement high strength concrete [33]. It was reported that the use of sugar cane baggase ash (SCBA) managed to reduce the emission of CO2by 519.3 kilotonnes per year [34].
Although studies were carried out on using POC as aggregates in concrete, there is no research work reported till date on using POC powder as a material to supplement cement. Thus, this work would be focused on using POC powder as a replacement material for cement for mortar production. In this study, POC powder was investigated for use as a binder material to replace cement. It was substituted at different levels varying from minimal replacement to maximum replacement to determine the optimum level of replacement. It was obtained by grinding POC into a fine powder form and substituting the cement at different percentages. The replacement levels were maximized at 50% to establish the performance of the specimens subjected to lower cement content. Their fresh and hardened properties tests were evaluated to investigate the effectiveness of POC powder in mortar specimens to replace cement. Several chemical and microstructure tests were carried out to further investigate the characteristics and effects of using POC powder in the mortar specimens. The sustainability aspects of POC powder incorporation was also evaluated both economically and environmentally to understand the positive impacts on the industry and environment. From this study, the effectiveness and feasibility of using POC powder as a replacement material for cement can be obtained. In addition, this research can elevate the sustainability of the construction industry and contribute significantly in respect to replacement binder materials.
2. Experimental Programme
2.1. Material
Figure2 shows the adapted schematic diagram of a typical power house in a palm oil mill. As aforementioned, POC is obtained from the oil palm boiler after the incineration process of oil palm shell and mesocarp fibre. In this study, mortar specimens were prepared to investigate the performance of POC powder. Normal sand with specific gravity 2.60 was utilized as fine aggregate in this study. OPC Type I cement was used as the cementitious material, while POC powder was prepared by grinding POC into a fine powder form. Figure3shows a large piece of POC collected from a palm oil mill, and Figure 4 shows the POC fine. Table 2 shows the chemical properties of the materials used in this study. As observed, the silica (SiO2) content is on the higher side.
Figure 5 shows the particle size distribution curve for the POC powder and cement used in this study. Generally, the POC powder specimens can be considered of similar fineness compared to cement although both have different passing percentages at different size intervals. Table3tabulates the particle size distribution of the cement and POC powder. Figure6shows the morphology for the POC powder specimens obtained through the scanning electron microscopy (SEM) test. As observed from the figure, the shape of the powder particles is very much irregular and angular. Some of them are cuboidal in shape with sharp edges while others are flaky. There is also a possibility that they will have some impact on the self-compactability properties of the mortar specimens. Figure7
Materials2015,8, 8817–8838
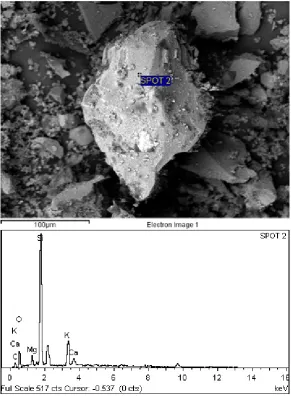
shows the micrograph of only POC powder with electron dispersive X-ray spectroscopy (EDX) on a smaller magnification. As observed, they are also irregular in shape with notable voids or perforated voids. The EDX results confirm the presence of a high amount of silica (SiO2) content within the
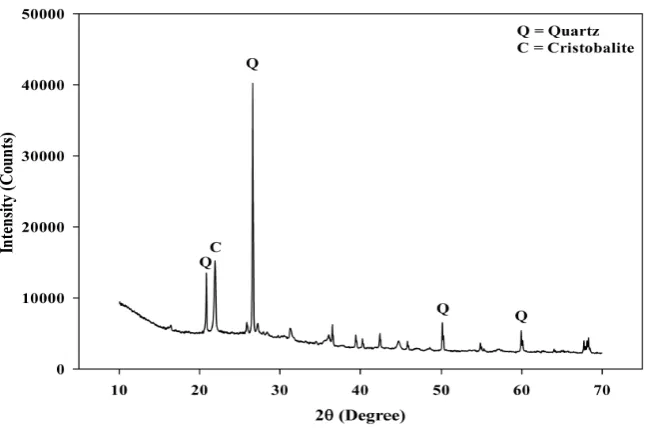
POC particles, as indicated by the X-ray florescence (XRF) results. Figure8shows the POC powder particles at a much smaller magnification with EDX. Despite having irregular and sharp edges, the flat layer surfaces are also evident at the smaller magnification. Figure9shows the peaks obtained from analysis of the POC powder through the X-ray diffraction (XRD) test. Aforementioned in Table2, POC powder is majorly composed of silica (SiO2). As observed from the XRD analysis, it is
obvious that quartz and cristoballite components, a type of silica compound found to be prominent. Significant sharp peaks and higher peaks were observed at 2θof 20.83˝(quartz), 26.61˝(cristoballite),
50.11˝ (quartz) and 59.93˝ (quartz). This could affect the blending properties between the cement
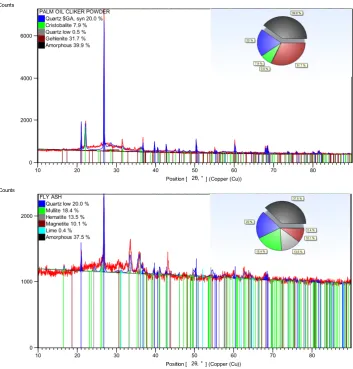
[image:5.595.193.402.312.455.2]and POC powder significantly to produce different fresh, hardened and microstructure properties. Figure10depicts the quantitative XRD results for POC powder and fly ash. It is worth noting that the amorphous content in these two materials is almost similar.
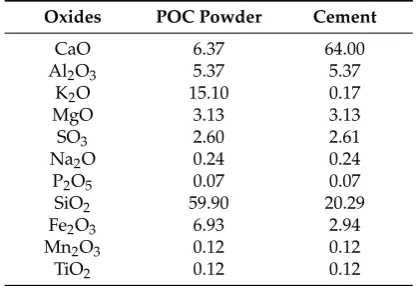
Table 2.Chemical composition of POC powder and cement.
Oxides POC Powder Cement
CaO 6.37 64.00 Al2O3 5.37 5.37
K2O 15.10 0.17
MgO 3.13 3.13
SO3 2.60 2.61 Na2O 0.24 0.24 P2O5 0.07 0.07 SiO2 59.90 20.29 Fe2O3 6.93 2.94 Mn2O3 0.12 0.12 TiO2 0.12 0.12
Table 3.Particle size distribution of cement and POC powder.
Properties Cement POC Powder
Average size, D (v, 0.5) 27.98µm 20.97µm Passing 10.48µm (%) 27.58 37.86 Retained 10.48µm, Passing 48.27µm (%) 45.80 34.05 Retained 48.27µm (%) 26.62 28.09
Materials 2015, 8, page–page
5
(cristoballite),
50.11°
(quartz)
and
59.93°
(quartz).
This
could
affect
the
blending
properties
between
the
cement
and
POC
powder
significantly
to
produce
different
fresh,
hardened
and
microstructure
properties.
Figure
10
depicts
the
quantitative
XRD
results
for
POC
powder
and
fly
ash.
It
is
worth
noting
that
the
amorphous
content
in
these
two
materials
is
almost
similar.
Table 2. Chemical composition of POC powder and cement.
Oxides
POC
Powder
Cement
CaO
6.37
64.00
Al
2O
35.37
5.37
K
2O
15.10
0.17
MgO
3.13
3.13
SO
32.60
2.61
Na
2O
0.24
0.24
P
2O
50.07
0.07
SiO
259.90
20.29
Fe
2O
36.93
2.94
Mn
2O
30.12
0.12
TiO
20.12
0.12
Table 3. Particle size distribution of cement and POC powder.
Properties
Cement
POC
Powder
Average
size,
D
(
v
,
0.5)
27.98
μ
m
20.97
μ
m
Passing
10.48
μ
m
(%)
27.58
37.86
Retained
10.48
μ
m,
Passing
48.27
μ
m
(%)
45.80
34.05
Retained
48.27
μ
m
(%)
26.62
28.09
Figure 2. Schematic diagram of a typical power house in palm oil mill (Adapted from Yusoff [35]).
Figure 3. A large piece of POC collected from palm oil mill.
Figure 2.Schematic diagram of a typical power house in palm oil mill (Adapted from Yusoff [35]).
Materials2015,8, 8817–8838
Materials
2015
,
8
,
page–page
5
(cristoballite),
50.11°
(quartz)
and
59.93°
(quartz).
This
could
affect
the
blending
properties
between
the
cement
and
POC
powder
significantly
to
produce
different
fresh,
hardened
and
microstructure
properties.
Figure
10
depicts
the
quantitative
XRD
results
for
POC
powder
and
fly
ash.
It
is
worth
noting
that
the
amorphous
content
in
these
two
materials
is
almost
similar.
Table
2.
Chemical
composition
of
POC
powder
and
cement.
Oxides
POC
Powder
Cement
CaO
6.37
64.00
Al
2O
35.37
5.37
K
2O
15.10
0.17
MgO
3.13
3.13
SO
32.60
2.61
Na
2O
0.24
0.24
P
2O
50.07
0.07
SiO
259.90
20.29
Fe
2O
36.93
2.94
Mn
2O
30.12
0.12
TiO
20.12
0.12
Table
3.
Particle
size
distribution
of
cement
and
POC
powder.
Properties
Cement
POC
Powder
Average
size,
D
(
v
,
0.5)
27.98
μ
m
20.97
μ
m
Passing
10.48
μ
m
(%)
27.58
37.86
Retained
10.48
μ
m,
Passing
48.27
μ
m
(%)
45.80
34.05
Retained
48.27
μ
m
(%)
26.62
28.09
Figure
2.
Schematic
diagram
of
a
typical
power
house
in
palm
oil
mill
(Adapted
from
Yusoff
[35]).
Figure
3.
A
Figure 3.large
A large piece of POC collected from palm oil mill.piece
of
POC
collected
from
palm
oil
mill.
Materials
2015
,
8
,
page–page
Figure
4.
POC
fine.
Figure
5.
Particle
size
analysis
for
POC
powder
and
cement.
Figure
6.
POC
powder
morphology
obtained
through
SEM
test.
Figure
7.
POC
powder
structure
at
a
smaller
magnification
with
X
‐
ray
spectroscopy
(EDX).
Figure 4.POC fine.
Materials
2015
,
8
,
page–page
6
Figure
4.
POC
fine.
Figure
5.
Particle
size
analysis
for
POC
powder
and
cement.
Figure
6.
POC
powder
morphology
obtained
through
SEM
test.
Figure
7.
POC
powder
structure
at
a
smaller
magnification
with
X
‐
ray
spectroscopy
(EDX).
Figure 5.Particle size analysis for POC powder and cement.
[image:6.595.194.401.90.276.2] [image:6.595.201.393.320.498.2] [image:6.595.151.442.418.723.2]Materials2015,8, 8817–8838
Materials
2015
,
8
,
page–page
6
Figure
4.
POC
fine.
Figure
5.
Particle
size
analysis
for
POC
powder
and
cement.
Figure
6.
POC
powder
morphology
obtained
through
SEM
test.
Figure
7.
POC
powder
structure
at
a
smaller
magnification
with
X
‐
ray
spectroscopy
(EDX).
Figure 6.POC powder morphology obtained through SEM test.
Materials
2015
,
8
,
page–page
6
Figure
4.
POC
fine.
Figure
5.
Particle
size
analysis
for
POC
powder
and
cement.
Figure
6.
POC
powder
morphology
obtained
through
SEM
test.
Figure
7.
POC
powder
Figure 7.structure
POC powder structure at a smaller magnification with X-ray spectroscopy (EDX).at
a
smaller
magnification
with
X
‐
ray
spectroscopy
(EDX).
[image:7.595.153.445.327.724.2]
Materials2015,8, 8817–8838
Materials
2015
,
8
,
page–page
7
Figure
8.
Irregular
shape
of
POC
powder
specimens
with
EDX
results.
Figure
9.
X
‐
ray
diffraction
(XRD)
of
POC
powder.
Figure
10.
Quantitative
XRD
results
for
POC
powder
and
fly
ash.
Position [? Theta] (Copper (Cu))
10 20 30 40 50 60 70 80
Counts
0 2000 4000 6000
PALM OIL CLIKER POWDER Quartz $GA, syn 20.0 % Cristobalite 7.9 % Quartz low 0.5 % Gehlenite 31.7 % Amorphous 39.9 %
2θ, °
Position [? Theta] (Copper (Cu))
10 20 30 40 50 60 70 80
Counts
0 1000 2000
FLY ASH Quartz low 20.0 % Mullite 18.4 % Hematite 13.5 % Magnetite 10.1 % Lime 0.4 % Amorphous 37.5 %
2θ, °
Figure 8.Irregular shape of POC powder specimens with EDX results.
Materials
2015
,
8
,
page–page
7
Figure
8.
Irregular
shape
of
POC
powder
specimens
with
EDX
results.
Figure
9.
X
‐
ray
diffraction
(XRD)
of
POC
powder.
Figure
10.
Quantitative
XRD
results
for
POC
powder
and
fly
ash.
Position [? Theta] (Copper (Cu))
10 20 30 40 50 60 70 80
Counts
0 2000 4000 6000
PALM OIL CLIKER POWDER Quartz $GA, syn 20.0 % Cristobalite 7.9 % Quartz low 0.5 % Gehlenite 31.7 % Amorphous 39.9 %
2θ, °
Position [? Theta] (Copper (Cu))
10 20 30 40 50 60 70 80
Counts
0 1000 2000
FLY ASH Quartz low 20.0 % Mullite 18.4 % Hematite 13.5 % Magnetite 10.1 % Lime 0.4 % Amorphous 37.5 %
2θ, °
Figure 9.X-ray diffraction (XRD) of POC powder.
[image:8.595.136.460.510.725.2]Materials2015,8, 8817–8838
Materials
2015
,
8
,
page–page
7
Figure
8.
Irregular
shape
of
POC
powder
specimens
with
EDX
results.
Figure
9.
X
‐
ray
diffraction
(XRD)
of
POC
powder.
Figure
10.
Quantitative
XRD
results
for
POC
powder
and
fly
ash.
Position [? Theta] (Copper (Cu))
10 20 30 40 50 60 70 80
Counts
0 2000 4000 6000
PALM OIL CLIKER POWDER Quartz $GA, syn 20.0 % Cristobalite 7.9 % Quartz low 0.5 % Gehlenite 31.7 % Amorphous 39.9 %
2θ, °
Position [? Theta] (Copper (Cu))
10 20 30 40 50 60 70 80
Counts
0 1000 2000
FLY ASH Quartz low 20.0 % Mullite 18.4 % Hematite 13.5 % Magnetite 10.1 % Lime 0.4 % Amorphous 37.5 %
2θ, °
Figure 10.Quantitative XRD results for POC powder and fly ash.
2.2. Mix Proportion and Method
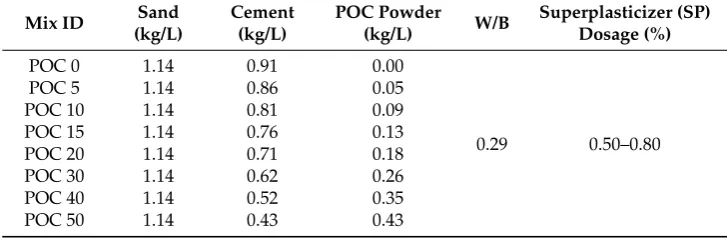
A polycarboxylate superplasticizer (SP) with a density of 1.08 g/L was used in this study. In this study, POC powder was replaced with cement between 0% and 50% by binder weight. The mix proportion is shown in Table4and it can be seen that the total binder for the replacement mixes are different due to the difference in the specific gravity values for cement and POC powder in order to maintain the same mix volume. The dosage of SP was maintained between 0.5% and 0.8% for this study, while the water binder ratio was fixed at 0.29. The fresh self-compacting mortar properties were evaluated through the slump flow test. Hardened properties studies were carried out to establish the compressive strength, flexural behaviour and water absorption test. In addition, ultrasonic pulse velocity (UPV) test were conducted as part of a non-destructive testing. Besides that, microstructure analysis was also carried out on POC powder and mortar specimens. Mortar cubes 50 mm3in size were prepared for compression testing. The test was carried out according to BS EN 12390-3 [36]. Flexural test was performed using a mortar beam of size 40 mmˆ40 mmˆ160 mm. The test was performed according to ASTM C348 [37]. Moreover, the water absorption test was carried out on mortar specimens according to the BS 1881-122 [38]. For each value provided in a graph, a minimum of three specimens were tested to ensure consistent and accurate results were obtained.
[image:9.595.122.476.89.459.2]Materials2015,8, 8817–8838
Table 4.Mix proportion for POC powder self-compacting mortar (SCM).
Mix ID Sand (kg/L)
Cement (kg/L)
POC Powder
(kg/L) W/B
Superplasticizer (SP) Dosage (%)
POC 0 1.14 0.91 0.00
0.29 0.50–0.80 POC 5 1.14 0.86 0.05
POC 10 1.14 0.81 0.09 POC 15 1.14 0.76 0.13 POC 20 1.14 0.71 0.18 POC 30 1.14 0.62 0.26 POC 40 1.14 0.52 0.35 POC 50 1.14 0.43 0.43
3. Results and Discussion
3.1. Fresh Properties
The slump flow test provides an insight into the possible stress that exists from the materials that are utilized for mortar production. Self-compacting mortar was specifically chosen to enhance the flow ability of the mixes besides providing good surface finishing. Besides that, it also allows for greater compaction rate which produces dense concrete structure. Figure11shows the effect on the slump flow of the substitution with POC powder. The mix proportion was designed to ensure that the fresh properties meets a particular range to ensure compliance with the self-compacting mortar specifications [39]. In this study, the mixes were designed to achieve a slump flow of about 250–290 mm, which is vital to satisfy the self-compactability nature.
Materials
2015
,
8
,
page–page
8
2.2.
Mix
Proportion
and
Method
A
polycarboxylate
superplasticizer
(SP)
with
a
density
of
1.08
g/L
was
used
in
this
study.
In
this
study,
POC
powder
was
replaced
with
cement
between
0%
and
50%
by
binder
weight.
The
mix
proportion
is
shown
in
Table
4
and
it
can
be
seen
that
the
total
binder
for
the
replacement
mixes
are
different
due
to
the
difference
in
the
specific
gravity
values
for
cement
and
POC
powder
in
order
to
maintain
the
same
mix
volume.
The
dosage
of
SP
was
maintained
between
0.5%
and
0.8%
for
this
study,
while
the
water
binder
ratio
was
fixed
at
0.29.
The
fresh
self
‐
compacting
mortar
properties
were
evaluated
through
the
slump
flow
test.
Hardened
properties
studies
were
carried
out
to
establish
the
compressive
strength,
flexural
behaviour
and
water
absorption
test.
In
addition,
ultrasonic
pulse
velocity
(UPV)
test
were
conducted
as
part
of
a
non
‐
destructive
testing.
Besides
that,
microstructure
analysis
was
also
carried
out
on
POC
powder
and
mortar
specimens.
Mortar
cubes
50
mm
3in
size
were
prepared
for
compression
testing.
The
test
was
carried
out
according
to
BS
EN
12390
‐
3
[36].
Flexural
test
was
performed
using
a
mortar
beam
of
size
40
mm
×
40
mm
×
160
mm.
The
test
was
performed
according
to
ASTM
C348
[37].
Moreover,
the
water
absorption
test
was
carried
out
on
mortar
specimens
according
to
the
BS
1881
‐
122
[38].
For
each
value
provided
in
a
graph,
a
minimum
of
three
specimens
were
tested
to
ensure
consistent
and
accurate
results
were
obtained.
Table
4.
Mix
proportion
for
POC
powder
self
‐
compacting
mortar
(SCM).
Mix
ID
Sand
(kg/L)
Cement
(kg/L)
POC
Powder
(kg/L)
W/B
Superplasticizer
(SP)
Dosage
(%)
POC
0
1.14
0.91
0.00
0.29
0.50–0.80
POC
5
1.14
0.86
0.05
POC
10
1.14
0.81
0.09
POC
15
1.14
0.76
0.13
POC
20
1.14
0.71
0.18
POC
30
1.14
0.62
0.26
POC
40
1.14
0.52
0.35
POC
50
1.14
0.43
0.43
3.
Results
and
Discussion
3.1.
Fresh
Properties
The
slump
flow
test
provides
an
insight
into
the
possible
stress
that
exists
from
the
materials
that
are
utilized
for
mortar
production.
Self
‐
compacting
mortar
was
specifically
chosen
to
enhance
the
flow
ability
of
the
mixes
besides
providing
good
surface
finishing.
Besides
that,
it
also
allows
for
greater
compaction
rate
which
produces
dense
concrete
structure.
Figure
11
shows
the
effect
on
the
slump
flow
of
the
substitution
with
POC
powder.
The
mix
proportion
was
designed
to
ensure
that
the
fresh
properties
meets
a
particular
range
to
ensure
compliance
with
the
self
‐
compacting
mortar
specifications
[39].
In
this
study,
the
mixes
were
designed
to
achieve
a
slump
flow
of
about
250–290
mm,
which
is
vital
to
satisfy
the
self
‐
compactability
nature.
Figure
Figure 11.11.
Slump
Slump flow results.flow
results.
3.2. Hardened Properties
3.2.1. Compressive Strength
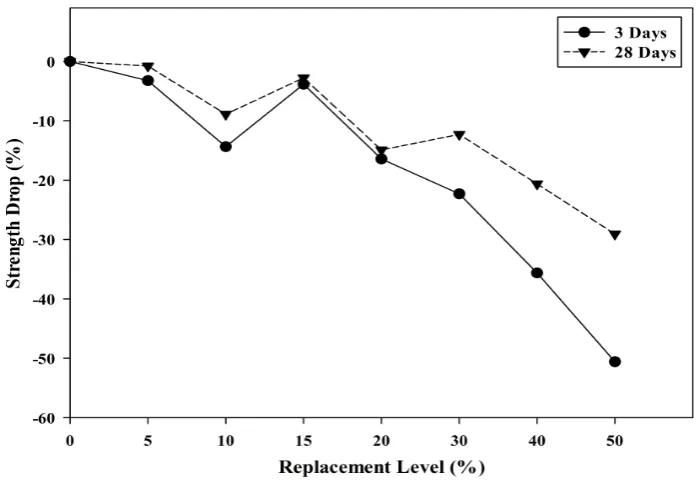
Figure 12 shows the compressive strength results at different POC powder replacement. Comparing the results up to 90 days, the strength attainment for the POC replacement samples at later stages did not exceed the strength of the control specimens. However, it should be noted that the 50% replacement mix gave a strength value of about 70% of the control mix. Figure13depicts the relative compressive strength of POC powder specimens at different replacement levels with a reference study by Hewlett [40] on OPC-pozzolan mortar mixes. It is apparent that the trend of the POC mixes is opposite to the trend compared with the reference mixes. Thus, it supports the
![Figure 1. BiomassFigure 1. Biomass produced by different industries in Malaysia (Adapted from Shuitproduced by different industries in Malaysia (Adapted from et al. Shuit [8]). et al. [8]).](https://thumb-us.123doks.com/thumbv2/123dok_us/8604313.865616/2.595.152.444.574.649/biomassfigure-different-industries-malaysia-shuitproduced-different-industries-malaysia.webp)