28
24RESEARCH IN SECONDARY TEACHER EDUCATION RESEARCH IN SECONDARY TEACHER EDUCATION
Vol.1, No.2. October 2011 pp. 24–28. Q methodology: an overview
Joy Coogan and Neil Herrington University of East London
I
f you have ever wanted to know the ‘points of view’ that are held around a particular topic then one of the methods available for you to uncover these views is Q methodology. This paper gives a very basic overview of the usefulness of Q methodology, the logistics of completing a Q study and some idea of who might be interested in publishing such work. There are detailed books on the topic, but this paper hopes to give a quick overview in order to capture your interest and encourage more use of this methodology. Q methodology combines qualitative and quantitative methods to investigate the subjective views of those directly involved in a particular topic.Keywords: Q Methodology; Qualitative; Quantitative; Subjectivity; Points of View.
Introduction
A quick search of a library database yields a range of papers that have utilised Q methodology. On the face of it, there is little in common between studies looking at the perceptions of place meanings in natural environments (Hutson et al 2010), child/father attachment (John 2010), or the energy options from biomass in the Netherlands (Cuppen 2010). The coherence comes from the conceptual underpinning of these studies, which is manifest in the methodology that they use. This paper gives an overview of the rationale of the methodology, and explains how to use it, drawing on the authors’ experience of using Q in a variety of contexts, particularly work around mathematics education.
Q methodology was devised and developed by William Stephenson in the 1930s (McKeown & Thomas 1988). The development emerged from his desire to bring a scientific framework to bear on the elusiveness of subjectivity. In addressing this he developed a methodology that allows an individual to represent his or her vantage point for purposes of
holding it constant for inspection and comparison. The key to this approach is to consider data in terms of the individual’s whole pattern of responses, a self-reference rather than looking for patterns among people. In effect, people and not tests are the variables.
Q studies explore correlations between persons or whole aspects of persons. In doing this the methodology neither tests its participants nor imposes a priori meanings. Participants are asked to decide what is meaningful and significant from their perspective. They do this through what is known as a Q-sort. From this process an essentially relative set of evaluations is produced. The data from several people are then factorially analysed; this reveals groups of individuals who have ranked characteristics in the same order. According to Watts and Stenner (2005), any given item takes on its significance only in the context of an overall configuration. Being the intended research target, it is these overall configurations (not test results or measures) which are then inter-correlated and factor-analysed in a Q study. This produces a set of factors (onto which participants load on the basis of the configurations that they produce) which are exemplified and represented, not by different subsets of the presented items but by all of the presented items configured in different but characteristic ways. The meaning/significance of these configurations must be attributed a posteriori through interpretation rather than through an a priori postulation.
How to do Q
RESEARCH IN SECONDARY TEACHER EDUCATION RESEARCH IN SECONDARY TEACHER EDUCATION
Vol.1, No.2. October 2011 pp. 24–28. Q methodology: an overview
with regarding the topic. The statements should be compiled from various standpoints and cover as many sub-issues within the topic as possible so that the participants can truly express their views. It is only when the participants are sorting the statements that the statements have any meaning (Watts and Stenner 2005). Statements are generated from the concourse. This means that they will come from interviews with those involved or from the relevant literature or even from requests for statements from those involved, for example children, teachers and parents, in various ways. If the interview method is utilised, it is important that some of the people who will complete the Q-sort be used as the interviewees, to ensure that it is their views that are being addressed. The interview should be audio-tape-recorded and transcribed verbatim. The researcher should then go through the interviews, highlighting possible statements until all possibilities have been exhausted. These should then be subdivided into the various categories of interest – for example, in mathematics the sub-categories may be about nervousness, confidence, ability, etc. Instead of interviewing participants to gain views on a topic or looking at the literature, it is also possible to ask participants for their written comments on the subject. These comments may then be collected on cards, via emails, or taken during a focus group session. These statements can also be hybrid from two or more of the methods just mentioned.
Once all possible statements have been generated, they need to be sorted into categories and sub-categories. The categories are there purely to ensure that all aspects of the topic of interest to the researchers and participants have been covered, and to ensure that the statements do not favour one aspect over another. If there were ten statements about parental influences in the mathematics study and none on the influences of teachers in relation to mathematics education, the resulting Q-sorts might strongly suggest that the participants feel that they are only influenced by their parents. Only by including all possible areas can the researcher attempt to uncover the subjective viewpoints of the participants.
Once the categories have been identified, the statements need to be assessed for duplication, and then one of the duplicated statements is kept while the remainder are discarded. The ambiguity of a statement is not an issue, as participants are expected to give their own meaning to statements. A participant may see one interpretation of what is being said, but another participant may interpret this statement in a different way: ‘maths is wicked’ may be interpreted as mathematics is bad, but to some of today’s children,
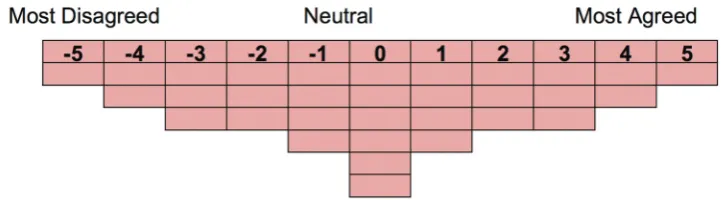
‘maths is wicked’ would be interpreted as mathematics is good. It is necessary to run a pilot study to find out how easy participants find the sorting of statements and their interpretation of the meaning of statements. The statements once generated are sorted by placing them on a Q-grid. Before describing the method of Q-sorting, a description of a Q-grid is shown overleaf.
It is in sorting the statements that the participants’ subjectivity is shown. This is done by giving them the ‘terms of reference’ for sorting, ie most agreed/ disagreed or most like me/least like me, and directing them to select the statements that are most pertinent to their perspective on the subject. The format of the Q-grid means that the statements with the most meaning are placed at the furthermost ends (‘Most Agreed’ and ‘Most Disagreed’) of the Q-grid. The Q-grid has fewer rows at the furthermost ends than it has in the neutral column and the pattern is symmetrical in that if there is one row under the +5 column then there is one row under the –5 column and so on, with the majority of rows falling under the '0' column reflecting the neutral view. Therefore, if a Q-set has 32 statements then the Q-grid may look like the Q-grid shown in Figure 1.
Once the statements are generated, they are then known as the Q-set and are generally placed on cards for participants to sort. In order to help participants in this process, they are encouraged to first form three piles of statements: those agreed with, those disagreed with and those that they feel fairly neutral about.
Starting at one end of the Q-grid, they are asked to select the number of statements required to complete the most extreme column (eg in the Q-grid in Figure 1 they may place the statement ‘maths is fun’ under the +5 column if they agree strongly with this statement).
30
26RESEARCH IN SECONDARY TEACHER EDUCATION RESEARCH IN SECONDARY TEACHER EDUCATION
Vol.1, No.2. October 2011 Q methodology: an overview
This completed Q-sort is then correlated with the other participants’ Q-sorts, then factor-analysed. Once people have ranked these statements, it is then easy to conduct a factor analysis, which shows similar orders of ranking by people.
There is a free program that is available from the Q method page (PQMethod 2.11) which will allow you to run the factor analysis. All the instructions for using the program are available in the manual (also available from the Q method page). The factor analysis will show similarities between participants’ sorting of the statements. The factor analysis considers the holistic picture of the way in which the statements were sorted (ranked) and it is this complete sorting of statements that is analysed. Participants with similar rankings of statements will load significantly on the same factor as each other, revealing a pattern of statements that express their subjective views. Therefore the factor analysis process (as rotated using the PQMethod 2.11 package) will reveal the number of participants that reflect the sorting of statements that are common to each factor. In simple terms, if several people have similar views (having placed their statements in similar positions on the Q-grid) then they will all load on the same factor. Although the computer package rotates the factors, there may be a reason (theoretical or practical) to manually rotate the factors further. This should not be done randomly and only performed when appropriate. An example of when it is appropriate to conduct a manual rotation would be if a study was being conducted in which a manager was participating along with his staff and the researcher wanted to see how the staff’s sorting of their statements related to the way the manager sorted his or her statements.
The PQ Method 2.11 program will then produce an exemplifying Q-sort (one Q-sort that most represents the common ranking of statements from the
participants who loaded on that factor) for each factor. Participants who have some similarities with more than one group of people may not load significantly on any factors. They may have sorted some statements similar to factor one but other statements are not similar to factor one but are similar to factor three. As they correlate equally well on factor one and factor three, they cannot be considered to be reflecting the views of factor one totally, as they also reflect some of the views of factor three. In Q methodology there are no firm rules on how many factors should be extracted from the analysis; however, there are several considerations to be made when making the final decisions. One such consideration is the eigenvalues of each factor loading.
Eigenvalues are used in R methodology when conducting factor analysis to decide the variance extracted from each factor. Eigenvalues are usually reported in Q methodology, although if factors do not reach an eigenvalue level of above 1, these factors are not always discarded. The importance of keeping a factor or discarding a factor is more to do with the coherence of the factor rather than the reported eigenvalue. Eigenvalues can be calculated by multiplying the variance times the number of participants and dividing this by 100.
[image:3.442.39.401.74.174.2]RESEARCH IN SECONDARY TEACHER EDUCATION RESEARCH IN SECONDARY TEACHER EDUCATION
Vol.1, No.2. October 2011 Q methodology: an overview
should be taken before a final decision is made on the number of factors to be accepted. One of these considerations is whether there are distinguishing statements for all the significant factors.
A distinguishing statement is found on factors when the participants who loaded on that factor have placed a statement (eg statement one, I like mathematics) in a position, ‘most agreed’, that is significantly different to where all the participants who have loaded on the other factors have placed that particular statement. An example could be that statement one, ‘I like mathematics’, was placed under the +5 column by the participants who loaded on factor 1, but was placed under the –5, –4 and –1 columns by the participants who loaded on factors 2, 3 and 4 respectively. This shows that those participants who loaded on factor 1 liked mathematics much more than those who loaded on the other three factors. These statements then help to define the factor. The significance of these statements needs to be at least at the <.05 level although some may even be at the <.01 level.
Therefore, it is the overall pattern of where the statements are placed that fully defines the factor, and the distinguishing statements may help in the overall definition by demonstrating a subtle difference between two or more factors. An example could be where the participants who loaded on two factors (eg factor 1 and factor 2) both show a liking for mathematics, but one factor’s participants felt anxious about their performance when conducting mathematical calculations (factor 1) whereas the other participants did not (factor 2). The distinguishing statements help to emphasise this difference, while the full picture from the complete pattern of statement sorting defines the factor. Another consideration when deciding on the number of factors extracted is how many participants load on the differing number of factors.
Generally the higher the number of factors extracted from a study the lower the number of participants who will significantly load on these factors. Participants will only significantly load on a factor if their pattern of statements is (as a whole) different from the other patterns of statements shown by the participants who loaded on the other factors. The more factors there are, the more possibility there is of part of the pattern of an individual’s sorting of the statements being similar to another factor. The number of factors extracted from the data is based on a decision made by the researcher, which is based on an evaluation of eigenvalues, distinguishing statements and number of participants loading on all factors.
As well as looking at the statements that distinguish one factor from another, Q methodology considers the statements that have consensus. It is just as enlightening to discover the statements that people have agreement on, as this tells you that there are areas of your topic that people do agree on. They may agree positively, negatively or be neutral about the issue. Sometimes there will be no consensus statements.
Q methodology allows the participants to give a view that reflects their subjectivity. No other methods capture the essence of what the participants feel about a topic from collective voices, while at the same time identifying subtle differences between some of these voices. You can also do your Q study online and you would still generate your statements in the same way and run your analysis the same; the only difference is in the delivery of your Q statements. Many people have created their own online programs that try to map the paper version, but often they are limited in the number of statements that they can use, because of the size of the screen. However, there is an online version that is freely available, that does not restrict the number of statements. This application is the WebQ program which can be found on the Q method page (just type Q method page into Google). You enter your statements into the program and show how many statements are to be placed in each column (in the same way you design your Q grid manually) and the program will then present them to your participants in a linear fashion. It will look different to your participants than the usual Q grid, but they will be sorting the statements in the same way.
Supporting Q
RESEARCH IN SECONDARY TEACHER EDUCATION RESEARCH IN SECONDARY TEACHER EDUCATION
Vol.1, No.2. October 2011 Vol.1, No.2. October 2011 pp. 29–31.
Who publishes Q studies?
There is a continuing growth of Q researchers, which means that there is a continuing growth of Q publications. In a recent database search of Q articles it was found that the number of publications in the last 20 years was 335, of which 196 were in the last five years (58%). Of these publications from the last five years, 161 were peer-reviewed articles and 65 of those articles had been cited. It would seem that the publications most likely to take Q studies are the ones that take a mixture of qualitative and quantitative studies. In terms of education journals, some of the ones that have published Q studies are Educational Management Administration & Leadership, Topics in Early Childhood Special Education, the Journal of Early Childhood Teacher Education and Educational Studies. However, the main journal that publishes Q papers is Operant Subjectivity;:, The International Journal of Q Methodology and this is not picked up on the University of East London (UEL) database. This journal is the main publication of the International Society for the Scientific Study of Subjectivity (ISSSS). The ISSSS has been publishing articles since its start in 1977, publishes between one and four volumes each year and is peer reviewed.
Conclusion
Q methodology offers an innovative approach to qualitative analysis through a ‘quantification of patterned subjectivities’ (Shemmings 2006, p147). While the mathematical complexity of the underlying analysis is clear, the operation of the methodology does not require any in-depth mathematical knowledge in order to develop interpretations of the data obtained through the Q sort. Therefore if you want to know what ‘points of view’ exist on a particular topic, then use Q
methodology, as this allows for the subtle differences to be highlighted as well as the major differences to be seen.
References Cuppen, E (2010)
‘Q methodology to select participants for a stakeholder dialogue on energy options from biomass in the Netherlands’.
Ecological Economics, 69(3), p579-591
Hutson, G., Montgomery, D.,and Caneday, L. l. (2010),
‘Perceptions of outdoor recreation professionals towards place meanings in natural environments: a Q-method inquiry’.
Journal of Leisure Research, 42(3), pp 417-442
John, A (2010),
‘Q methodology to assess child-father attachment’. Early Child Development & Care, 180 (1/2), pp71-85
McKeown and Thomas, (1988). Q Methodology. Sage Newbury Park Ca
Shemmings (2006).
‘Quantifying qualitative data: an illustrative example of the use of Q methodology in psychosocial research’. Qualitative Research in Psychology, 3(2): pp147-165
Watts, S. and Stenner, P. (2005)
'Doing Q methodology'. Qualitative Research in Psychology, 2, pp. 67-91.
Contact: Email: [email protected] [email protected]
Appendix A
An Example of a Completed Q sort