A
n
E
x p l o r a t io n
O
f
N
u p t ia l it y
P
a t t e r n s
I
n
E
g y p t
A
n d
T
h e
M
a g h r e b
C
o u n t r ie s
A thesis submitted to the University o f London for the degree o f Doctor
o f Philosophy
Shereen Ahmed Hussein
Population Studies Unit, Department of Social Policy
London School of Economics and Political Science
University of London
UMI Number: U615259
All rights reserved
INFORMATION TO ALL USERS
The quality of this reproduction is dependent upon the quality of the copy submitted. In the unlikely event that the author did not send a complete manuscript and there are missing pages, these will be noted. Also, if material had to be removed,
a note will indicate the deletion.
Dissertation Publishing
UMI U615259
Published by ProQuest LLC 2014. Copyright in the Dissertation held by the Author. Microform Edition © ProQuest LLC.
All rights reserved. This work is protected against unauthorized copying under Title 17, United States Code.
ProQuest LLC
789 East Eisenhower Parkway P.O. Box 1346
A
bstr a c t
This research studies the nuptiality patterns in Egypt and the Maghreb countries of
Algeria, Morocco, and Tunisia. Despite the importance o f nuptiality as a demographic
component, it is considerably under studied when compared to fertility, or mortality,
particularly in the Arab region. Nuptiality studies in the Arab region are very sparse
and marital status is usually analysed in terms o f education and age without looking at
other potential explanatory variables and interactions. In general, education and
employment experiences can enhance autonomy and self-recognition, which in turn
change people's expectations and prospective gains from marriage. However, the
effect o f both education and employment on marriage decisions is rather complex and
does not usually follow the expected pattern in all the countries in the region. For
example, the persistence of the kinship system, in many countries in the region, which
benefits arranged marriage can well limit the role of education and employment on
marriage. Such observations invited the elaboration o f an analytical framework that takes
into account the relationships between different factors that can interact and affect
nuptiality.
Both the Demographic and Health Surveys (DHS) and Pan Arab Project surveys
(PAPCHILD) provide national information on some o f marriage aspects in the four
countries. The data used come from the Egypt DHS 1995, Morocco DHS 1992,
Tunisia DHS 1988, and Algeria PAPCHILD 1993. The available data are used to
study the nuptiality patterns in the four countries and draw comparisons between them
in the light o f the proposed fame-work. In addition to the standard DHS
questionnaires, the Egypt DHS 1995 includes a women’s status module, which
provides richer information on the marriage and husband selection process as well as
indicators o f post marital inter-spousal dynamics. Such information is used to perform
an in-depth analysis o f nuptiality patterns in Egypt and to study the relationship
between the intermediate variables and characteristics o f the marriage, as well as with
A
c k n o w l e d g e m e n t
My sincere gratitude goes to the Ford Foundation in collaboration with the Social
Research Centre, American University in Cairo, and the Population Council, New
York, who had partially funded my Ph.D. The Ford Foundation in collaboration with
the Social Research Centre, American University in Cairo had partially funded my
first year o f the Ph.D. The Population Council, New York, through a writing-up
fellowship, had funded my third year of the Ph.D.
Ample o f thanks are for my supervisor Professor John Hobcraft for his essential and
most valued support, corrections and mentoring through out my Ph.D. studies. Also
for his understanding and support during the period o f my studies.
My special thanks and appreciation go to: Professor Hoda Rashad, Social Research
Centre, American University in Cairo, for pointing me to the right directions and for
her continuous guidance; Professor John Casterline, Population Council, New York,
for his generous interest in my work; Dr. Oona Campbell, London School o f Hygiene
and Tropical Medicine, and Dr. Jocelyn Dejong, Ford Foundation in Cairo, for their
trust and most valued support.
My deepest gratefulness and thanks are for my loving husband, Mohamed Ismail, for
his endless support and backing through out my studies and before. Who had with his
devoted care and love enabled me to pursue my ambitions and hope. My thanks and
love go to my three little boys, Omar, 6 years, Yusuf, 2 years, and Yaseen, 2 months,
who had given me a very special and unique taste and meaning o f life and
achievements. I also want to thank my parents who had initially given me many
T
a ble
o f
C
o n t e n t s
Abstract...2
[image:6.595.65.469.155.710.2]Acknowledgement...3
Table o f Contents...4
Chapter I: Introduction...15
1.1 MARRIAGE AND THE ARAB REG ION...15
12 THESIS DESCRIPTION...17
1.3 A N OVERVIEW OF NUPTIALITY PATTERNS IN THE ARAB REGION 19 1.3.1 Prevalence o f Marriage...20
1.3.2 Timing o f M arriage...21
1.3.3 Inter-Spousal Age G ap...30
1.3.4 Polygyny...30
1.3.5 Marital Stability...32
1.3.6 Conclusion...34
1.4 APPENDIX...36
Chapter II: Conceptual Framework...40
11.1 INTRODUCTION....40
II. 2 NUPTIALITY ELEMENTS...40
II. 2.1 Marriage Characteristics...41
11.3 PRIOR VARIABLES... 46
11.3.1 MACRO LEVEL VARIABLES...46
11.3.2 MICRO LEVEL VARIABLES...53
IL4 INTERMEDIATE VARIABLES...57
II. 4.1 Cost o f Marriage...57
11.4.2 Norms o f Marriage...58
II. 4.3 Partner Selectivity and Availability o f M ates...59
II. 5 CONCLUSION... 60
CHAPTER III: METHODOLOGY REVIEW... 64
III.1 MEASURES OF LOCATION OF MARRIAGE... 64
III. 1.1 Mean Age at Marriage...64
III 1.2 Median Age at First Marriage...65
III. 1.3 The Singulate Mean Age at Marriage SMAM....65
III. 1.4 Van de Walle Estimator...67
IH.2 MEASURING TRENDS IN NUPTIALITY...67
111.3 LIFE TABLE ANALYSIS... 68
111.4 PROPORTIONAL HAZARDS LIFE TABLE... 70
111.5 PROPORTIONAL HAZARDS MODELS FOR CURRENT-STATUS DATA ...72
III. 5.1 Parametric Regression Models fo r Continuous-Survival Data Adopted to Current-Status Data...73
III. 5.2 Likelihood fo r Current-Status Data...74
111.6 NUPTIALITY M ODELS... 74
III. 7 THE MARRIAGE-MARKET APPROACH... 75
m .8 ASSESSMENT OF DATA QUALITY... 76
III. 8.1 Age Misstatement...76
CH APTER IV : ASSESSMENT OF QUALITY O F NUPTIALITY DATA 80
IV. 1 AGE REPORTING IN THE INDIVIDUAL INTERVIEW... 80
IV. 1.1 Reported Age vs. Imputed A g e...81
IV. 1.2 Digit Preference...83
IV. 1.3 Five-Year Age Group Distortions...84
IV.2 DATE OF FIRST MARRIAGE...87
IV.2.1 Completeness o f Information...87
IV.2.2 Heaping on Age at First Marriage...89
IV. 2.3 Trends in the Median Age at First Marriage...90
IV.2.4 Proportion o f Ever-Married Women at Ages 15-19 and 20-24...93
IV.3 CONCLUSION...95
CH APTER V : MARRIAGE PATTERNS IN TH E MAGHREB COUNTRIES 97 V .l INTRODUCTION...97
V. 1.1 Population...97
V.l.2 Poverty and The Status o f Women...98
V.l.3 Laws Governing Marriage and Family Formation...100
V.l.4 Demographic and Health Profile...101
V.2 DATA...105
V.3 PREVALENCE OF MARRIAGE...106
V.4 MARRIAGE STABILITY... 109
V.4.1 Differentials in Marriage Dissolution...116
V.5 MARRIAGE CHARACTERISTICS...122
V. 5.1 Polygyny...122
V.5.2 Consanguinity...129
V.5.3 Inter-Spousal Age-Gap...137
V.5.4 Inter-Spousal Educational-Gap...141
V.6 TIMING OF MARRIAGE... 144
V. 6.1 Determinants o f Timing at First Marriage...149
V .l CONCLUSION... 157
V.8 APPENDIX...162
CH APTER V I : MARRIAGE PATTERNS IN E G Y P T ... 183
VI. 1 BACKGROUND... 183
VI. 1.1 Geography and Population...183
VI. 1.2 Regional Variations in Development indices...184
VI. 1.3 Socio-Economic Conditions o f Women in E gypt...186
VI. 1.4 Family Formation in Egypt...186
VI.2 DATA AND VARIABLES DESCRIPTION...187
VI.3 PREVALENCE OF MARRIAGE...189
VIA TIMING OF M ARRIAGE... 191
VI. 4.1 Differentials in the Probability o f Getting Married at Younger and Older Ages...196
VI.5 MARRIAGE CHARACTERISTICS... 206
VI. 5.1 Inter-Spousal Age Gap...206
VI. 5.2 Inter-spousal Educational Gap...209
VI. 5.3 Consanguinity...212
VI. 5.4 Polygyny...216
VI.6 MARRIAGE STABILITY... 217
CHAPTER V I I : AN IN-DEPTH ANALYSIS OF NUPTIALITY PATTERNS IN
EGYPT... 223
VII.l DATA AND VARIABLES DESCRIPTION... 223
VII.2 HUSBANDS’ SELECTION PROCESS...226
VII.2.1 Association Between Prior variables and Husband Selection Process. 232 VII.3 CO-RESIDENCE AT BEGINNING OF MARRIAGE... 236
VII. 3.1 Association Between Prior Variables and Co-Residence at Beginning o f M arriage...239
VII. 3.2 Relation Between Involvement in Husband Selection and Co-Residence at Beginning o f Marriage...240
Vn.4 RELATION BETWEEN INVOLVEMENT IN HUSBANDS’ SELECTION AND POST-MARITAL INTER-SPOUSAL RELATIONS... 244
VII.4.1 First Step in the Analysis...247
VII. 4.2 Second Step in the Analysis...249
VII.5 RELATION BETWEEN INVOLVEMENT IN HUSBANDS’ SELECTION PROCESS AND SOME MARRIAGE ELEMENTS... 256
VII. 5.1 First Marriage Ending in Divorce...256
VII. 5.2 Inter-Spousal Age-Gap...260
VE.6 CONCLUSION...271
Choosing... 276
Vn.7 APPENDIX...278
CHAPTER VIII: CONCLUSION...282
VIII. 1 SUMMARY OF THE RESULTS... 282
Vin.2 INTERPRETATION OF THE RESULTS... 283
Vin.3 INTERPRETATION OF EGYPT IN-DEPTH ANALYSES...289
Vin.4 AREAS OF FURTHER RESEARCH...292
LIST OF TABLES
Table i.3.1 Percentage of ever-married women at different age groups for some o f the Arab countries at different points o f tim e... 23 Table i.3.2 Median ages at first marriage for women age 25-49 at time o f survey for
some Arab countries...24 Table i.3.3 Median ages at first marriage for age cohorts o f women in some Arab
countries at most recent points of tim e... 26 Table i.3.4 Singulate mean age at first marriage by sex for some Arab countries at
different points of time... 29 Table i.3.5 Percentage o f currently married women in polygynous unions at time o f
survey in some Arab countries at different points of tim e...31 Table i.3.6 Percentage o f Muslim men married in polygynous unions in some Arab
countries at different censuses’ points o f time...32 Table i.3.7 Percentage of ever-married women 15-49 still in their first marriage, by
duration since first marriage in years, in some Arab countries... 33 Table i.3.8 Percentage o f ever-married women 15-49 married more than once, by
place of residence and level of education for some Arab countries...33 Table i.4.1 Proportion of women never-married for different age groups in some Latin American countries, DHS surveys...36 Table i.4.2 Median age at first marriage for women 20-49 by age groups, for some
Latin American countries, Demographic and Health surveys... 36 Table i.4.3 Proportion o f women never-married for different age groups in some
Asian developing countries, DHS surveys... 37 Table i.4.4 Median age at first marriage for women 20-49 by age groups, for some
Asian developing countries, Demographic and Health surveys... 37 Table i.4.5 Proportion of women never-married for different age groups in some
Sub-Saharan countries, DHS surveys...38 Table i.4.6 Median age at first marriage for women 20-49 by age groups, for some
Sub-Saharan African countries, Demographic and Health surveys...39 Table iv.1.1 Percent distribution o f ever-married women by completeness of
information on date o f birth by age groups for some Arab countries and different
surveys... 82
Table iv.1.2 An example Myers’ index calculation for Egypt DHS 1995...83 Table iv.1.3 Percent distribution of women 20-49 by reported terminal digit o f age
and Myers index... 83 Table iv.l .4 Percent distribution o f women by five-year age group reconstructed from
the individual questionnaires... 84 Table iv .l.5 Age ratios for five-year age group and age group distortion indices,
individual questionnaires... 87 Table iv.2.1 Percent distribution of ever-married women by completeness of
information on date o f first marriage...88 Table iv.2.2 Indices o f heaping on year of first marriage and on duration since first
marriage ending in digits 0 or 5 ... 89 Table iv.2.3 Median age at first marriage for cohorts o f w om en...90 Table iv.2.4 Percentage o f ever married women at age 15-19 and 20-24 for selected
Table v .l.2 Some Demographic and Health indicators by regions in the three Maghreb countries, Algeria PAPCHILD 1993, Morocco DHS 1992 and Tunisia DHS 1988 ...104 Table v.3.1 Percent distribution of women by current marital status, according to age,
Algeria PAPCHILD 1992, Morocco DHS 1992 and Tunisia DHS 1988...108 Table v.4.1 Distribution o f women who had their first marriage dissolved and
percentage remarried for the three Maghreb Countries according to different background variables...113 Table v.4.2 Analysis o f the deviances for dissolution o f first marriage, in Tunisia DHS 1988... 118 Table v.4.3 Results of the current-status model for differentials in marriage
dissolution, Tunisia DHS 1988... 119 Table v.4.4 Analysis o f the deviances for dissolution o f first marriage, in Algeria
PAPCHILD 1993... 119 Table v.4.5 Results of the current-status model for differentials in marriage
dissolution, Algeria PAPCHILD 1993 ... 120 Table v.4.6 Analysis o f the deviances for dissolution due to divorce o f first marriage,
Morocco DHS 1992...121 Table v.4.7 Best Model for variation in dissolution o f first marriage due to divorce,
Morocco DHS 1992...121 Table v.4.8 Analysis o f the deviances for dissolution due to widowhood o f first
marriage, Morocco DHS 1992... 122 Table v.5.1: Percentage o f currently married women in Polygynous unions by
duration since first marriage and women’s background characteristics, Algeria PAPCHILD 1993... 124 Table v.5.2: Percentage of currently married women in Polygynous unions by
duration since first marriage and women’s background characteristics, Morocco DHS 1992...125 Table v.5.3 Logistic regression result for variables associated with polygyny, Algeria
PAPCHILD 1993 and Morocco DHS 1992...128 Table v.5.4 Prevalence o f consanguinity in the three Maghreb countries according to
background characteristics... 131 Table v.5.5 Results, Odds Ratios, o f the logistic regression model to study
differentials in consanguinity, Algeria PAPCHILD 1993...134 Table v.5.6 Results, Odds Ratios, o f the logistic regression model to study
differentials in consanguinity, Morocco DHS 1992... 135 Table v.5.7 Results, Odds Ratios, o f the logistic regression model to study
differentials in consanguinity, Tunisia DHS 1988... 136 Table v.5.8 Distribution o f ever-married women by age-gap with their current, last,
husbands according to some background characteristics, Algeria PAPCHILD 1993... 138 Table v.5.9 Results o f Multinomial regression model to study probability of having
different age gaps according to some background variables, Algeria PAPCHILD 1993... 140 Table v.5.10 Distribution o f ever-married women by their education level according
to their current, last, husbands’ educational level, Maghreb countries...141 Table v.5.11 Distribution of ever-married women according to inter-spousal
educational-gap in the three Maghreb countries...142 Table v.6.1 Percentage o f women who were first married by exact ages according to
Table v.6.2 Median age at first marriage among women age 25-49 years, by current age and selected background characteristics, Algeria PAPCHILD 1993...147 Table v.6.3 Median age at first marriage among women age 25-49 years, by current
age and selected background characteristics, Morocco DHS 1992... 148 Table v.6.4 Median age at first marriage among women age 25-49 years, by current
age and selected background characteristics, Tunisia DHS 1988... 148 Table v.6.5 Description o f the logistic regression models performed to study the
probability of getting married at different age groups...151 Table v.6.6 Summary of results o f the series o f Cox-regression models studying
timing of marriage in the Maghreb countries... 151 Table v.7.1 Some marriage indicators for the three Maghreb countries according to
region... 161 Table v.8.1 Percentage of women who had ended their first marriage in divorce or
widowhood and the percentage o f those remarried following divorce or
widowhood according to some background characteristics, Morocco DHS 1992 162 Table v.8.2 Distribution of all women age 15-49 by whether married or not and age at first marriage according to some background characteristics, Algeria PAPCHILD 1993... 163 Table v.8.3 Distribution o f all women age 15-49 by whether married or not and age at first marriage according to some background characteristics, Morocco DHS 1992 ...164 Table v.8.4 Distribution o f all women age 15-49 by whether married or not and age at first marriage according to some background characteristics, Tunisia DHS 1988
...165 Table v.8.5 Distribution o f ever-married women according to inter-spousal
educational-gap and some background characteristics, Algeria PAPCHILD 1993 166 Table v.8.6 Distribution o f ever-married women according to inter-spousal
educational-gap and some background characteristics, Morocco DHS 1992... 167 Table v.8.7 Distribution o f ever-married women according to inter-spousal
educational-gap and some background characteristics, Tunisia DHS 1988...168 Table v.8.8 Results o f the first conditional Cox regression model to study the
probability o f women to get married at age less than 16 years against age 16 or more or never married among all women, Algeria PAPCHILD 1993...169 Table v.8.9 Results o f the second conditional Cox regression models to study the
probability of women to get married at age 16-19 years against age 20 or more or never married among all women, Algeria PAPCHILD 1993...170 Table v.8.10 Results of third conditional Cox regression model to study the
probability of women to get married at age 20-21 years against age 22 or more or never married among all women, Algeria PAPCHILD 1993...171 Table v.8.11 Results of the fourth conditional Cox regression model to study the
probability o f women to get married at age 22-24 years against age 25 or more or never married among all women, Algeria PAPCHILD 1993...172 Table v.8.12 Results o f the fifth conditional Cox regression model to study the
probability o f women to get married at age 25 years or more against never
married among all women, Algeria PAPCHILD 1993 ... 173 Table v.8.13 Results of the first conditional Cox regression model to study the
Table v.8.14 Results o f the second conditional Cox regression models to study the probability of women to get married at age 16-19 years against age 20 or more or never married among all women, Morocco DHS 1992... 175 Table v.8.15 Results of third conditional Cox regression model to study the
probability o f women to get married at age 20-21 years against age 22 or more or never married among all women, Morocco DHS 1992... 176 Table v.8.16 Results of the fourth conditional Cox regression model to study the
probability o f women to get married at age 22-24 years against age 25 or more or never married among all women, Morocco DHS 1991... 177 Table v.8.17 Results of the fifth conditional Cox regression model to study the
probability o f women to get married at age 25 years or more against never
married among all women, Morocco DHS 1992... 178 Table v.8.18 Results o f the first conditional Cox regression model to study the
probability o f women to get married at age less than 16 years against age 16 or more or never married among all women, Tunisia DHS 1988... 179 Table v.8.19 Results o f the second conditional Cox regression models to study the
probability of women to get married at age 16-19 years against age 20 or more or never married among all women, Tunisia DHS 1988... 180 Table v.8.20 Results o f third conditional Cox regression model to study the
probability of women to get married at age 20-21 years against age 22 or more or never married among all women, Tunisia DHS 1988... 181 Table v.8.21 Results o f the fourth conditional Cox regression model to study the
probability of women to get married at age 22-24 years against age 25 or more or never married among all women, Tunisia DHS 1988... 181 Table v.8.22 Results of the fifth conditional Cox regression model to study the
probability o f women to get married at age 25 years or more against never
married among all women, Tunisia DHS 1988... 182
Table vi.1.1 Percentage o f poor and ultra poor in Egypt in 1995/96 by region 185
Table vi.1.2 Some health and demographic indices in Egypt by region... 185 Table vi.3.1 Percent distribution o f women by current marital status, according to age
at time of survey, Egypt DHS 1995... 190 Table vi.3.2 Proportions o f women aged 30-49 who had first married by exact ages 25 and 30 according to selected background characteristics, Egypt DHS 1995 .... 191 Table vi.4.1 Percentage of women who were first married by exact age 15,16,18, 21,
23, and 25, and median age at first marriage, according to current age, Egypt DHS 1995... 192 Table vi.4.2 Median age at first marriage among women age 20-49 years, by current
age and selected background characteristics, Egypt DHS 1995...193 Table vi.4.3 Distribution of ever-married women, who completed the women status
questionnaire, by place o f living at beginning o f their first marriage according to region, Egypt DHS 1995 WS m odule...195 Table vi.4.4 Wife’s family marriage and engagement expenses in Egyptian pounds by region for ever-married women who completed the woman-status module, Egypt DHS 1995 WS m odule... 195 Table vi.4.5 Distribution of ever-married women by highest education level and
working for cash before marriage according to region, Egypt DHS 1995...196 Table vi.4.6 Distribution o f ever-married women aged 25 or more and who had
married for the first time by age 25 by age at first marriage according to
Table vi.4.7 Results of the first logistic regression model examining variables
affecting the probability o f getting married before or at age 16 for ever-married women aged 25 or more and who had married by age 25 including age and excluding year of marriage, Egypt DHS 1995...201 Table vi.4.8 Results of the first logistic regression model examining variables
affecting the probability o f getting married before or at age 16 for ever-married women aged 25 or more and who had married by age 25, excluding age and including year o f marriage as an independent variable, Egypt DHS 1995... 202 Table vi.4.9 Results of the second logistic regression model examining the probability
o f getting married at age 21 to 25 years against at age 16-20 for ever-married women aged 25 or more and who had married by age 25, including age and excluding year o f marriage, Egypt DHS 1995...204 Table vi.4.10 Results o f the second logistic regression model examining variables
affecting the probability o f getting married at age 21 to 25 years against at age 16-20 for ever-married women aged 25 or more and who had married by age 25, excluding age and including year of marriage as an independent variable, Egypt DHS 1995...205 Table vi.5.1 Distribution of ever-married women who had married only once and
married less than 20 years before the survey by age-gap between their current (last) spouses and median age-gap according to selected background variables
208 Table vi.5.2 Distribution of ever-married women by their education level according to their husbands’ education level, Egypt DHS 1995... 209 Table vi.5.3 Distribution of ever-married women by inter-spousal educational gap
according to selected background variables...210 Table vi.5.4 Distribution of ever-married women by the relation to their husbands
according to some selected background characteristics, Egypt DHS 1995... 213 Table vi.5.5 Distribution of ever-married women by the relation to their husbands
according to some selected background characteristics, Egypt DHS 1995... 214 Table vi.5.6 Results o f Logistic regression model, Odds Ratios, o f the probability of
being married in consanguineous unions on some background variables, Egypt DHS 1995...216 Table vi.5.7 Percentage o f currently married women in a polygynous union, according
to current age and selected background characteristics, Egypt PAPCHILD 1991 ... 217 Table vi.6.1 Distribution o f ever-married women who had their first marriage
dissolved and percentage remarried according to some background
characteristics, Egypt DHS 1995...219 Table vii.2.1 Distribution of ever-married women by degree o f involvement in the
husband selection process according to some background characteristics, Egypt DHS 1995 WS m odule...230 Table vii.2.2 Distribution o f ever-married women by degree o f involvement in the
husband selection process according to some o f the respondents’ background characteristics, Egypt DHS 1995 WS module...231 Table vii.2.3 Distribution of ever-married women who were not related and chose
their first husbands according to family approval on marriage and some o f the respondents’ characteristics, Egypt DHS 1995 WS m odule...232 Table vii.2.4 Results of the Multinomial Logistic Regression Model, (Odds Ratios), of
Table vii.3.1 Distribution of ever-married women according to co-residence at the beginning o f marriage and some background variables, Egypt DHS 1995 WS m odule... 237 Table vii.3.2 Distribution of ever-married women according to co-residence at the
beginning o f marriage and some background variables, Egypt DHS 1995 WS m odule... 238 Table vii.3.3 Logistic regression results, odds ratios, o f co-residence with in-laws at
the beginning o f marriage on the prior variables and, Egypt DHS 1995 WS m odule... 240 Table vii.3.4 Distribution of ever-married women according to co-residence at the
beginning o f marriage and degree of involvement in husband selection process, Egypt DHS 1995 WS module... 241 Table vii.3.5 Results of first logistic regression model, Odds Ratios, to test the
association between degree o f involvement in husband selection process and co residence with in-laws at the beginning o f marriage, Egypt DHS 1995 Ws
m odule... 242 Table vii.3.6 Results o f the second logistic regression model, odds ratios, o f co
residence with in-laws at the beginning o f marriage on degree o f involvement in husband selection and prior variables, Egypt DHS 1995 WS m odule...243 Table vii.4.1 Distribution of the inter-spousal relations indices for ever-married
women who married for only once, Egypt DHS 1995 WS m odule... 245 Table vii.4.2 Results o f logistic regression and multinomial regression models o f the
occurrence o f beating and degree o f acceptance o f wives’ beating on degree of involvement in husband selection, Egypt DHS 1995 WS m odule... 247 Table vii.4.3 Results o f logistic regression and multinomial regression models o f
some inter-spousal relations on the degree o f involvement in husband selection, Egypt DHS 1995 WS module... 248 Table vii.4.4 Results o f the multinomial regression models o f some inter-spousal
relations on the degree o f involvement in husband selection, Egypt DHS 1995 WS module...249 Table vii.4.5 Summary o f logistic and multinomial regression models, odds ratios
presented, o f different inter-spousal relation indices on prior variables for women who had married only once, Egypt DHS 1995 WS module...251 Table vii.4.6 Distribution o f ever-married women who had married only once
according to duration o f marriage and marital status at time o f survey, Egypt DHS 1995 WS m odule...252 Table vii.4.7 Results o f logistic regression model o f mother working on some
characteristics among women who had married only once, Egypt DHS 1995 WS m odule... 254 Table vii.4.8 Distribution of women who had married only once by type of work
before marriage and education level, Egypt DHS 1995 WS m odule...256 Table vii.5.1 Analysis o f the deviances for first marriage ending in divorce excluding
women who had their first marriage ending in widowhood, Egypt DHS 1992 WS m odule... 258 Table vii.5.2 Results o f the best model, relative risks, for the current-status data, using
the negative log-log link function for differentials in first marriage ending in divorce, Egypt DHS 1995 WS module...260 Table vii.5.3 Distribution of ever-married women who had married during the 20
according to degree o f involvement in husband selection process and living with in laws at beginning o f marriage, Egypt DHS 1995 WS module... 261 Table vii.5.4 Distribution of ever-married women who had married during the 20
years before the survey by age gap with first husbands, and median age-gap, according to some marriage characteristics and husbands education, Egypt DHS 1995 WS m odule... 262 Table vii.5.5 Distribution of ever-married women who had married during the 20
years before the survey by age gap with first husbands, and median age-gap, according to some families background characteristics, Egypt DHS 1995 WS m odule... 264 Table vii.5.6 Distribution o f ever-married women who had married during the 20
years before the survey by age gap with first husbands, and median age-gap, according to some o f respondents’ characteristics, Egypt DHS 1995 WS module
...265 Table vii.5.7 Multinomial regression results, Odds Ratios, o f age-gap on different
background characteristics for the marriage cohort less than 20 years before the survey, Egypt DHS 1995 WS module... 267 Table vii.5.8 Multinomial regression results, Odds Ratios, o f age-gap on different
background characteristics excluding husband’s age at marriage for marriage
cohort less than 20 years before the survey, Egypt DHS 1995 WS m odule 270
Table vii.7.1 Results o f logistic regression and multinomial regression models, Odds Ratios, o f occurrence o f beating and acceptance o f beating on the degree o f involvement in husband selection and other prior variables, EDHS 1995 WS m odule... 279 Table vii.7.2 Results of logistic regression and multinomial regression models, Odds
Ratios, o f decision, spousal communication and freedom o f movement indices on the degree o f involvement in husband selection and other prior variables for ever-married women who had married only once, EDHS 1995 WS module.... 280 Table vii.7.3 Results o f logistic regression and multinomial regression models, Odds
Ratios, of access to money, gender role, and divorce equality indices on the degree o f involvement in husband selection and other prior variables for ever-married women who had ever-married only once, EDHS 1995 WS module...281 Table viii.2.1 Summary of results of some marriage indicators in the Maghreb
countries and Egypt... 282
LIST OF FIGURES
Figure i.3.1 Percentage o f ever married among women age 35-39 and 45-49 at time o f survey in some Arab countries... 21 Figure i.3.2 Median age at first marriage by calendar year for some North African
Arab countries during the period 1954 to 1994...27 Figure i.3.3 Median age at first marriage by calendar year for some Northern Middle
Eastern Arab countries during the period 1954 to 1994... 27 Figure i.3.4 Median age at first marriage by calendar year for some Gulf Arab
countries during the period 1954 to 1986... 28 Figures iv.1.1 to iv .l.6 Distribution o f women by five-year age groups reconstructed
using the distribution o f ever-married women and proportions of women married at different age-groups... 85 Figures iv.2.1 to iv.2.6 Trends in median age at first marriage for cohorts o f women
Figure v.4.1 Percentage o f ever-married women who had their first marriage dissolved
by age at first marriage in the three Maghreb countries... 115
Figure v.5.2 Percent distribution o f ever-married women by relation to husband, for the three Maghreb countries...130
Figure vi.5.1 Distribution of ever-married women by blood relationship to current or last husband, Egypt DHS 1995... 212
Figure vii.2.1 Distribution of ever-married women by degree o f involvement in the husband selection process according to some background variables, Egypt DHS 1995 WS m odule... 228
Figure vii.5.1 Current-status proportions o f first marriage ending in divorce by time since first marriage, Egypt DHS 1995 WS module... 257
LIST OF MAPS Map i.3.1 Percentage o f women ever married at age 35-39 at time o f survey...20
Map i.3.2 Percentage o f women ever-married at age 15-19... 22
Map i.3.3 Median age at first marriage for women age cohort 30-34 at time o f survey ...24
Map v.1.1 The Maghreb Countries... 97
Maps v .l.2 to v .l.4 Morocco, Algeria, and Tunisia regional... 103
Map vi.1.1 Egypt Regional... 183
LIST OF CHARTS Chart ii.l: Analytical Framework... 62
Chart ii.2: Analytical Framework Summarised... 63
C
h a p t e r
I: I
n t r o d u c t io n
This chapter is consisted of three main sections: the first section briefly introduces the
importance of marriage and family formation in the Arab region with a brief
description o f such patterns. The second section describes the organisation of the
thesis and summarises the content o f each chapter. The third section draws an over
view picture of nuptiality patterns in the Arab region with a brief reference to the
experience o f other developing regions.
1.1 M ARRIAGE AND TH E ARAB REGION
The League of Arab States includes twenty-two Arab countries. Among these, four
countries, Djibouti, Comoro, Somalia and Mauritania, are suspected to be influenced by
a different set of cultural and social forces, as their history, language, and religious
composition are quite different from the rest o f the Arab countries. The remaining
eighteen Arab countries, which appear to be more socially and culturally homogeneous
differ a great deal in the amount and type of information on marriage.
Marital status is one o f the most important social and demographic variables. The
nuclear family is the fundamental procreative and socialising unit. Patterns o f family
formation and dissolution serve as basic indicators of a population’s social structure and
potential for growth. Moreover, in the Arab region, the only acceptable context for
sexual activity and parenthood is within marriage. In this cultural context, non-marriage
and dynamics within marital unions may have important implications on well being of
individuals, offspring and society as whole.
Rashad and Osman (forthcoming) describe the marriage patterns in the Arab region
during the first half of the twentieth century as having been similar to the non-European
marriage type characterised by early marriage and a relatively low incidence of celibacy.
This pattern was supported by a number of economic, cultural and social factors that
operated in many developing countries at this period of time. The agrarian production
system and the extended family system, which is characterised by strong common
economic and family ties, supports early marriages as it provides the economic needs for
the newly married couples. Furthermore, marriage in the Arab society is a legally and
status attainment. The marriage pattern in the Arab region, during this period, was
characterised of early female age at marriage, with high chances for the bride to co-
reside with her in-laws; marriage is more likely to occur among relatives, with the
husband older than the wife.
Most of the Arab region countries share more than just the same language and religion,
they have more or less the same cultural values and morals and all have been, and many
still are, through long political struggles and colonisation. However, the more recent
picture of marriage pattern across the region is far from being as consistent as it used to
be at the beginning of the twentieth century.
Rashad and Osman (forthcoming) observe that most of the Arab countries are going
through some sort o f ‘nuptiality transition’ from one pattern of marriage to another, and
that different countries are in different stages o f such transition. They described three
distinctive female marriage patterns, which are based on the UN (1990a) definition: one
of early timing and universality of marriage, the second of late timing and universality of
marriage, and the third o f late timing and non-universality o f marriage. The authors
assume that each country passes from one pattern to another in order and the last stage of
such transition is to reach the third pattern of late and non-universal marriage. Their
choice of the threshold to move from one stage to another was rather arbitrary. They
measured early marriage by the percentage of women aged 20-24 who had married by
age 20 and universality of marriage by the percentage of women aged 35-39 who had
ever married. Their chosen threshold to move from early to late timing o f marriage that
the percentage of women age 20-24 married by age 20 is less than 40 percent, and the
threshold to move from universality to non-universality o f marriage that the percentage
o f never married women at age 35-39 is greater than 10 percent. Using the previous
definition they observe that different Arab countries were at different ‘transition stages’
during the 1990’s. For example, they found that Egypt in 1995, Oman in 1995, and
Yemen in 1997 are still in stage 1 with early and universal marriage; while Tunisia in
1995, Algeria in 1992, and Morocco in 1995 were in stage 2 of the transition with late
and universal marriage; and finally Lebanon in 1996, Kuwait in 1996, and Libya in 1995
were in stage 3 with late and non-universal marriage.
The distribution o f the Arab countries according to the defined ‘nuptiality transitional
stages’, by Rashad and Osman (forthcoming), can be highly criticised, as the choice
o f each stage’s threshold is rather obscure. Moreover, the quality of data used has not
conclusion that there is currently no unique marriage pattern that can describe the
nuptiality experience of all the Arab countries. Given the common culture, religion
and strong emphasis on family in all the Arab countries, such observations raise the
questions as to why different Arab countries have different marriage patterns and
what factors can explain such variations. The variations in nuptiality patterns in the
region do not necessarily follow a simple explanation. For example, we cannot simply
justify such variations by assuming that the more educated the women, and therefore
the more they are exposed to new ideas, the more likely they are in a higher nuptiality
transitional level. Because, for example, the percentage o f female 20-24 who had
secondary education or more is 43 percent in Egypt 1995 while it was 24 percent in
Algeria 1992, yet Egypt was in stage 1 while Algeria in stage 2 o f the transition
according to Rashad and Osman definitions.
Despite the importance o f nuptiality as a demographic component, it is considerably
under studied when compared to fertility, or mortality, particularly for the Arab region.
Nuptiality studies for the Arab region are very sparse and marital status is usually
analysed in terms o f education and age without looking at other potential explanatory
variables and interactions. In general, education and employment experiences can
enhance autonomy and self-recognition, which in turn change people's expectations
and prospective gains from marriage. However, the effect of both education and
employment on marriage decisions is rather complex and does not usually follow the
expected pattern in all the countries in the region. Such observations invited the
elaboration o f an analytical framework that takes into account the relationships
between different factors that can interact and affect nuptiality. For example, the
persistence of the kinship system, which benefits arranged marriage, in many
countries in the region can well under play the role o f education and employment on
marriage. Within the context o f strong ties and kin groups it is very difficult for
individuals to change these norms. However, there are many variables that compete
with such norms. Higher education and employment on the micro level and the
development process at the macro level are main factors in shaping new values that
favour different nuptiality elements.
1.2 THESIS DESCRIPTION
This research studies the nuptiality patterns in Egypt and the Maghreb countries:
availability o f enough comparable and accessible data sets. It also aims to draw
comparisons between relatively homogenous set o f countries representing the North
African region with its relatively common history and cultural context. Both the
Demographic and Health Surveys (DHS) and Pan Arab Project surveys (PAPCHILD)
provide national information on some o f marriage aspects in the four countries. The
data used come from the Egypt DHS 1995, Morocco DHS 1992, Tunisia DHS 1988,
and Algeria PAPCHILD 1993. The available data are used to study the nuptiality
patterns in the four countries and draw comparisons between them in the light o f the
proposed framework. In addition to the standard DHS questionnaires, the Egypt DHS
1995 includes a women’s status module, which provides richer information on the
marriage and husband selection process as well as indicators o f post marital inter-
spousal dynamics. Such information is used to perform an in-depth analysis of
nuptiality patterns in Egypt and to study the relationship between the intermediate
variables and characteristics of the marriage, as well as with inter-spousal
relationships and the post-marital profile o f women.
This thesis is composed o f seven chapters in addition to the introduction chapter.
Chapter II discusses and builds the analytical framework used in this research. The
proposed framework suggests nuptiality to be formulated o f four main elements, timing,
prevalence, stability and characteristics. The current framework suggests that both macro
and micro level variables interact and influence three major intermediate variables,
which in turn shape the nuptiality patterns. The interactions between different variables
are expected to be crucial in explaining their net effects on the intermediate variables. A
major factor in determining changes in marriage patterns in the Arab region can be the
existent kinship structure and laws governing marriage. These two may play an
important role in shaping the norms o f desirable marriage elements. On the macro-level,
laws governing marriage and relations, kinship and gender structure, religious structure
of the country, development level of the country, political disruption, migration and type
of residence are important factors that can influence nuptiality. On the micro-level, the
families’ characteristics, individuals’ characteristics, and social background are some of
the main factors to be considered. The intermediate variables set o f factors includes cost
of marriage, norms of acceptable marriage elements, and partner selectivity and
availability of mates.
Chapter III thoroughly reviews different methods used to study various nuptiality
Also the advantages and disadvantages o f each method are discussed. In Chapter IV
the data quality o f different surveys’ data for the four chosen countries: Egypt,
Algeria, Morocco, and Tunisia, are assessed in terms of age and age at marriage
reporting.
The results of the nuptiality analysis for the three Maghreb countries; Algeria,
Morocco and Tunisia, are discussed in Chapter V. Chapter V starts by providing some
background demographic information and comparisons between the three countries,
followed by description o f data and variables used for each country in the study. Then
the results of each marriage element for the three countries are explained. A brief
comparison o f nuptiality patterns in the three countries is drawn at the end o f chapter
V.
Chapter VI is allocated to the results of the analysis of nuptiality patterns in Egypt
using the standard Demographic and Health Survey questionnaire. This chapter
contains the results o f analyses similar to those performed for the three Maghreb
countries without using the women’s status module for comparability. Chapter VII is
designated for the in-depth analysis o f nuptiality elements where information is only
available for Egypt using the Demographic Health Survey, 1995, women’s-status
questionnaire. This chapter covers the study of partner selectivity process in Egypt
and its link with some post-marital inter-spousal relations as well as with some
marriage elements.
Chapter VIII is the conclusion chapter, where the results for the nuptiality patterns
analyses for the four North African countries are compared. Interpretations and
implications o f different findings as well as proposed areas for further research are
discussed.
1.3 AN OVERVIEW OF NUPTIALITY PATTERNS IN THE ARAB REGION
Before studying the detailed nuptiality patterns o f the four chosen countries, it will be
useful to draw an overview of existing nuptiality patterns in the Arab region in
general. This overview is mainly based on published data and cannot cover all the
Arab countries for all nuptiality elements. Some o f the Arab countries only have
information from as far as 1981, yet others reflect more recent experience up to 1998.
However, most o f the data points were during the late 80’s and early 90’s. It should be
kept in mind that the quality o f the data has not been tested, because of the
However, they will be used to provide a rough picture of marriage elements in the
countries of the region and extreme figures should be interpreted with caution.
1.3.1 Prevalence of M arriage
One of the ways to examine the level of marriage prevalence in one population is to
look at the percentage of ever-married women at a relatively older age, where the
chances of getting married after such age will be reduced significantly given the
traditional acceptable and preferred set of marriage norms. In this section we will
compare both proportions of ever-married women at age groups 35-39 and 45-49.
Map i.3.1 presents the distribution of most of the Arab countries by proportion of
women ever married at age group 35-39; figures are presented in table i.3.1.
Map i.3.1 shows that all the countries covered have a prevalence of marriage that is
higher than 85 percent, with the exception of Lebanon in 1996 and Qatar in 1987.
Only Libya in 1995 and Palestine in 1998 have a percentage of women ever married
at age 35-39 that is between 85 and 89 percent, and the rest of the countries have a
prevalence of marriage that is 90 percent or more.
Map i.3.1 reflects that the Map i.3.1 Percentage of women ever m arried at
dominant pattern across the a8e 35-39 at time of survey
region is of high prevalence of
marriage. Figure i.3.1 presents
the proportions of women ever
married at both age groups 35-
39 and 45-49 for different Arab
countries. It is clear from the
data that marriage is almost
universal in almost all the Arab
countries. However, some
countries, such as Lebanon marriage cannot be considered universal even among
women at age 45-49 where 12 percent of women at this age group are still never
Figure i.3.1 Percentage of ever m arried among women age 35-39 and 45-49 at time of survey in some Arab countries
100
<£•
□ 35-39 □ 45-49
Country and year
In comparison to other developing countries, we find that most sub-Saharan countries
have a prevalence of marriage that is equal or higher than that in the Arab region, with
the exception of few countries such as Namibia in 1992 and Botswana in 1988. The
experience of Latin American countries, is also similar where all of the countries
covered by the DHS surveys have a proportion of ever-married women at age 45-49
that is 95 percent or more, with the exception of Colombia in 1995, 92 percent, and
Paraguay in 1990, 93 percent. On the other hand, the prevalence of marriage among
women age 45-49 is higher among the Indian sub-continent than that in the Arab
region. For example, the proportion is 99 percent in India in 1999 and Bangladesh in
1996/97. The same proportion was 94 percent or more in all other Asian developing
countries with the exception of Vietnam in 1997 and Philippines in 1998 (data are
extracted from the Demographic and Health Surveys and presented in the appendix,
Section 1.4).
1.3.2 Timing of M arriage
Adolescent marriage
Adolescent marriage reflects how very early marriage is practiced, and thus accepted,
in a society. A good index of early marriage is to compare the proportions of women
available for most Arab countries. To have an idea about the variations in adolescent
marriages in the region, the proportion of women ever married at age 15-19 can be
compared for different countries. The choice of this proportion as an index of the
prevalence of adolescent marriage is mainly due to its availability for most of the
Arab countries. However, we have to keep in mind that this age group does not
entirely reflect the very young females as the legal age of marriage for females in all
Arab countries ranges from 16 to 18 years old, and females who marry at age 18 or 19
are not considered very young by most of the Arab societies. Map i.3.2, and data in
table i.3.1, presents the percentage of ever-married women at age group 15-19 for
some of the Arab countries at time of surveys.
Although the variations in
Map i.3.2 Percentage of women ever-married at age
the prevalence of marriage 15-19
are very minor, the
differentials in timing of
marriage between
different Arab countries
seem to be wider. The
data show that adolescent
marriages, represented in
the proportion
ever-married at age 15-19, m <8?.
vary widely across the m io-imv,
a. i 1 * • iS -W *
region from only 1 - ^ 3 0 1 o r n o r *
percent in Libya 1995 to
37 percent in Oman 1989 and 39 percent in Mauritania 1981. The majority of North
African countries, Algeria, Tunisia and Libya in addition to Lebanon in the Middle
East reported a proportion of adolescent marriage that is lower than 5 percent. On the
other hand, most of the gulf countries, Saudi Arabia, United Arab Emirates, Oman,
and Yemen reported that 15 percent or more of women aged 15-19 had ever married.
Egypt, Morocco, Sudan, Syria, Kuwait and Qatar have a middle rate of adolescent
marriage with 10-14 percent of women aged 15-19 ever married.
Comparing the proportion of ever-married women at age 15-19 in the Arab region to
other developing countries, we notice that this proportion is much higher in most sub-
Saharan countries than in the Arab region. The proportion of ever-married women at
e&ipt S A tltA 'A
[image:24.595.31.550.33.616.2]age 15-19 in most o f Sub-Saharan African countries and the Indian sub-continent is
25 percent or more (see Tables i.4.3 and i.4.5 in appendix). In Latin American
countries also, the proportion of ever-married women at the same age group ranges
from 13 percent to 35 percent. We do not notice the very low proportions observed in
some Arab countries, such as Libya where only 1 percent o f women 15-19 were ever
married and again we ought not to trust such extremely small proportion. However, a
number o f other Arab countries have relatively law prevalence of marriage at age 15-
19, less than 5 percent, such as Algeria and Tunisia, which may indicate a slightly
different pattern o f adolescent marriage than that in other developing countries.
Table i.3.1 Percentage of ever-married women at different age groups for some _____________ of the Arab countries at different points of time_____________
Country and year Age at time o f survey
15-19 35-39 45-49
I North Africa
Libya 952 1.0 89.5 98.6
Algeria 932 3.6 93.6 98.1
Tunisia 952 3.2 94.0 97.2
Sudan 921 10.6 94.6 98.7
Morocco 96/971 12.7 88.5 96.6
Egypt 951 14.3 97.4 98.8
Middle East (Northern)
Lebanon 964 4.4 78.0 87.8
Jordan 974 8.2 94.6 98.0
Syria 932 13.9 91.2 94.8
Palestine 984 19.6 88.5 94.8
Gulf Countries
Bahrain 893 5.6 90.5 98.0
Qatar 873 10.0 83.3 96.1
Kuwait 873 11.7 97.4 98.4
Saudi Arabia 873 16.1 95.3 98.1
U A E893 18.5 96.0 98.5
Yemen 971 26.8 97.9 99.2
Oman 893 37.2 98.6 99.9
Sources: 1- DHS surveys, 2- PAPCHILD surveys, 3- Gulf Child Health Surveys, 4- PFHS surveys. Countries are ordered by region and within each region ordered ascending according to percentage ever married at age 15-19.
Female Median Age at First Marriage (MAFM)
The median age at first marriage for women age 25-49 at time o f survey has been
gathered for some o f the Arab countries and at different points o f time if available.
different countries and the source and date of data collection. Table i.3.2 shows that
Yemen and Sudan had the lowest median age at first marriage ranging from 16 years
to less than 18 years; note that the same two countries had a relatively higher
proportion of ever-married women at the age group 15-19. On the other hand, the
highest median age at first marriage was around 21 years and found in Tunisia 1988
and Jordan 1997 who also had low proportion of ever-married women at age 15-19.
When excluding Sudan and Yemen, we notice that the differences in the MAFM
[image:26.595.27.550.24.809.2]between the remaining 4 countries is around two years or less.
Table i.3.2 Median ages at first marriage for women age 25-49 at time of survey for some Arab countries
Country Source and Date Median age at first
marriage
DHS 1988 18.5
Egypt DHS 1992 19.2
DHS 1995 19.3
DHS 1987 18.5
Morocco DHS 1992 18.8
DHS 1995 20.2
II
Sudan DHS 1989/90 17.8I
Tunisia DHS 1988 21.1Jordan PFHS 1990 19.6
PFHS 1997 21.5
Yemen DHS 1991/92
DHS 1997
15.8 16.0
Map i.3.3 presents the
median age at first Map 1,3,3 Median a§e at first m arria8e for women age
marriage among women
of age cohort 30-34 for
the countries in the region
at time of survey, the data
can be found in table i.3.4.
We chose the age cohort
30-34 of women to show
the timing of marriage
among a middle age
cohort and avoid
selectivity biases at older
and younger age cohorts.
Map i.3.3 shows that in all North African countries, Morocco, Algeria, Tunisia, Libya,
and Egypt, the median age at first marriage for women age 30-34 was 19 years or
higher. On the other hand, all west Asian countries, with the exception of, Lebanon,
Palestine, Jordan and Syria, have a median age at first marriage for women 30-34 that
was 18 years or lower.
The data show that the median age at first marriage in the Arab region is not very low
when compared to other developing countries.
For example, the median age at first marriage for women 25-49 in all Sub-Saharan
African countries is 18 years or less reaching 15.8 in Chad 1996, with the exception of
Botswana in 1988 and Namibia in 1992 where it was 24 and 24.8 years respectively.
However, the Latin American countries show a narrower range o f MAFM ranging
around 19 to 21 years (comparisons based on Demographic and Health surveys
published data and is presented in the appendix).
Trends in Female Median Age at First Marriage
One o f the ways to look at the trends in timing o f marriage is to compare the median
age at first marriage (MAFM) across different age cohorts within the same survey.
Such data were published for quite a few countries in the region, which can allow us
to observe any changes in timing o f marriage. Table i.3.3 presents the median age at
first marriage for age-cohorts o f women in some Arab countries as well as the source
and date o f the data.
The available data shows that Lebanon in 1996 had the highest median age at first
marriage across all age cohorts. For example, the median age at first marriage for the
age-cohort 25-29 in Lebanon 1996 was 24.5 years which is close to that in Morocco
1995, 23.8 years, Tunisia 1995, 23.2 years, and Jordan 1997, 23.1 years. However, the
median age at first marriage for the cohort aged 25-29 was at least 8 years lower in
Oman 1988/89 (15.7 years), nd Yemen 1997 (16.6 years). Such observations illustrate
the more recent diversities in timing of marriage across the region. The table also
shows that some countries have relatively younger median age at first marriage across
all age-cohorts than other countries. Thus, Oman, United Arab Emirates, and Yemen,
are characterised more by consistent early marriage. On the other hand, other
countries, such as Jordan, Lebanon and Tunisia have higher median age at marriage
Table i.3.3 Median ages at first marriage for age cohorts of women in some Arab __________________ countries at most recent points of time__________________
Country and year Age-cohort at time o f survey
25-29 30-34 35-39 40-44 45-49
North Africa
Libya 952 a 22.3 18.7 17.3 17.0
Morocco 951 23.8 21.2 19.6 18.9 17.5
Tunisia 952 23.2 21.2 20.0 b b
Algeria 932 21.9 19.1 18.3 16.9 16.3
Egypt 951 20.2 19.4 19.2 19.0 18.0
Sudan 932 19.5 18.0 15.6 14.9 14.8
Middle East (Northern)
Lebanon 962 24.5 23.8 21.9 21.7 20.9
Jordan 974 23.1 22.1 20.9 19.7 19.4
Iraq 893 19.9 17.8 16.9 16.4 16.0
Gulf Countries
Bahrain 893 22.5 19.9 17.9 19.0 18.0
Qatar 873 21.4 18.0 16.6 16.5 15.9
Kuwait 873 19.1 18.7 18.0 17.3 17.1
Saudi Arabia 873 18.1 17.2 16.5 16.5 16.6
U A E873 17.7 16.8 16.3 16.0 16.2
Yemen 971 16.6 16.0 15.9 15.8 15.7
Oman 88/893 15.7 15.6 15.2 15.0 14.7
Sources: 1- DHS surveys, 2- PAPCHILD surveys, 3- Gulf Child Health Surveys, 4- PFHS surveys. Countries are ordered by region and within each region ordered descending according to median age at first marriage for the age-cohort 25-29. a Less than 50% o f women in this age group had been married at time o f survey, b Data not available. Extracted by the Social Research Centre, the American University in Cairo and presented in the Nuptiality Group meeting in 1999.
Figures i.3.2 to i.3.4 present the median age at first marriage for women by calendar
year, which is calculated from table i.3.4. Figure i.3.2 chart presents the experience of
the North African countries, Libya, Morocco, Tunisia, Algeria Egypt, and Sudan.
Figure i.3.3 presents the experience of the three Northern Middle Eastern countries,
Lebanon, Jordan and Iraq, while figure i.3.4 presents the Gulf countries. The three
charts are plotted to the same scale to allow comparability.
Figure i.3.2 shows that the MAFM has increased over time in all the countries.
However, the level o f increase in the MAFM is different among different countries.
The three Maghreb countries as well as Libya and Egypt had higher MAFM than
Sudan in all years. However starting form the early 80’s the gap in the MAFM
between Sudan and Egypt started to be much smaller. Although that up to year 1975
the MAFM in Egypt had similar MAFM to that among other North African countries,
however, during the 80’s the MAFM in Egypt only increased slightly while that in the
Figure i.3.2 Median age at first marriage by calendar year for some North African Arab countries during the period 1954 to 1994
Morocco
24
Tunisia Libya
s
u. Sudan
<
s
54 56 58 60 62 64 66 68 70 72 74 76 78 80 82 84 86 88 90 92 94
[image:29.595.66.490.421.675.2]Calendar year
Figure i.3.3 Median age at first marriage by calendar year for some Northern Middle Eastern Arab countries during the period 1954 to 1994
24
Lebanon
s Iraq
u.
<
s Jordan
54 56 58 60 62 64 66 68 70 72 74 76 78 80 82 84 86 88 90 92 94
Calendar Year
Figure i.3.3 shows that during the 70’s Lebanon had the highest MAFM among the
three countries presented followed by Jordan with at least one year difference in all
years then by Iraq by further one to two years. The MAFM showed a clear increase in
the three countries during the period presented. In Iraq, for example the MAFM
Figure i.3.4 shows that the Gulf countries data provides information on the MAFM
that is older in time than that for the other countries. The data shows a notable
younger MAFM across most o f the Gulf countries than other Arab countries. The
trends in the MAFM are also more clustered, for example the MAFM for Saudi
Arabia, UAE and Kuwait were almost the same up to 1970. Oman and Yemen had an
even younger MAFM than the rest of the Gulf countries, and Yemen carried the same
young MAFM up to the late 80’s. However, data from Bahrain and Qatar show a
notable acceleration in the MAFM during the 70’s and early 80’s. Yet the MAFM in
[image:30.595.76.493.319.591.2]Bahrain is very fluctuating and raise questions about the data quality o f this survey.
Figure i.3.4 Median age at first marriage by calendar year for some Gulf Arab countries during the period 1954 to 1986
Bahrain
latar
LL
* Kuwait S a udi Ara bia IAE
Yemen 16 - |
Om an
12
54 56 58 60 62 64 66 68 70 72 74 76 78 80 82 84 86 88 90 92 94
Calendar year
Male Timing of Marriage
To study the timing o f marriage for both sexes the singulate mean age at first marriage
(SMAM) for males and females is used. It is not recommended to relay on this
method to get an indicator o f the timing o f marriage in the population when the data
on exact marriage dates are available. Median age at first marriage is a better and
more reliable indicator when the data is available. However, since data on the first
marriage timing o f males is usually missing from the available survey data one can
use the SMAM to have an indication on the timing o f male first marriage. When using
indicator for females. For full discussion o f the calculation method and advantages of
[image:31.595.56.478.265.562.2]each method refer to Chapter III.
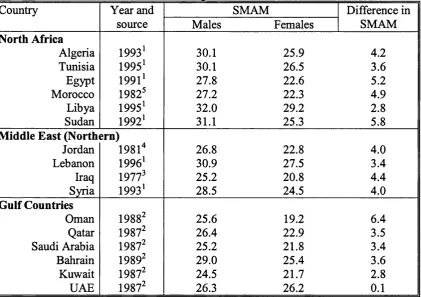
Table i.3.4 lists the singulate mean age at first marriage for males and females in some
Arab countries, and the differences between them, at the latest available data point.
Note that the latest available data for some countries are relatively older than the
others, especially for Iraq 1977 and Jordan 1981.
Table i.3.4 Singulate mean age at first marriage by sex for some Arab countries _______________________ at different points of time_______________________
Country Year and
source
SMAM Difference in
SMAM
Males Females
North Africa
Algeria 19931 30.1 25.9 4.2
Tunisia 19951 30.1 26.5 3.6
Egypt 19911 27.8 22.6 5.2
Morocco 19825 27.2 22.3 4.9
Libya 19951 32.0 29.2 2.8
Sudan 19921 31.1 25.3 5.8
Middle East (Northern)
Jordan 1981 26.8 22.8 4.0
Lebanon 19961 30.9 27.5 3.4
Iraq 19773 25.2 20.8 4.4
Syria 19931 28.5 24.5 4.0
Gulf Countries
Oman 19882 25.6 19.2 6.4
Qatar 19872 26.4 22.9 3.5
Saudi Arabia 19872 25.2 21.8 3.4
Bahrain 19892 29.0 25.4 3.6
Kuwait 19872 24.5 21.7 2.8
UAE 19872 26.3 26.2 0.1
Source: 1- PAPCHILD, 2- GCHS, 3- Demographic Yearbooks, 4- Jordan Demographic Survey, 5-Annual Statistical Abstract, 6- UN statistical office questionnaire.
Table i.3.4 shows that the SMAM for males ranges from 24.5 years in Kuwait in 1987
to 32 years in Libya 1995. The SMAM for males was 30 years or more in Algeria
1992, Lebanon 1996, Libya 1995, and Sudan 1992. The same indicator ranges from
26-29 years in Bahrain 1989, Egypt 1991, Jordan 1981, Morocco 1982, Qatar 1987,
Syria 1993, Tunisia 1984 and UAE 1987. Note that the SMAM for females is
relatively high in United Arab Emirates (26.2 years) and Bahrain (25.4 years) when
SMAM for males and females where, in most o f the cases, they are both either high or
low.
1.3.3 Inter-Spousal Age Gap
The literature review reveals that larger age gap in favour of the husband is preferred
in most o f the Arab region countries. Age differences between spouses are due to a
variety o f social and demographic factors and norms, which usually define a range o f
socially acceptable differences between sexes in age at marriage. Polygyny
contributes to larger differences between sexes because the larger, younger female
cohorts provide the marriageable girls needed to accommodate the greater demand for
brides by older men. Bride-wealth, and other costs of marriage, is another factor that
leads to large age gap between spouses where men have to wait until all costs of
marriage is collected. Migration may delay the marriage of migrant men and increase
age differences either because there is a shortage of marriageable women. For full
discussion on inter-spousal age gap and other marriage elements, refer to Chapter II.
The difference in the Singulate Mean Age at First Marriage between males and
females is used as an indicator o f inter-spousal age gap. Table i.3.4 presents these
inter-spousal age gaps for different Arab countries. The differences in singulate mean
age at marriage (SMAM) between sexes vary from 0.1 year, in United Arab Emirates
1987, to 6.4 years, in Oman 1988. Lebanon in 1996, Libya in 1995, Tunisia in 1984
and all the rest o f the Gulf countries in 1987 had inter-spousal age gaps that were less
than 4 years. Algeria in 1992, Jordan in 1981, Egypt in 1991, Morocco in 19