The LondonSchool ofEconomics andPoliticalScience
Essays on Firms, Innovation, and Culture
Declaration
I certify that the thesis I have presented for examination for the PhD degree of the London School of Economics and Political Science is solely my own work other than where I have clearly indicated that it is the work of others (in which case the extent of any work carried out jointly by me and any other person is clearly identified in it).
The copyright of this thesis rests with the author. Quotation from it is permitted, provided that full acknowledgment is made. This thesis may not be reproduced without the prior written consent of the author.
I warrant that this authorisation does not, to the best of my belief, infringe the rights of any third party.
I declare that this thesis consists of approximately 70,000 words.
Statement of conjoint work
Abstract
This thesis examines innovation and culture within the firm. The first chapter provides evidence on the effect of trust on innovation within firms. I build a new matched CEO-firm-patent dataset, and exploit variations in (i) generalized trust across the countries of CEOs’ ancestry, inferred from their last names, and (ii) CEOs’ bilateral trust towards inventors’ countries ancestry or R&D labs, both yielding an effect of around 6% more future patents for a standard deviation increase in trust, controlling for stringent fixed effects. Trust-induced innovation is driven by higher-quality patents, consistent with a model in which CEO’s trust incentivizes researchers to undertake high-risk explorative R&D. Finally, CEO’s generalized trust is strongly correlated with broader corporate culture of trust, measured from online employee reviews. The evidence provides a micro-foundation for the well-known macro relationship between trust and growth.
The second chapter presents evidence of causal impacts of R&D tax incentives on innovation and technological spillovers using administrative data. Our Regression Discontinuity Design exploits a change in the size threshold that determines eligibility for R&D tax subsidies, and uncovers their large effects on R&D and patenting up to 7 years after the change. R&D tax price elasticities are large (lower bound of 1.1), as treated firms are smaller, and more likely financially constrained. Neighboring firms in small technology class with treated firms enjoy positive spillovers.
Acknowledgments
Throughout my long but exciting PhD journey, I am continually inspired by and greatly indebted to many amazing individuals: my supervisors, my colleagues, my friends, and my family, without whom this thesis would not have come into existence.
I would like to thank Oriana Bandiera, Catherine Thomas, and John Van Reenen for their extensive advice and guidance, as well as their never-ending support and encouragement. I am also grateful to Philippe Aghion, Pierre Azoulay, Clare Balboni, Andres Barrios Fernandez, Robin Burgess, Filipe Campante, Antoine Dechezleprˆetre, Quoc-Anh Do, Andreas Ek, Benjamin Enke, Daniel Ferreira, Torsten Figueiredo Walter, Robert Gibbons, Juanita Gonz`alez-Uribe, Jesus Gorrin, Moqi Groen-Xu, Daniel Gross, Chao He, Emeric Henry, Dana Kassem, Danielle Li, Rocco Macchiavello, Alan Manning, Steve Pischke, Yona Rubinstein, Raffaella Sadun, Scott Stern, Donald Sull, Claudia Steinwender, Eric Van den Steen, Anh N. Tran, Luigi Zingales, and seminar participants at the LSE, MIT, and other institutions for their valuable help and comments. I am particularly thankful to Donald Sull and Anh N. Tran for having generously shared their data. In addition, I thank my classmates at the LSE, Clare Balboni, Matteo Benetton, Carlo Cabrera, Thomas Drechsel, Andreas Ek, Torsten Figueiredo Walter, Dana Kassem, Sevim Kosem, Tsogsag Nyamvadaa, Arthur Seibold, Guo Xu, and many others, for being the best colleagues and friends one could have asked for.
I also much appreciate the help of the staff at the HMRC Datalab and the administrative and academic support staff at the LSE, especially Mark Wilbor, Linda Cleavely, Jane Dickson, Paul Horsler, Manpreet Kheera, Mary Yacoob, and Yee Wan Yau, who have all made things easier than they should have been.
Contents
1 Trust and Innovation within the Firm 12
1.1 Introduction . . . 13
1.2 Theoretical framework . . . 18
1.2.1 A model of trust and innovation . . . 18
1.2.2 Model extensions . . . 21
1.3 Data and measurement . . . 22
1.3.1 Patents as a measure of innovation . . . 22
1.3.2 CEO’s inherited trust measure . . . 23
1.3.3 Baseline sample . . . 27
1.4 Within-firm effect of CEO’s generalized trust . . . 27
1.4.1 Within-firm empirical strategy . . . 27
1.4.2 Baseline effect of CEO’s trust on firm’s patents . . . 29
1.5 Within-CEO effect of CEO’s bilateral trust . . . 32
1.5.1 Within-CEO empirical strategy . . . 32
1.5.2 Effect of CEO’s bilateral trust on inventors’ patents . . . 34
1.6 Evidence of mechanism . . . 36
1.6.1 Framework for separating different mechanisms . . . 36
1.6.2 Effect on patent quality distribution via exploration . . . 38
1.6.3 Effect increases with researcher quality pool . . . 39
1.6.4 Evidence of effect on “corporate trust culture” . . . 40
1.7 Interpretation and discussions . . . 41
1.7.1 Innovating or patenting? . . . 41
1.7.2 Timing of CEO’s trust effect . . . 42
1.7.3 Heterogenous effects by CEO and firm . . . 42
1.7.4 CEO’s practice: qualitative insights . . . 43
1.8 Concluding remarks . . . 44
2 Do Tax Incentives Increase Firm Innovation? 59 2.1 Introduction . . . 60
2.2 Institutional setting . . . 63
2.4.1 Data sources . . . 67
2.4.2 Baseline sample descriptive statistics . . . 69
2.5 Results . . . 71
2.5.1 R&D results . . . 71
2.5.2 Patent results . . . 72
2.5.3 IV results for the knowledge production function . . . 74
2.6 R&D technology spillovers . . . 75
2.7 Extensions and robustness . . . 78
2.7.1 Intensive versus extensive margins . . . 78
2.7.2 Magnitudes and tax-price elasticities . . . 79
2.7.3 Cost effectiveness of the R&D Tax Relief Scheme . . . 82
2.7.4 R&D tax effects on other aspects of firm performance . . . 82
2.7.5 Bunching at the threshold in later years . . . 83
2.7.6 Exploiting other elements of the SME definition . . . 84
2.8 Conclusion . . . 84
3 Privatization and Productivity in Upstream Indusries: 98 3.1 Introduction . . . 99
3.2 Background of privatization in Vietnam . . . 102
3.3 Measurements and estimation . . . 103
3.3.1 Main estimation strategy and identification . . . 103
3.3.2 Total factor productivity estimation . . . 105
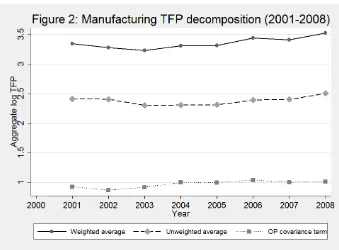
3.3.3 Decomposition of industry TFP . . . 108
3.3.4 Measures of privatization and linkages . . . 109
3.3.5 Investigation of influence channels . . . 110
3.4 Data description . . . 111
3.4.1 Data sources . . . 111
3.4.2 The process of privatization in Vietnam . . . 112
3.5 Estimation results . . . 113
3.5.1 The distribution and evolution of firm TFPs in Vietnam . . . 113
3.5.2 Spillover on firm-level productivity . . . 114
3.5.3 Spillover on industry×market-level productivity . . . 118
3.5.4 Privatization effect and institution quality are substitutes . . . 121
3.6 Discussion and concluding remarks . . . 122
Appendices 152 A Appendices to Chapter 1 153 A.1 Theory appendices . . . 154
A.1.1 Proof of Proposition 1 . . . 154
A.1.2 No credible commitment to tolerance of failure . . . 155
A.2.1 Firm sample construction . . . 157
A.2.2 Patent and inventor data . . . 158
A.2.3 CEO biographical data . . . 160
A.2.4 Mapping last names to ethnic origins . . . 161
A.3 Trust measurement error and bias . . . 164
A.3.1 Relative magnitude of trust measurement error . . . 164
A.3.2 Bias due to trust measurement error . . . 165
A.4 Framework for separating mechanisms . . . 167
A.4.1 Proof of Proposition 3 . . . 167
A.4.2 Patent quality under mean-preserving spread . . . 167
B Appendices to Chapter 2 185 B.1 Institutional details of policy and tax-adjusted user cost . . . 186
B.1.1 SME definition . . . 186
B.1.2 UK R&D Tax Relief Scheme . . . 186
B.1.3 A Simple Model of patents and R&D demand . . . 188
B.1.4 Estimating the instrument’s sharpness using a subsample . . . 189
B.1.5 Tax-adjusted user cost of R&D . . . 191
B.1.6 Macro aspects of the R&D Tax Relief Scheme . . . 192
B.2 Data . . . 196
B.2.1 CT600 dataset . . . 196
B.2.2 FAME dataset . . . 197
B.2.3 PATSTAT dataset . . . 198
B.2.4 Sample construction: merging datasets . . . 200
B.2.5 Variable construction . . . 200
B.2.6 Running variable selection: SME criterion binding ratio . . . 201
B.3 R&D technology spillovers . . . 202
B.3.1 Semi-parametric estimation of spillovers . . . 202
B.3.2 Alternative approach to estimating R&D technology spillovers . . 202
List of Tables
Chapter 1: Trust and Innovation within the Firm 12
1.1 Baseline effect of CEO’s trust on firm’s patents . . . 51
1.2 Controlling for confounding variables . . . 52
1.3 CEO’s trust effect in bilateral trust samples . . . 53
1.4 Bilateral trust effect with country pairwise controls . . . 54
1.5 CEO’s trust effect on quality-weighted patents . . . 54
1.6 CEO’s trust effect by pre-transition researcher pool quality . . . 55
1.7 CEO’s trust effect on “corporate trust culture” . . . 56
1.8 Heterogeneous effects by CEO’s background . . . 57
1.9 Heterogeneous effects by firm’s characteristics . . . 58
Chapter 2: Do Tax Incentives Increase Firm Innovation? 59 2.1 Baseline sample descriptive statistics . . . 89
2.2 R&D regressions . . . 90
2.3 Pre-treatment covariate balance tests and placebo tests . . . 91
2.4 Reduced-form patent regressions . . . 92
2.5 Effects of R&D tax relief on quality-adjusted patents . . . 93
2.6 Effects of R&D on patents (IV regressions) . . . 94
2.7 Heterogeneous effects of R&D tax relief by financial constraints . . . 95
2.8 R&D technology spillovers on patents . . . 96
2.9 SME status regressions . . . 97
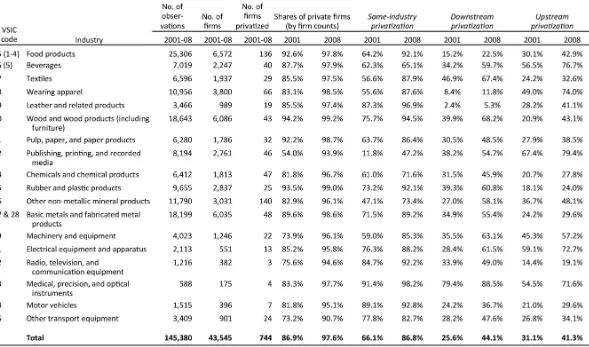
Chapter 3: Privatization in Upstream Industries 98 3.1 Distribution of firms by industry (2001-2008) . . . 127
3.2 Summary statistics for key variables (2001-2008) . . . 128
3.3 Additional summary statistics for privatization measures (2001-2008) . . 128
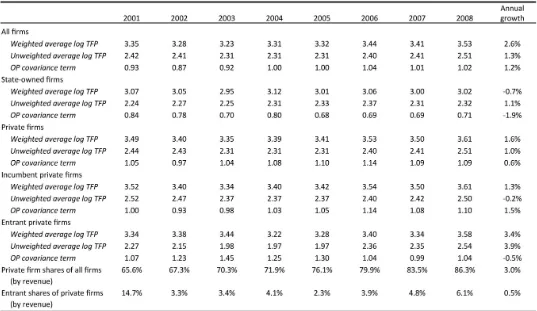
3.4 Manufacturing TFP decomposition by firm type (2001-2008) . . . 129
3.5 Dynamic panel regressions at firm level . . . 130
3.6 Robustness checks for spillover from downstream privatization . . . 131
3.10 Dynamic panel regression at industry x market level . . . 135
3.11 Spillover on incumbent vs. entrant firms . . . 136
3.12 Provincial institution quality and spillover . . . 137
Appendix A: Trust and Innovation within the Firm 153 A.1 GSS inherited trust measure by ethnic origin . . . 171
A.2 GSS ethnic origins of CEOs . . . 171
A.3 Baseline sample’s descriptive statistics . . . 172
A.4 Bilateral trust samples’ descriptive statistics . . . 173
A.5 Average patents before and after CEO transitions . . . 173
A.6 Robustness checks for CEO’s trust effect on firm’s patents . . . 174
A.7 CEO’s retirement and death events . . . 176
A.8 Alternative measures of other cultural traits . . . 177
A.9 Global Preference Survey’s trust and other cultural traits . . . 178
A.10 CEO’s trust effect in US-only bilateral trust sample . . . 179
A.11 Margins of CEO’s bilateral trust effect . . . 180
A.12 Directions of CEO-inventor bilateral trust . . . 181
A.13 Bilateral trust effect by patent quality . . . 182
A.14 Bilateral trust effect on quality-weighted patents . . . 183
A.15 Effect of CEO’s trust on R&D . . . 183
A.16 Effect of CEO’s trust on firm future performance . . . 184
Appendix B: Do Tax Incentives Increase Firm Innovation? 185 B.1 Design of UK R&D Tax Relief Scheme, 2000-2012 . . . 211
B.2 Tax-adjusted user cost of R&D capital over time . . . 211
B.3 Robustness checks for R&D regressions . . . 212
B.4 Robustness checks for reduced-form patent regressions . . . 213
B.5 Robustness checks for effects of R&D on patents (IV regressions) . . . 214
B.6 Additional results on effects of R&D tax relief on quality-adjusted patents 215 B.7 Discontinuities in the probabilities of doing any R&D or filing any patents 216 B.8 Heterogeneous effects of R&D tax relief by past R&D and patents . . . . 216
B.9 Heterogeneous effects of R&D tax relief by industry patenting intensity . 217 B.10 Heterogeneous effects of R&D tax relief by Biotech-pharma (BTP) . . . . 218
B.11 Heterogeneous effects of R&D tax relief by firms’ past capital investments 219 B.12 Effects of R&D tax relief on other expense categories . . . 220
B.13 Effects of R&D tax relief on other measures of firms performance . . . 221
B.14 Estimating impacts of R&D tax relief using other SME criteria . . . 222
B.15 Tax-price elasticities of R&D and patents using different approaches . . . 223
B.19 R&D technology spillovers on R&D and patents . . . 227 B.20 Descriptive statistics . . . 228
Appendix C: Privatization and Productivity in Upstream Industries 229
List of Figures
Chapter 1: Trust and Innovation within the Firm 12
1.1 Distribution of CEO’s inherited trust measure . . . 46
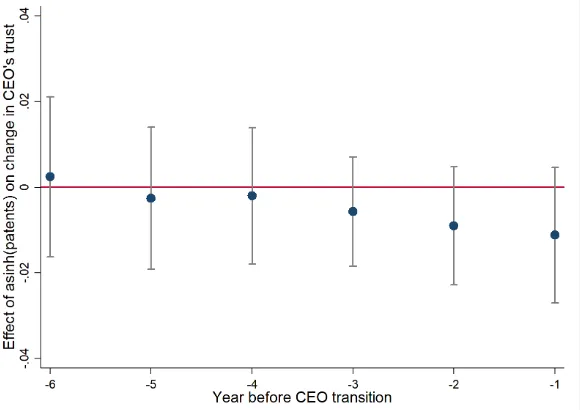
1.2 Pre-change patents and change in CEO’s trust . . . 46
1.3 Pre-trend in patents . . . 47
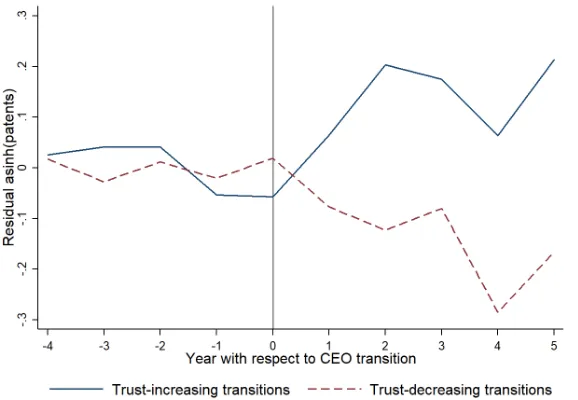
1.4 Patents by change in CEO’s trust (matched sample) . . . 47
1.5 Distribution of CEO’s bilateral trust towards researchers . . . 48
1.6 Project outcome distributions under different mechanisms . . . 49
1.7 CEO’s trust effect by patent quality decile . . . 50
Chapter 2: Do Tax Incentives Increase Firm Innovation? 59 2.1 McCrary test for no manipulation at the SME asset threshold in 2007 . . . 86
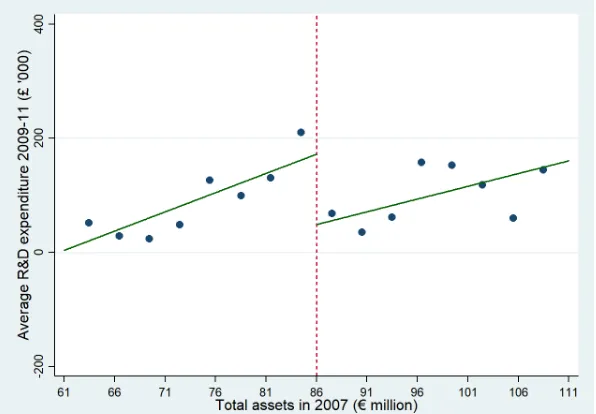
2.2 Discontinuity in average R&D expenditure over 2009-2011 . . . 86
2.3 Discontinuity in average number of patents over 2009-2013 . . . 87
2.4 Business Enterprise R&D over GDP, selected countries . . . 87
2.5 Spillovers on connected firm’s patents by primary patent class size . . . . 88
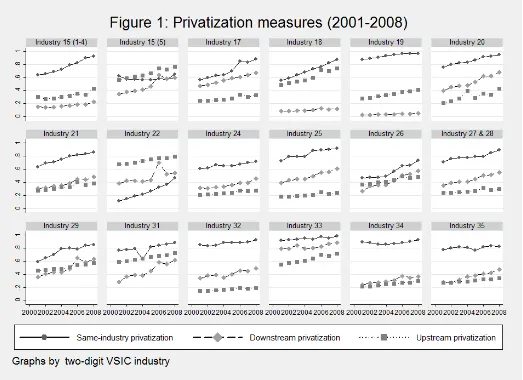
Chapter 3: Privatization in Upstream Industries 98 3.1 Privatization measures (2001-2008) . . . 124
3.2 Manufacturing TFP decomposition (2001-2008) . . . 125
3.3 Manufacturing TFP (2001-2008) . . . 125
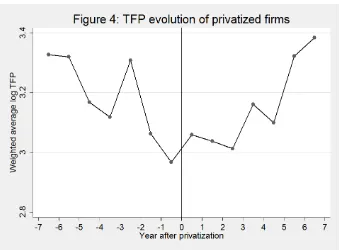
3.4 TFP evolution of privatized firms . . . 126
Appendix A: Trust and Innovation within the Firm 153 A.1 Patents by change in CEO’s trust (non-matched sample) . . . 168
A.2 CEO’s trust effect by change in CEO’s trust . . . 168
A.3 Pre-change patents and new CEO’s bilateral trust . . . 169
A.4 CEO’s trust effect by pre-transition researcher pool quality . . . 170
A.5 CEO’s trust effect by tenure in firm . . . 170
B.2 Discontinuities in average number of patents over 2009-2013 . . . 206 B.3 Discontinuities in 2009-11 R&D at “pseudo” SME asset thresholds . . . . 207 B.4 Discontinuities in 2009-13 patents at “pseudo” SME asset thresholds . . . 207 B.5 McCrary test at the SME asset threshold before the policy change . . . 208 B.6 McCrary test at the SME asset threshold after the policy change . . . 208 B.7 Spillovers on “loosely” connected firm’s patents by patent class size . . . 209 B.8 Number of firms with binding/non-binding asset and revenue thresholds 210
Appendix C: Privatization and Productivity in Upstream Industries 229
Chapter 1
Trust and Innovation within the
Firm: Evidence from Matched
CEO-Firm Data
“Virtually every commercial transaction has within itself an element of trust.”
—Arrow (1972)
1.1
Introduction
Arrow (1974, c.1, p.23) emphasized trust as “an important lubricant of a social system,” as it is impossible to fully contract upon all possible states of nature.1 This insight is especially relevant in the context of research and innovation, in which the inherent uncertainty of research makes contracts necessarily incomplete (Arrow, 1962). It is thus essential to understand the relationship between trust and innovation, in order to better understand how to incentivize innovation, an important driver of growth.
This paper studies the role of trust on innovation within the firm. I develop a theoretical framework in which the CEO’s trust in good researchers encourages their risk-taking, thereby increasing innovation.2 To test this effect, I assemble a large matched CEO-firm dataset covering 5,753 US CEOs in 3,598 US public firms between 2000 and 2011, associated with 700,000 patents and inventors. I infer a CEO’s ethnic origins from her last names using de-anonymized historical US censuses, then measure CEO’s inherited generalized trust as ethnic-averaged trust in US samples. Similarly, I compute CEO’s bilateral trust towards researchers in different ethnic groups within the same firm based on average bilateral trust between countries (highlighted in Guiso et al., 2009). First, I exploit CEO turnovers to estimate the effect of CEO’s trust on patent counts and future citations. Second, I estimate how a CEO’s bilateral trust towards different ethnic groups affects patents filed by inventors in different overseas R&D labs within multinational firms, and by inventors of different ethnic origins in the same US firm, in each case controlling for firm by year, CEO, and inventor country fixed effects. I further examine trust’s effect on the distribution of patent quality to differentiate risk-taking from possible alternative mechanisms.
I model the process of research based on Arrow’s (1962) insight that research is inherently uncertain, and by nature difficult to observe and contract on researchers’ behaviors. In a simple two-period principal-agent model between a CEO and a researcher, the researcher’s type and actions are private information, and only outcomes 1Arrow’s general view on trust has received ample macroeconomic empirical support on the association
of trust and development and growth, as surveyed by Algan and Cahuc (2013, 2014). Knack and Keefer (1997), La Porta et al. (1997), Guiso et al. (2004, 2006, 2009), Tabellini (2010), and Algan and Cahuc (2010), among others, provide evidence that trust is a deep-root determinant of development and growth, through its channels of influence on the accumulation and allocation of factors of production (such as investments, loans, allocation of capital). This economic literature has built on seminal work by sociologists and political scientists on trust and development, including Banfield (1958), Gambetta (1988), Coleman (1990), Putnam et al. (1993), Putnam (2000), Fukuyama (1995), and others.
2While in principle all relations involving researchers inside the firm may matter to its innovative
are observable. In each period, a “good” researcher faces the choice between (i) exploration, a high-risk high-return project that can result in innovation or failure with probability known only to him, and (ii) exploitation, a risk-free low-return common path that surely signals a good type from a bad one.3 On the other hand, failure means either that the researcher’s exploration is unsuccessful, or that he is a bad type.4 Considering those elements, the CEO, who inherits a pool of existing researchers in period 1, decides to whether rehire or fire the researcher in period 2 based on his period 1’s outcome.
In this setting, the CEO’s trust in the researcher is modeled as her prior belief about his type.5 A more trusting CEO is more likely to interpret observed failure as being due to bad luck rather than bad type, therefore more likely to tolerate failure. In anticipation, a good researcher will be more likely to undertake exploration, thereby producing more innovation. The model thus predicts that higher trust induces more innovation through encouraging exploration (versus exploitation). These results resonate with Manso (2011) and Aghion et al. (2013), whose models also imply that tolerating failure and reducing career risk help induce risky innovation. However, while Manso (2011) suggests that this objective could be achieved with long-term incentives and Aghion et al. (2013) with monitoring, my model instead emphasizes the enabling role of trust.6 It also highlights the possible suboptimality of excessive trust due to too much retention of bad researchers,7and the role of trust as substitute for the CEO’s commitment capacity.8
I turn to matched CEO-firm and patent data in the US to study the empirical relationship between CEO’s trust and innovation. Innovation outputs, measured by patent counts,9 are extracted from PATSTAT, a dataset covering close to the universe of patents ever filed from 1900 up to 2016 with 70 million patent documents from over 60 major patent offices all over the world, including the US Patent and Trademark Office
3March (1991) first emphasized the trade-off between exploration and exploitation in the context of
research and innovation. I follow Manso (2011) in modelling research as the choice between exploration and exploitation. Unlike Manso (2011), who studies the implementation of either path, I focus on how the CEO’s prior belief on the researcher’s type, i.e., trust, affects innovation outcomes.
4In this setting, a bad research is understood as someone who lacks in ability or willingness to
undertake appropriate courses of actions. By normalization, I assume that the bad type always fails.
5My choice to model trust as a belief reflects Gambetta’s (1988) definition of trust as “the subjective
probability with which an agent assesses that another agent or group of agents will perform a particular action.” Similar approach has been used in Guiso et al. (2008) and Bloom et al. (2012), among others.
6More broadly, this paper relates to the literature on contractual and financial arrangements to
incentivize innovation (surveyed by Ederer and Manso, 2011), which includes for example Lambert’s (1986) consideration of incentivizing an agent’s risk taking, and Azoulay et al.’s (2011), Ederer and Manso’s (2013), and Gonz´alez-Uribe and Groen-Xu’s (2017) evidence of the effects of Manso-type contractual incentives (i.e., tolerance of failure and long-term incentives) on innovation.
7This result complements Butler et al. (2016) finding on the “right amount of trust,” which suggests that
highly trusting individuals tend to assume too much social risk while individuals with overly pessimistic beliefs can give up profitable opportunities.
8That is, when commitment to tolerance of failure is not possible, trust helps implement it. This result
formalizes the intuition on the reliance between trust and commitment studied in the literature of sociology of organization, such as Klein Woolthuis et al. (2005).
(USPTO) and its counterparts in Europe (EPO) and Japan (JPO).10In addition to patent counts, I also refine data on patent citations, technological class, family, and inventors’ names and addresses to further investigate the mechanism at work.
Detailed data on the background of CEOs and top officers of US public firms are provided by BoardEx. My focus on CEOs is motivated by a growing body of empirical evidence that individual CEOs matter for firm decisions and performance (e.g., Bertrand and Schoar, 2003; Bennedsen et al., 2010; Smith et al., 2017, and the Bertrand, 2009 survey). It proposes a new factor, i.e., trust, that fits the description of manager styles as coined by Bertrand and Schoar (2003) and that contributes to the strand of literature studying how differences in CEO traits relate to differences in firm performance.11
Building on the literature on transmitted and inherited cultural values that highlights the role of cultural origin in shaping an individual’s cultural traits,12I measure a CEO’s trust based on her ethnic origins as inferred from her last name and measures of inherited trust among descendants of US immigrants. First, I construct a probabilistic mapping between CEO’s last names and ethnic origins from four de-anonymized US censuses.13 Second, I compute an ethnic-specific measure of trust for 36 different ethnic origins most common in the US using responses to the trust question in the US General Social Survey (GSS).14 I only select survey answers from GSS respondents in highly prestigious occupations similar to the CEO sample. Each CEO’s inherited trust measure is the weighted average of ethnic-specific trust based on her likely ethnic composition.
To assess the role of generalized trust, the first empirical strategy uses firm fixed effects to exploit changes in CEOs and subsequent changes in patenting within the same firm over time, controlling for CEO observable characteristics such as age, education, and tenure in the firm. The identifying condition is supported by the empirical evidence that both timing of CEO change and the new CEO’s trust are not related to the firm’s past patenting activities. I find that one standard deviation in CEO’s inherited generalized trust, equivalent to the shift from Greek to English, is associated with 6% increase in the number of annual patents filed. This result is robust to a large set of controls for country of origin characteristics and ethnic of origin socioeconomic 10The PATSTAT dataset is thus much more general and suitable for studies with a cross-country
perspective than the usual USPTO dataset. PATSTAT data have since recently been used in research on innovation, such as Dechezleprˆetre et al. (2018).
11Recent studies have started to explore a broad range of CEO characteristics (Malmendier and Tate,
2005, 2009; Kaplan et al., 2012; Kaplan and Sørensen, 2017; Gow et al., 2016) and practices (Bandiera et al., 2015, 2017). In particular, this literature has also considered certain aspects of CEO cultural background such as corruption culture and firms’ misconducts (DeBacker et al., 2015; Liu, 2016).
12E.g., theoretical foundation by Bisin and Verdier (2000), Bisin and Verdier (2001), Tabellini (2008),
Guiso et al. (2016); empirical evidence by Giuliano (2007), Fern´andez and Fogli (2009), Algan and Cahuc (2010), among others.
13The four US censuses from 1910 to 1940 contain 80 million individuals with foreign birth places or
ancestry, sharing among them five million unique last names, out of which 75,000 last names appear for at least 100 times each. 83% of CEO last names are among those 75,000 sufficiently common last names. The inference of ethnic origin from last names was pioneered by Kerr and Lincoln (2010).
14This approach follows Guiso et al. (2006), Algan and Cahuc (2010), and the related literature. I also
conditions and cultural traits, suggesting that it is not driven by other ethnic-related characteristics.
To separate the role of trust from other CEO’s unobservable characteristics such as management style or ability, the second empirical strategy exploits within-CEO variation in CEO’s bilateral trust towards different ethnic groups and patents by inventors from those different ethnicities, which allows for a full set of stringent, including CEO, fixed effects. Bilateral trust measures are calculated between CEO’s inferred ethnic origin and countries of inventors using Eurobarometer data.15 Patent inventors’ countries of origin are obtained from either their addresses (for inventors in overseas R&D labs of multinational firms) or their last names (for US-based inventors). Under the same CEO, one standard deviation increase in bilateral trust towards an inventor country of origin is associated with 3-5% more patents by inventors from the corresponding R&D lab or corresponding ethnicity, controlling for a broad range of time-variant fixed effects at the firm by year, CEO, and inventor country levels. These results remain stable even in the presence of firm by inventor country fixed effects (i.e., using variation in changes in bilateral trust following CEO changes), and after accounting for possible alternative explanations such as favoritism or better information flows between CEOs and researchers.
To distinguish the proposed mechanism that trust induces innovation via encour-aging risk-taking and exploration from other mechanisms in which trust induces more effort by researchers,16 I develop a formal framework to identify the mechanisms via their different implications on trust’s effect on the distribution of patent quality. Using future citation counts and other patent quality measures, I show that, consistent with the risk-taking mechanism, trust increases only high-quality patents, but not low-quality ones, thereby increasing average patent quality as measured by citations per patent by 4%. In addition, I find that trust is most effective in inducing innovation in firms with likely high researcher quality.
These results on the effect of CEO’s trust on firm innovation provide a possible micro-foundation for the macro relationship between long-term economic outcomes and trust, as previously evidenced in Guiso et al. (2006), Tabellini (2010), and Algan and Cahuc (2010), among others.17 As it shows that trust can spur innovations by solving contractual shortcomings, a high-trust society possesses not only the advantage
15These bilateral trust measures have been exploited by Guiso et al. (2009) in the context of international
trade, Bloom et al. (2012) in delegation to subsidiaries, Giannetti and Yafeh (2012) in syndicated bank loan interests, Ahern et al. (2015) in mergers and acquisitions, and Bottazzi et al. (2016) in venture capital flows.
16For example, there is a large literature on delegation in organization since Aghion and Tirole (1997),
such as Acemoglu et al. (2007) and Bloom et al. (2012). In the context of innovation, trust, understood as the preference congruence between the principal and the agent, would lead to more delegation to researchers, which then induce them to put in more effort, thereby producing more innovation.
17The larger literature on the cultural origins of long-term economic development has discussed the
of higher investment and accumulation of factors of production (or even better allocative efficiency), but also the potential to invent more and thus grow productivity faster in the long run.18 This mechanism thus helps explain the macroeconomic differences not only in development levels but also in growth rates across countries.19 Separately, this paper extends the empirical literature of more traditional determinants of R&D and patents, such as tax credit and grant (e.g., Howell, 2017; Dechezleprˆetre et al., 2018), as surveyed by Cohen (2010).
I further link CEO’s culture to firm’s culture, measured from text analysis of almost one million employee reviews on Glassdoor.com, one of the largest career intelligence websites worldwide (from Sull, 2018). The dataset covers many dimensions of employees’ sentiments based on O’Reilly et al. (1991, 2014) across 500 large US public firms between 2008 and 2017 (similar to Grennan, 2014). In different specifications with CEO controls, industry fixed effects, and even firm fixed effects (i.e., using variation in changes in CEO’s trust following CEO changes), CEO’s inherited trust is associated with stronger corporate trust culture. In that regard, this paper also provides new findings supporting the role of corporate culture in determining corporate outcomes.20 Furthermore, it shows a channel through which corporate culture can be influenced: by an injection of culture from the top (as suggested by Van den Steen, 2010).
Beyond the economics literature, the interplay between management and trust and other cultural traits has been examined in sociology of organization and management, e.g., in classic studies by O’Reilly et al. (1991, 2014), and other work on organization culture such as Schein (1985) or Hofstede et al. (1991).21 My results broaden this literature with a large-scale sample of firms, and with inherited trust computed systematically from surveys of opinions.
The rest of the paper is organized as follows. Section 1.2 discusses the model of trust and innovation. Section 1.3 provides descriptions of the data. Sections 1.4 and 1.5 describe the within-firm and within-CEO empirical strategies and the corresponding empirical results. Section 1.6 studies the mechanism through risk-taking and exploration. Section 1.7 provides further discussions and interpretations, and section 1.8 concludes.
18This statement holds in the large class of endogenous growth model `a la Aghion and Howitt (1992) in
which sustained innovation maintains long-term growth.
19From a macro perspective, Doepke and Zilibotti (2014) summarizes theories on the relationship
between cultural traits (such as risk attitude, patience, and trust), entrepreneurship, and growth. Reviews by Durlauf et al. (2005) and Caselli (2005) provide evaluations of the crucial roles of productivity growth in explaining cross-country differences in growth and income level, respectively.
20E.g., Guiso et al. (2015), Grennan (2014), Gibbons and Kaplan (2015); Martinez et al. (2015), Graham et
al. (2018).
21Notably, the management literature has considered the culture of trust in firms as crucial to innovation
1.2
Theoretical framework
This section models how CEO’s trust could affect researchers’ choices and consequently innovation outcomes. As “trust is an important lubricant of a social system” (Arrow, 1974), it is likely to also impact innovation through other different mechanisms. Therefore, it should be noted that my choice to focus on the CEO’s trust (instead of the researcher’s trust) and this particular model is guided by the empirical evidence presented in the latter part of the paper.
1.2.1 A model of trust and innovation
Set up. My starting point is a two-period principal agent game with asymmetric information in which the principal is the CEO and the agent is the researcher.
Researcher. The researcher could be good type with probability θ or bad type with
probability 1−θ. In this setting, a bad researcher is understood as someone who lacks
ability or willingness to take the appropriate courses of actions. The CEO, who is not an expert in science, knows neither the researcher’s type nor θ. In each period, a bad
researcher always shirks and produces sL, while a good researcher chooses between exploitation and exploration. Exploitation is a low-cost, safe R&D project that requires no effort cost and produces sM with certainty. Exploration is a high-cost, risky R&D project that requires effort cost c and produces sH (innovation) with probability π
and sL (failure) with probability 1−π.22 π is independently drawn from the unit uniform distribution in each period and privately observed by the good researcher before choosing which project to pursue. The CEO does not know what project is chosen and only observes the outcome produced by the researcher at the end of each period.23
CEO. The CEO asks the researcher to carry out R&D at the beginning of period 1 without knowing his type. Simultaneously, she decides on an outcome-contingent contract that maps period 1’s potential outcomesi to(b1i,Di)(i∈ {L,M,H}) wherebi is a bonus on top of fixed wagew for the researcher andDi ∈ {0, 1}denotes whether the CEO would fire (Di =0) or rehire (Di =1) the researcher after period 1. If the researcher is rehired, the game continues to period 2, in which the CEO specifies contract (bi2) and the researcher chooses from the same action set as described. The game ends after period 2’s outcome and payment are realized. In the baseline model, I assume that the CEO can credibly commit to the contracts specified at the beginning of each period.24
22The trade-off between the exploitation of well-known approaches and the exploration of new untested
approaches was first emphasized by March (1991) and has since then been widely studied both theoretically and empirically (see survey by Ederer and Manso, 2011).
23The values ofsL,sM,sH,candπ’s uniform distribution are common knowledge and satisfysH−c>
sM>0>sL. The key results of the model remain under more general assumptions about the distribution ofπ.
Trust. Although the CEO does not observeθ, she has her own prior subjective belief
that the researcher is good with probability θP, which reflects her trust level towards
the agent. A more trusting CEO would have a higher subjective θP than a less trusting
one.25 This model focuses on studying how this key parameter of CEO’s trust affects her and the researcher’s strategies in the game and its outcome.26
Payoffs and restrictions. After each period t ∈ {1, 2} with realized outcome i ∈ {L,M,H}, the researcher getsw+bit−c(if he chooses exploration) orw+bti(otherwise) and the CEO getssi−bit.27 If the researcher is fired at the end of period 1, both players’ payoffs in period 2 is zero.28 The researcher has limited liability andbi
t>0∀i,t. That is,
the CEO can reward the researcher for good performance but cannot financially punish him for bad outcome. I also restrict the parameters to satisfy the players’ participation constraint, which implies that the CEO’s expected payoff from hiring a good researcher is positive. It then follows that Di = 1 fori ∈ {H,M}, as these outcomes fully reveal that the research is the good type. However, if period 1’s outcome is L, the CEO cannot tell if the researcher is bad or if he is good but unlucky. Her choice of whether to tolerate period 1’s failureDLdepends on her assessment of which is more likely to be the case, and this assessment depends on her prior subjective beliefθP.
Solution outline. I first consider two separate cases in which DL = 1 and DL =
0, then compare the CEO’s expected payoffs under these two cases to solve for her optimal choice of DL. Note that a good researcher’s choice in period 2 (conditional on its happening) is independent of period 1’s outcome and therefore is the same under both cases. Thus, letV2P denote the CEO’s period-2 expected payoff from hiring a good researcher and let V2A denote a good researcher’s period-2 expected payoff, both are positive under the participation constraints discussed earlier.29
Researcher’s project choice: explore versus exploit. As a bad researcher always shirks, the meaningful action to analyze is a good researcher’s choice between exploration and
25This concept of trust resonates with Gambetta’s (1988) definition of trust as “the subjective probability
with which an agent assesses that another agent or group of agents will perform a particular action.” Similarly, Guiso et al. (2008) also model trust as a subjective belief about being cheated by the counterpart in a financial transaction.
26As the CEO’s prior belief, or trust, affects R&D outcomes via influencing the researcher’s choice, the
latter’s perception of the former’s belief is as important as the belief itself. This is especially true in real life settings where CEOs’ influence on firm’s policies takes time to materialize and credible commitment to such policies is unlikely. In these settings, the researcher’s perception of the CEO’s beliefs and preferences is likely based on the collective reputation of the group to which the CEO belongs in addition to the CEO’s own reputation based on her past actions.
27wis a fixed wage that is set exogenously. For notation simplicity, sL, sM, and sH represent R&D
project’s returns after fixed wage payment, so wdoes not enter the CEO’s payoff. I assume that both players are risk neutral and do not discount future payoff. Introducing risk aversion or time discounting does not affect the model’s key insights.
28The assumption is that the CEO and the researcher cannot immediately find new matches in period 2. 29It can be shown that period 2’s subgame has a unique Nash equilibrium in which the CEO chooses
(bH
exploitation in period 1 given DL. To reduce notations, I omit the outcome superscript
LfromDLand the period subscript 1 fromπ1,b1i for the rest of this subsection.
A good researcher chooses exploration over exploitation when it yields higher expected payoff:
π(w+bH+V2A) + (1−π)(w+bL+DV2A)−c>w+bM+V2A
⇐⇒π> π¯(D).30 (1.1)
The above condition implies that in both cases (D=1 andD=0), the researcher follows a cutoff strategy and chooses exploration when the realized probability of success π is
above threshold ¯π(D).
Given the good researcher’s strategy, the CEO indirectly chooses ¯π(D) via setting
the bonuses to maximize her expected payoff from hiring a good researcher. It is optimal for her to set bL andbM to zero and only vary bH to achieve her desired ¯π(D)
threshold.31 For each value of D, the CEO’s maximization problem then has a unique solution b∗(D)that induces the good researcher to explore when π is above threshold
¯
π∗(D) = c+(1−D)V A 2
b∗(D)+(1−D)VA
2 . This leads us to the following proposition:
Proposition 1. For a given set of parameters, π¯∗(1) < π¯∗(0). That is, tolerance of failure induces more exploration and innovation.
The proof is detailed in appendix A.1.1. The intuition is that period 1’s exploration threshold ¯π∗(.) is increasing in (1−D)V2A and (1−D)V2P, which represent a good
researcher’s and the CEO’s foregone period-2 payoffs after a bad outcome in period 1.32 When failure is not tolerated and termination implies a large loss in future payoff, a good researcher requires higher probability of success to undertake exploration. Similarly, the CEO also prefers a good researcher to take less exploration risk in period 1 for the same fear of losing her future payoff from a relationship with such good researcher when exploration fails. Put differently, tolerance of failure enables a good researcher to take more risk and explore more, which then produces more instances of successful innovation.33 This result resonates with Manso’s (2011) insights that the optimal incentive scheme to motivate exploration exhibits tolerance for early failure and reward for long-term success.34
31That is, she choosesbHto maximize:
Zπ¯(D)
0
h
sM+V2Pidπ+
Z1
¯
π(D) n
π h
sH−bH+V2Pi+ (1−π) h
sL+DV2Piodπ,
where ¯π(D) = c+(1−D)V
A 2
bH+(1−D)VA 2
is also a function ofbH.
32WhenD=1, these losses are zero. WhenD=0, these losses depend onVA
2 andV2P. 33¯
π∗(1) < π¯∗(0) =⇒ R1¯
π∗(1)πdπ >
R1 ¯
π∗(0)πdπ. Furthermore, ¯π
CEO’s tolerance of failure: rehire versus fire. Let V1P(D)denotes the CEO’s period-1 expected payoff from hiring a good researcher under policy D ∈ {0, 1}. It can be shown thatVP
1 (1)>V1P(0)> 0.35 The CEO chooses to tolerate failure (i.e.,DL=1) if it maximizes her total expected payoff:
θP
h
V1P(1) +V2Pi+ (1−θP)sL>θP
V1P(0) +
1− (1−π¯ ∗(0))2
2
V2P
⇐⇒θP > θ¯.36 (1.2)
Proposition 2. The manager chooses DL =1iffθP >θ¯. That is, she chooses to tolerate failure when her trust towards the researcher is high enough.
This is a direct result from inequality 1.2. Intuitively, when observing a bad outcome, a more trusting CEO ascribes more weight to the researcher’s being unlucky than him being of the bad type. As the benefits of incentivizing optimal exploration then outweighs the benefits of screening out bad researchers, she chooses to tolerate failure to avoid mistakenly screening out good researchers in period 2 and also to induce more exploration in period 1.
Combining Propositions 1 and 2 yields the prediction that a more trusting CEO induces more innovation, which is the focus of this paper’s empirical investigation.
1.2.2 Model extensions
First, I relax the assumption that the CEO can credibly commit to being tolerant of failure. Appendix A.1.2 shows that in this setting tolerance of failure is a unique equilibrium only when θP > θ¯post > θ¯ where ¯θpost is an unique cutoff based on the
game’s parameters.37 Furthermore, forθP∈ (θ¯, ¯θpost)there always exists an equilibrium
in which the CEO does not tolerate period 1’s bad outcome, even though it is ex ante
optimal for her to do so. This equilibrium is even the unique one in some cases. Such problem can be avoided if the CEO canex ante credibly commit to the being tolerant of failure as in the baseline model, or if she is high trusting withθP >θ¯post. In other words,
trust acts as a substitute for commitment.
Next, I allow a bad researcher to also be able to produce exploitation outcome with some luck (i.e., with probability q). In this setting, as only innovation outcome (i.e., successful exploration) fully reveals a researcher’s type, would a good researcher exploresmoreunder a less trusting CEO in order to separate himself from the bad ones, even when it is risky to do so? I find that this is not the case unless q is large, for
35UnderDL=0, the good researcher is less willing to choose exploration than what is optimal for the
CEO. In addition, the CEO also has to provide additional exploration incentive for the good researcher through bonuses (i.e.,bH∗(0) >bH∗(1)). As a result,V1P(1)>V1P(0). Note thatV1P(D)is function ofsL,
sM,sH,c,w, andD.
37In this setting, the CEO’s decision whether to tolerate failure is based on her updated belief at the end
exploitation still provides signaling value for a good researcher when a bad researcher is not too likely to produce the same outcome by luck. Therefore, a less trusting CEO induces more exploitation and less exploration and vice versa, as in the baseline model.38 Third, I extend the model to three periods to study if a longer horizon strengthens the CEO’s incentive to screen out bad researchers in earlier periods and induces her to adopt a different strategy. The key intuitions of the two-period game go through in this three-period game. A high-trust CEO always rehires the researcher after a bad outcome; an average-trust CEO tolerates first time failure but not the second time; and a low-trust CEO fires the researcher after first time failure in period 1. A good researcher chooses to explore at the optimal level under a high-trust CEO but undertakes less exploration when the termination threat worsens the downside of failure. As in the baseline model, higher trust maps into higher tolerance of failure and induces more exploration and innovation.39 The results from this three-period game suggest that the findings extend to in longer-horizon settings.
Finally, how does a CEO with subjective prior θP compare to one knowing the
true quality of the researcher pool θ? The model implies higher trust always induces
more innovation, but also more failure. As a result, when the researcher pool is generally bad but the CEO is too trusting, tolerance of failure leads to costly excessive innovation. On the other hand, when the researcher pool is generally good but the CEO is too distrusting, intolerance of failure leads to inefficiently low level of innovation. Furthermore, when the CEO cannot credibly commit to her policies, a more trusting CEO still can outperform an objective one, as then trust helps substitute for commitment. Subsection 1.6.3 provides evidence consistent with these implications that CEO’s trust effects on both innovation and firm’s performance are larger among firms with likely better researcher quality.
1.3
Data and measurement
1.3.1 Patents as a measure of innovation
I follow the innovation literature in using patent and citation counts as measures for innovation (e.g., Trajtenberg, 1990; Bloom and Van Reenen, 2002; Hall et al., 2005).40 My patent data come from PATSTAT, the largest available international patent database which covers close to the population of all worldwide patents since the 1900s up to 2016. It brings together nearly 70 million patent documents from over 60 patent offices, including the United States Patent and Trademark office (USPTO) and all other major
38The proof for this is available upon request. 39The proof for this is available upon request.
40As previously mentioned, the measure of innovative outputs by patents, correcting for quality or
offices such as the European Patent Office (EPO) and the Japan Patent Office (JPO). I assign patents to firms using the matching procedure implemented by the OECD and made available via Bureau van Dijk’s ORBIS platform.41
The dataset contains comprehensive information from the patent record, including application and publication dates, backward and forward citations, technology clas-sification, and patent family. These data allow me to construct various measures of patent quality besides forward citation counts, such as backward citations to scientific literature, patent scope, generality index, originality index, etc. (details in appendix A.2.2). In addition, PATSTAT also provides information on the inventors of each patent, including their names and addresses, as are available on the patent record. This further enables me to link patents to their inventors’ countries of residence (based on their addresses) or countries of origin (based on their last names) to construct patent counts at the firm by inventor country level (details in subsection 1.5.1).
I consider only patents that are classified as “patent of invention” in PATSTAT (equivalent to USPTO’s utility patents). To avoid double-counting inventions, I classify patents in the same patent family (i.e., a set of patents protecting the same invention across several jurisdictions) as one single patent, and assign the patent to the year of its earliest application date. Finally, PATSTAT’s patent data are more comprehensive for the years before 2012, as it takes up to 1.5 years for a patent application to be published and on average 5 years for a patent to gain 50% of its lifetime citations (Squicciarini et al., 2013). As a result, I focus only on patents filed before 2012.
1.3.2 CEO’s inherited trust measure
I obtain information on firms’ CEOs, senior executives, and board directors of US publicly listed firms from BoardEx. The dataset spans from 2000 to 2016, covers almost all US publicly listed firms in this period, and includes rich information on the executives’ background, employment history, and compensation. Among these variables, the executives’ names are essential for the measurement of inherited trust, as explained below. In addition, I also use information on the timing of their positions, gender, education, employment history, and compensation (details in appendix A.2.3).
Measuring CEO’s inherited trust. I measure a CEO’s inherited generalized trust based on her ethnic origins inferred from her last name and measures of inherited trust among descendants of US immigrants. That is,
trustd =
∑
ewde×ethtruste (1.3)
where ethtruste is the average trust measure among all descendants of US immigrants
from countrye andwdeis the probability that CEO dis a descendant of US immigrants
from that country.42
I follow the literature on inherited trust (e.g., Guiso et al., 2006; Algan and Cahuc, 2010) in computing ethtruste using individual-level data on trust attitude and ethnic
origins from the US General Social Survey (GSS), a representative survey of social attitudes among US residents conducted between 1972 and 2014, covering a total of 60,000 respondents. A respondent’s trust attitude is measured by the standard generalized trust question“Generally speaking, would you say that most people can be trusted or that you can’t be too careful in dealing with people?”.43 His ethnic origin is captured by the question “From what countries or part of the world did your ancestors come?”, which covers 36 most common ethnic origins in the US, including almost all European countries in addition to Canada, Mexico, China, and India.44 The baseline ethtrustemeasure is then
the average trust attitude of GSS respondents whose self-reported ethnic origin is e
(see Table A.1). I only consider respondents in highly prestigious occupations (by GSS’ classification), in order to better match the CEO sample.45 In addition, I also construct an alternative trust measure that takes into account demographic characteristics such as gender, education, age, and birth cohort.
Next, I construct a probabilistic mapping between a CEO’s last name and different ethnic origins (i.e.,Wd) using historical de-anonymized US censuses from 1910 to 1940
(e.g., Kerr and Lincoln, 2010; Liu, 2016).46 These data contain individual-level data on birthplace and ancestry of the whole US population during 1910-1940, merged with information on individual names obtained from the Minnesota Population Center. Across four censuses there are 80 million individuals with foreign birthplaces or ancestry, sharing among them five million unique last names. I only consider 75,000 last names with at least 100 occurrences and allow each of them to be mapped to multiple ethnic origins with probabilities equal to their shares of occurrences. Separately, I also compile lists of most common last names in 50 different countries from various sources
42I exclude CEOs who are not US citizens. They comprise only 4.8% of the 54% of CEOs for whom
BoardEx contains nationality information. A quick check reveals that the other 46% represent cases in which the CEOs are obviously US citizens, so that the firm’s website does not state their nationality. They are thus counted as US citizens.
43Following the literature, I construct a trust indicator equal to 1 if the answer to is “Most people can
be trusted,” and 0 if the answer is “Can’t be too careful” or “Other, depends.” This grouping makes a clear separation between high trusting individuals as opposed to moderate or low trusting ones (Algan and Cahuc, 2010).
4437% of respondents report two or three countries of origin, in which case I select the one to which
they feel the closest to. I also exclude 5 ethnic categories: “American Indian,” “American only,” “Other European,” “Other Asian,” and “Other,” which together comprise only 9% of total respondents.
and use these lists to cross-check and supplement the baseline census-based mapping (details in appendix A.2.4).47
83% of the CEO sample are mapped to their ethnic origins based on their last names. Panel A of Table A.3 shows that, there ar no significant differences between these name-matched 83% and the remaining non-name-matched 17% across all observable characteristics. Three most common ethnic origins among CEOs are Irish, German, and English, which together account for about half of the CEO sample (see Table A.2). The average CEO’s inherited trust measure is 0.56, considerably higher than the average GSS trust measure of 0.38 but comparable to the average trust measure of 0.51 among respondents in highly prestigious occupations. Despite the high total shares of three most common ethnic origins among CEOs, Figure 1.1 shows that there remains meaningful variation in their inherited generalized trust measure.
Validity of inherited trust measure. There is a growing literature in economics that highlights the role of cultural origin in shaping individual trust and other cultural traits. Studies by Bisin and Verdier (2000, 2001), Tabellini (2008), and Guiso et al. (2016) provide theoretical mechanisms for cultural transmission of preferences and beliefs from parents to children. Empirically, a large body of evidence shows that trust attitude and other values among descendants of US immigrants are strongly correlated with related traits, behaviors, and outcomes of those in their home countries, consistent with intergenerational cultural transmission among US immigrants.48 Following this literature, I verify the existence of trust transmission by comparing the measure of inherited trust among US immigrants, calculated from the GSS, with an alternative measure based on average trust attitude among the populations of the countries of origin, available from the World Value Survey (WVS). The correlation between the GSS-and WVS-based trust measures is above 0.5 at country level, consistent with the view that immigrants in the US inherit a large part of their cultural traits from their countries of origin, such as shown in Giuliano (2007).49
Ideally, one would like to observe each CEO’s individual trust attitude, yet this latent variable is incredibly challenging to measure. Even if one could administer a trust survey or a trust game among CEOs, the resulting measure would still be affected by measurement error.50 The inherited trust measure misses (i) the individual-specific 47One concern is this last name-based mapping only captures an individual’s patrilineage. However,
given the documented high level of ethnic segregation in the US during the 1940s (Eriksson and Ward, 2018) and high intra-ethnic marriage rates during this period, this is unlikely to be a first order concern. (Note that the majority of the CEOs in my sample were born in the 1940s or 1950s.) Separately, Pan et al. (2018) employ similar approach to identify CEOs’ ethnic origins and find that the uncertainty avoidance indices constructed from CEOs’ last names and from their mothers’ maiden names are highly correlated, which further supports the mentioned observations. Finally, as 98% of my CEO sample are male, name changing due to marriage is not a concern.
48See, for example, surveys by Algan and Cahuc (2013, 2014) and Fern´andez (2011).
49That the correlation is not perfect possibly reflects the fact that immigrants to the US (i) have been
non-randomly selected from the original population, and (ii) have somewhat assimilated to the host culture.
component of trust but also helps smooth out (ii) these measurement errors. In appendix A.3.1, I develop a framework to assess the relative sizes of (i) and (ii) using parameters from the literature (e.g., Glaeser et al., 2000). The results suggest that the baseline inherited trust measure is better than an individual-level survey-based trust measure and about 80% as precise as an individual-level game-based measure.51 Furthermore, using the inherited trust measure does not introduce attenuation bias as in the case of classical measurement errors but produces unbiased estimates of the true effect (details in appendix A.3.2).52
Finally, as remarked in subsection 1.2.1, a CEO’s trust attitude likely affects her firm’s R&D outcome via its influence on firm’s policies and consequently researchers’ choices. In real life settings, CEOs’ influence on firm’s policies takes time to materialize and credible commitment to such policies is unlikely. As a result, researchers’ perception of their CEO’s trust are as important to their choices as the CEO’s actual trust attitude. In large firms, this perception are most likely based on the collective reputation of the group to which the CEO belongs (e.g., Tirole, 1996; Macchiavello, 2010; Xu, 2015), most notably her ethnic group as it is a salient feature of her identity. The inherited trust measure precisely captures the CEO’s ethnic group’s collective reputation of trust attitude and therefore is the key explanatory variable on its own under this interpretation of the mechanism.
Measuring CEO’s bilateral trust. Similar to her inherited generalized trust measure, CEOd’s bilateral trust towards individuals from countrycis calculated as
bitrustdc =
∑
e
we×ethbitrustec (1.4)
where ethbitrustec is a measure for how much a person from country of origin e
trusts a person from country of origin c. This country-level bilateral trust measure (ethbitrustec) comes from the Eurobarometer, a series of surveys conducted for the
European Commission in which individuals in each country are asked the following question “I would like to ask you a question about how much trust you have in people from various countries. For each, please tell me whether you have a lot of trust, some trust, not very much trust, or no trust at all.”, 53 The relevant Eurobarometer surveys cover respondents from 16 EU countries and ask about their trust attitude towards 28 countries, including a
errors. Results from other studies on the stability of experimental and survey measures of preferences are consistent with this finding (see survey by Chuang and Schechter, 2015).
51Of course, if one can administermanytrust surveys or games on the same individual, one can average
out much more precisely individual trust. However, this is highly infeasible.
52In essence, using the inherited trust measure is similar to using the cell-average of the right hand side
number of non-EU countries such as Russia, Japan, and China.54 Existing studies using the same measure have shown that bilateral trust matters to a wide range of economic activities, from cross-country trade (Guiso et al., 2009) to venture capital investment (Bottazzi et al., 2016) to within-firm internal organization (Bloom et al., 2012). The CEO’s bilateral trust measurebitrustdcis available for CEOs whose ethnic origins are among the
16 surveyed countries, which comprise 45% of the CEO name-matched sample (details in appendix A.2.4).
1.3.3 Baseline sample
To construct the baseline sample, I combine patent data from PATSTAT and CEO data from BoardEx with US public firms’ performance data from Compustat, excluding firms in the financial sector and those whose headquarters are outside of the US. For practical purpose, I only consider firms with at least one name-matched CEO55 and further restrict the sample to firms and CEOs for which all key variables are non missing. This results in a final baseline sample of 3,598 US public firms and corresponding 5,753 name-matched CEOs, with 29,384 firm by year by CEO observations during the period between 2000 and 2011 (see Table A.3). About 60% of these firms are R&D performing firms and patenting firms, sharing among them 700,000 patent applications between 2001 and 2012. Separately, about two thirds of the firms have more than one CEOs during this 12-year period, with an average of 1.7 name-matched CEOs each firm. 98% of the CEOs are male, each CEO has an average tenure of 7 years, and very few CEOs are the chief executive of more than one Compustat firm.
1.4
Within-firm effect of CEO’s generalized trust
1.4.1 Within-firm empirical strategy
I first consider a difference-in-differences specification with firm fixed effects:
asinh(patf d,t+1) = β1trustf dt+Xf t+Zdt+θf +ωt+εf dt. (1.5)
Each observation represents a firm f in a yeartwith its current CEOd. patf d,t+1is firm
f’s forward patent application counts in year t+1.56 As patent distribution is skewed, I use the inverse hyperbolic sine transformation asinh(patf d,t+1) as the main outcome
54Unlike the GSS, Eurobarometer surveys are conducted among residences of European countries.
However, given the discussed evidence of intergenerational transmission of trust attitude, it seems reasonable to use the Eurobarometer-based bilateral trust measure as a proxy for the bilateral trust among descendants of US immigrants.
55These firms comprise 92% of the firm sample and are mechanically larger than the remaining 8%.
variable instead of raw patent counts (following Card and DellaVigna, 2017).57, 58 The main explanatory variable trustf dt is the time-invariant measure of CEO d’s inherited
trust attitude, which also corresponds to researchers’ perception of CEO d’s trust attitude (details in subsection 1.3.2). To facilitate interpretation,trustf dt is standardized
by its standard deviation at ethnic level.59 The specification includes a full set of firm fixed effects θf, which helps control for all firm-level time-invariant characteristics that
are correlated with either firms’ innovation capability or selection of CEO. In addition, equation 1.5 also includes controls for firm’s time-variant characteristicsXf t (i.e., firm’s
age, log(assets), log(sale)), CEO’s time-variant characteristicsZdt(i.e., CEO’s age, gender,
education dummies, tenure in firm), and a set of year fixed effectsωt that accounts for
macro-level cyclicality in innovation. Standard errors are clustered by CEO’s main ethnic origin in case there are idiosyncratic factors that are specific to an ethnicity.60 Alternative specifications that (i) further include controls for employment and R&D stocks or flows, (ii) employ additional industry-by-year fixed effects, or (iii) apply two-way clustering by CEO’s main ethnic origin and firm all yield quantitatively similar results.
The coefficient of interest β1 estimates the effect of CEO’s trust on firm’s patents. With the inclusion of firm and year fixed effects, equation 1.5 identifiesβ1from changes in CEOs and subsequent changes in patenting within the same firm over time. The difference-in-differences identifying assumption requires that the trend in potential outcomes be mean-independent from changes in CEO’s trust, conditional on covariates. Under this identifying assumption of common trends,β1can be interpreted as the causal effect of CEO d on firm f’s patents.61 That is, the effect captured by β1 is unlikely to be the result of reverse causality or confounded by firm f’s time-variant unobservable characteristics that affect both the firm’s choice of CEO and its innovation outputs (e.g., changes in firm’s strategy driven by the board).
To formally test for common trend, I regress the change in CEO’s trust in each CEO transition event on firm’s patent application counts in different years before the transition, controlling for pre-change firm’s and CEO’s characteristics. The resulting coefficients are all small and not statistically different from zero, indicating that there is no association between firm’s pre-change patenting and subsequent change in CEO’s
57The inverse hyperbolic sine transformation asinh(x) = ln(x+√1+x2) takes value 0 atx =0 and
approximates lnx+ln 2+O( 1
xlnx)for largex. It has been promoted as a substitute for ln(x+1)by David
Card, because one can still interpret changes in asinh(x) as close approximates of percentage changes in
x for sufficiently large x thanks to its similarity with lnx, while the function’s behavior around x = 0 approximates ln(1+x) +O(x2).
58Results are robust to (i) using log(1+pat
f,t+1), winsorized, or rawpatf,t+1as the outcome variable,
(ii) estimating a semi-log Poisson count model withpatf,t+1as the outcome variable, instead of OLS. 59Inherited trust’s standard deviation at ethnic level is 0.11. This equals the difference between Greek
and English inherited trust levels.
60CEO d’s main ethnic origin is e∗
trust (Figure 1.2).62 In addition, Figure 1.3 plots the average patent application counts by the number of years before the transition for the full sample of firms.63 The flat pre-trend in patents suggests that the timing of the CEO transition is not driven by a trend in patenting, which implies that reverse causation is unlikely to be a concern in this setting.
1.4.2 Baseline effect of CEO’s trust on firm’s patents
Figure 1.4 presents the paper’s key empirical finding visually with an event-study plot of firms’ patent application counts by year with respect to CEO transition year (i.e., year 0). The solid blue line groups together all CEO transitions in which the new CEOs are more trusting than their predecessors (i.e., trust-increasing transitions), and the dotted red line corresponds to those in which the new CEOs are lesstrusting (i.e, trust-decreasing transitions).64 The two lines exhibit similar pre-trends in the years before CEO transitions, but diverge visibly post-CEO change.65 Firms that experience an increase in CEO’s trust after the transition also experience increases in patenting in post-transition years (i.e., the upward-sloping solid line) and vice versa (i.e., the downward-sloping dotted line). In addition, Table A.5 shows that while the difference in average pre-transition patents between these trust-increasing and trust-decreasing CEO transitions is small and not statistically different from zero (by matching), the difference in their post-transition patents is large, positive, and statistically significant at 5% level. Figure 1.4 suggests that CEO’s trust does have a considerable effect on firm’s innovation. Table 1.1 then estimates equation 1.5, which exploits changes in CEOs and sub-sequent changes in patenting within the same firm over time, using the full baseline sample described in subsection 1.3.3. Given evidence of common trend (see subsection 1.4.1), the coefficient on CEO’s trust captures its effect on firm’s forward patent count. I first report two basic specifications without any firm or CEO controls (column 1) or without firm controls that could also be outcomes of CEO’s trust, such as assets and
62Figure 1.2 plots the coefficients ˆ
γk for k ∈ [−6,−1] from estimating: ∆trustf dt =
∑−1
k=−7γk(asinh(patf dt)×eventt−k) +βtrustf dt+Xf t+Zdt+ωt+εf dt, in which (i) ∆trustf dt is the
difference between CEO d’s and her successor’s trust measures, (ii)eventt−k is an indicator equal to 1
if the transition happens in yeart−k, and (iii)Xf tadditionally includes a full set of firm’s 3-digit industry
dummies.
63Figure 1.3 plots the coefficients ˆ
γk fork∈ [−7,−2]relative to ˆγ−1 from estimating: asinh(patf dt) =
∑−1
k=−7γkeventt−k+Xf t+Zdt+θf+ωt+εf dt, in whicheventt−kis an indicator equal to 1 if the next CEO
transition happens in yeart−k.
64To plot Figure 1.4, I first (i) partial out the covariates by regressing patent application counts on
firm’s and CEO’s controls with firm’s industry and year fixed effects, then (ii) average the residuals by year separately for each group of CEO transitions, and finally (iii) normalize these annual averages to their respective group’s pre-transition mean. I restrict the sample to CEO transitions in which both predecessor’s and successor’s tenures are at least 5 years, so that the plotted patent trends are not driven by changes in firm composition. Furthermore, to address possible mean reversion, each trust-increasing transition is matched to a trust-decreasing transition based on their average pre-transition residual patent counts.
65Similar event-study plot using all CEO transitions that meet the CEO tenure restriction (Figure A.1)
sale (column 2). Column 3 then prese