2017 3rd International Conference on Electronic Information Technology and Intellectualization (ICEITI 2017) ISBN: 978-1-60595-512-4
An Image-based Canopy Reconstruction
Framework for Field Maize
Weiliang Wen, Chuanyu Wang, Xinyu Guo*, Xianju Lu
and Tingting Qian
ABSTRACT
Plant canopy reconstruction is the fundamental and central problem of functional-structural plant modeling. In order to reconstruct geometric models of plant canopy by real-time image driving, this paper proposes a framework of image-based maize canopy modeling. The framework builds field image and meteorological data acquisition system to acquire real-time information of plant canopy, then extracts plant growth position and plant azimuthal plane of each plant in the canopy. Morphological parameters of plants are generated using crop model. Finally, geometric model of target canopies are reconstructed by parametric modeling and self-regulating from the image extracted coverage parameter. Experimental results shows that the average coverage error of five treatment maize canopies is 2.57% and LAI errors are smaller than ±1%. Light distribution verification average error of five canopies is 8.02%. This framework will provide technical support for maize field growth analysis and decision making based on Internet of things.
KEYWORDS
Maize Canopy, 3D Reconstruction, Image Segmentation, Light Distribution. ________________________
Weiliang Wen, Chuanyu Wang, Xinyu Guo*, Xianju Lu. Beijing Research Center for Information Technology in Agriculture, Beijing, China;
Weiliang Wen, Chuanyu Wang, Xinyu Guo*, Xianju Lu. National Engineering Research Center for Information Technology in Agriculture, Beijing, China;
Weiliang Wen, Chuanyu Wang, Xinyu Guo*, Xianju Lu. Beijing Key Lab of Digital Plant, Beijing, China, 100097.
INTRODUCTION
Crop canopy is the organization system which performs photosynthesis and matter production function. Its morphological structure has important influence on light interception ability, canopy photosynthetic efficiency and crop yields. The morphological characteristics of crop canopy have always been the most basic way for people to recognize, analyze and evaluate crops. However, the morphological structure of crop canopy has the characteristics of high complexity, poor spatial distribution regularity, high organ surface structure variability, and there are a large number of organs with occlusion, intersection and interaction. Therefore, the morphological structure of crop canopy is not a physical process of simple replication. Three-dimensional (3D) modeling of crop canopy is a hot issue for digital plant[1], functional structural plant modeling (FSPM)[2; 3], and plant phenotyping[4]. Therefore, it is of great practical significance to rapidly and accurately model and analyze the morphology and structure of crop canopy.
Morphology study on traditional agriculture for crop canopy were mainly based on experience experiments of manual measurements, image analysis[5], or remote sensing[6], it is difficult to accurately describe the morphological differences caused by crop varieties, planting density, and artificial managements. Constructing accurate 3D models of crop canopy is an effective way for describing the detail positions of each organ in the canopy. However, interactively modeling of plant canopy or plant replication directly is difficult to reflect the agronomy differences[7], while 3D reconstruction using 3D digitization data of plants is time consuming[8]. The main difficulty of constructing 3D canopy model is that it is hard to acquire sufficient morphological data of plants in the canopy.
There are lots of cameras in the field which could provide a large amount of information for 3D canopy modeling, calibration, and verification. So by integrating the technology and methods of image processing, computer graphics, statistics, and agriculture, we proposed an image-based framework for field maize canopy reconstruction.
DESIGN GOALS AND FRAMEWORK REQUIREMENTS
(3D) model of maize canopy has high sense of reality, and can be used for functional structural analysis of maize.
DESCRIPTION OF THE FRAMEWORK
The Framework Architecture
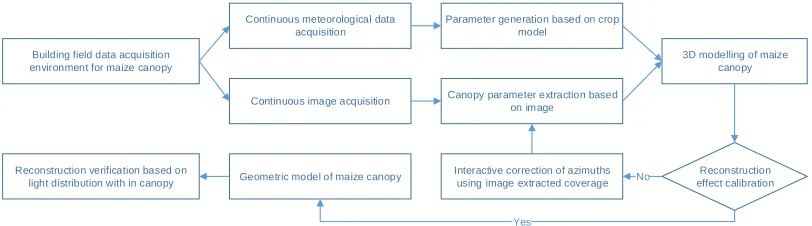
Figure 1 illustrates the image-based maize canopy reconstruction framework structure. Firstly, the data acquisition environment was set up in the field before planting the maize, including field image and meteorological condition acquisition devices. Using these devices, the maize growth continuous image sequence and meteorological data were obtained. The maize canopy parameters were extracted based on the continuous images, and the plant parameters were generated by using meteorological data combined with crop model. Then the geometric model of maize canopy was generated and was calibrated by the coverage of real-time image. Finally, the reconstructed results were verified by the light distribution calculation.
Building field data acquisition environment for maize canopy
Continuous image acquisition Canopy parameter extraction based on image
3D modelling of maize canopy
Reconstruction effect calibration Interactive correction of azimuths
using image extracted coverage Geometric model of maize canopy
Reconstruction verification based on
light distribution with in canopy No
Yes
Continuous meteorological data acquisition
Parameter generation based on crop model
Figure 1. The frame structure.
Image Acquisition
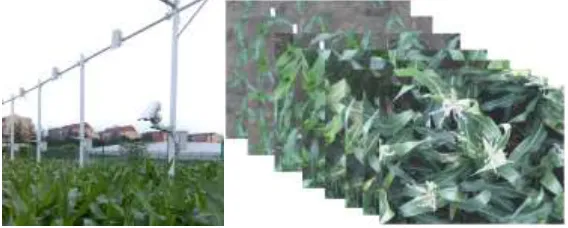
Before the maize is sowed, the camera supporting device is set up in the field, and the image acquisition device is installed on the corresponding cell. The image sensor is 5 meters high above the ground, so as to obtain the image of the whole growth period of the canopy. The image acquisition device is connected to the server through the web bridge, and the acquired images are sent to the server in real time. The image sensors are photographed vertically downward and fixed without rotation, which ensures the continuity of the monitored maize canopy. The image acquisition devices are used to acquire the continuous image of the target cell, and the acquisition interval is set up to 1 hours. Figure 2 shows the image acquisition device and continuous image sequence obtained.
[image:3.612.99.505.340.453.2]Figure 2. Field image acquisition device and sequential image sequence obtained.
Figure 3. Plant growth position and plant azimuthal plane extraction using image at jointing stage of maize canopy.
Image-based Canopy Parameter Extraction
Parameter Generation Based on Crop Model
Crop growth is highly correlated with environmental factors, so crop model can be used to generate important plant morphological parameters which are difficult to extract from images. A small meteorological station was set up in the field to obtain the meteorological data such as air temperature, humidity, solar radiation and rainfall during the whole growth period of maize. Using these meteorological data, combined with soil parameters, variety genetic parameters and cultivation management measures, the plant height parameters of different growth stages in target plot were generated by CERES-Maize model[10]. On this basis, the plant morphological parameters of each leaf were obtained through the statistical model of phytomer relationship constraint, including the leaf height, leaf inclination angle and azimuth angle of each unit, which deviated from the plant azimuth plane angle, leaf length and leaf width.
3D Canopy Reconstruction
[image:5.612.101.501.451.532.2]Geometric model of individual plants in the target canopy was generated by combining the parametric geometric modeling method[11] of maize and defined similarity measurement function to search the maximum similarity of organ template from the 3D template resource database of maize organs[12][13], after the morphological parameters of each plant were obtained. According to the growth position and azimuthal plane of each plant in the maize canopy extracted by image extraction, the plants were placed in the specified position and direction within the canopy by rotation and translation, and the geometric model of maize population was obtained.
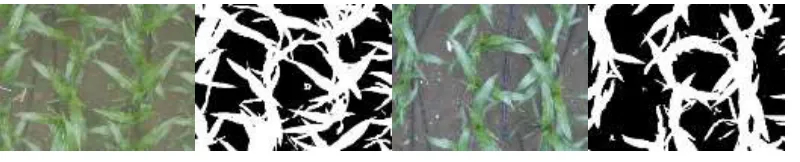
Figure 4. Image segmentation of field maize canopy.
than a predetermined threshold value, the current geometric model was considered to be the final maize canopy model.
RESULTS
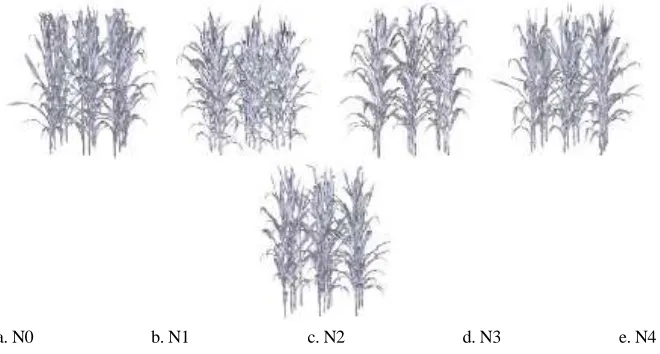
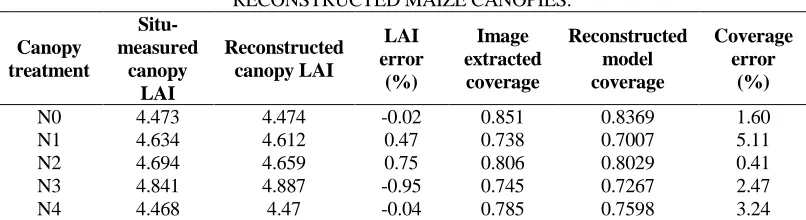
In order to evaluate the accuracy of 3D reconstruction of maize canopy, five nitrogen treatments maize canopies were applied to conduct the experiment. The cultivar is Zhengdan 958 with the density of 4000 plant/mu, and was sowed on May 12th in experimental farm of Beijing Academy of Agriculture and Forestry Sciences. The five nitrogen treatment is 0kg ha-1(N0), 75 kg ha-1(N1), 150 kg ha-1(N2), 225 kg ha-1(N3), and 300 kg ha-1(N4) respectively. The canopies are irrigated according to requirement during growth period to promise the morphometrics of the canopies are not affected by water stress. The fertilizer is urea and was applied for two times, 50% as starter treatment and 50% at eight leaf stage. Phosphate fertilizer is superphosphate, and the application amount is 85kg ha-1. Potassium fertilizer was potassium chloride, and the amount of application was 67.5kg ha-1. Phosphate and potash were all applied once before planting. Jointing stage maize canopy images of five target canopies in July 12th were selected to extract the plant growth position and plant azimuthal plane. 3D digital data of three silking stage maize plants for each canopy were obtained on August 30th and 31th. On the basis of the digitization data of plants, five maize canopy models formed using replication domain method, and leaf area index (LAI) was calculated which was considered as the actual LAI for verification. The framework also generated five corresponding geometric models, see Figure 5. The verification result of LAI and coverage is shown in Table I. The average coverage error of five treatment canopies is 2.57% and LAI error is smaller than ±1%.
[image:6.612.134.464.471.648.2]a. N0 b. N1 c. N2 d. N3 e. N4
TABLE I. LAI AND COVERAGE VERIFICATION OF RECONSTRUCTED MAIZE CANOPIES.
Canopy treatment
Situ-measured
canopy LAI
Reconstructed canopy LAI
LAI error
(%)
Image extracted coverage
Reconstructed model coverage
Coverage error
(%)
N0 4.473 4.474 -0.02 0.851 0.8369 1.60
N1 4.634 4.612 0.47 0.738 0.7007 5.11
N2 4.694 4.659 0.75 0.806 0.8029 0.41
N3 4.841 4.887 -0.95 0.745 0.7267 2.47
N4 4.468 4.47 -0.04 0.785 0.7598 3.24
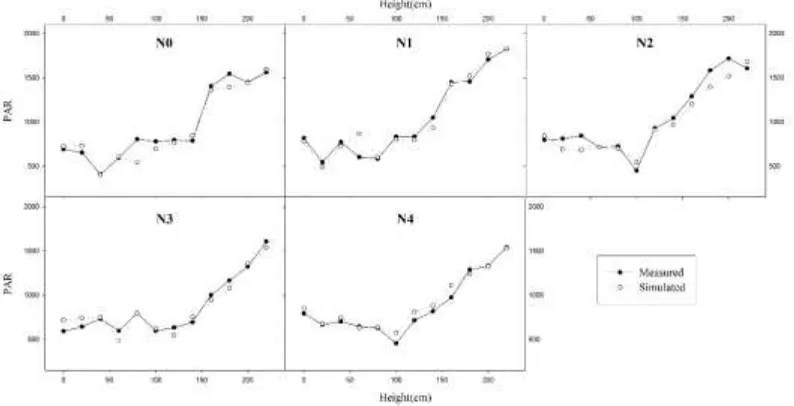
The reconstructed geometric model of maize canopies were also verified by light distribution method. On September 6th, which is a sunny day, we measured light distribution of each target canopy using AccuPAR along the row direction every 20cm height. Using the measured light environment and the reconstructed canopy models, and combined with light distribution simulation algorithms, light distribution within the canopy was calculated. The simulation outputs visual photosynthetically active radiation (PAR) of the same measured position. Figure 6 shows the result of measured and simulated light distribution of five treatment canopies. The average error is 8.02%.
CONCLUSIONS
Figure 6. Validation of light distribution within the reconstructed maize canopies.
ACKNOWLEDGEMENTS
This work was supported by the National High Technology Research and Development Program of China (2013AA102305), the National Natural Science Foundation of China (31601215), the Beijing Academy of Agricultural and Forestry Sciences Youth Research Fund (QNJJ201625), and the Scientific and Technological Innovation Team of Beijing Academy of Agricultural and Forestry Sciences (JNKYT201604).
REFERENCES
1. Zhao, C., Lu, S., Guo, X., Xiao, B., and Wen, W. 2010. "Exploration of digital plant and its
technology system". Sci Agr Sinica, 43(10), 2023-2030.
2. Vos, J., Evers, J., Buck-Sorlin, G., Andrieu, B., Chelle, M., and De Visser, P. 2010. "Functional–
structural plant modelling: a new versatile tool in crop science". J Exp Bot 61(8), 2101-2115.
3. Henke, M., Kurth, W., and Buck-Sorlin, G.H. 2016. "FSPM-P:towards a general
functional-structural plant model for robust and comprehensive model development". Frontiers of Computer
Science, 6, 1-15.
4. Tardieu, F., Cabrera-Bosquet, L., Pridmore, T., and Bennett, M. 2017. "Plant Phenomics, From
Sensors to Knowledge". Curr Biol, 27(15), R770-R783.
5. Cescatti, A. 2007. "Indirect estimates of canopy gap fraction based on the linear conversion of
hemispherical photographs - Methodology and comparison with standard thresholding
techniques". Agr Forest Meteorol, 143(1-2), 1-12.
6. Potgieter, A.B., George-Jaeggli, B., Chapman, S.C., Laws, K., Cadavid, L.A.S., Wixted, J.,
Watson, J., Eldridge, M., Jordan, D.R., and Hammer, G.L. 2017. "Multi-Spectral Imaging from an Unmanned Aerial Vehicle Enables the Assessment of Seasonal Leaf Area Dynamics of
7. Guo, Y., Ma, Y.T., Zhan, Z.G., Li, B.G., Dingkuhn, M., Luquet, D., and De Reffye, P. 2006. "Parameter optimization and field validation of the functional-structural model GREENLAB for
maize". Ann Bot, 97(2), 217-230.
8. Xiao, B., Wen, W., and Guo, X. 2011. "Digital plant colony modeling based on 3D digitization".
ICIC Exp letters, 2(6), 1363-1367.
9. Liu, Y.K., Mu, X.H., Wang, H.X., and Yan, G.J. 2012. "A novel method for extracting green
fractional vegetation cover from digital images". J Veg Sci, 23(3), 406-418.
10. Jones, J.W., and J.R., K. (1986). CERES-Maize: a simulation model of maize growth and
development. (College Station: T&M University press).
11. Lu, S., Guo, X., Wen, W., Xiao, B., Wang, C., Du, J., and Zhao, C. 2014. "PlantCAD:an
Integrated Graphic Toolkit for Modeling and Analyzing Plant Structure". In Proceedings of the
2014IEEE International Conference on Progress in Informatics and Computing, 378-384.
12. Wen, W., Guo, X., Wang, Y., Zhao, C., and Liao, W. 2017. "Constructing a three dimensional
resource database of plants using measured in situ morphological data". Appl Eng Agric, 33(5),
1-10.
13. Wen, W., Guo, X., Lu, X., Wang, Y., Zhao, D., and Liao, W. 2016. "Three-dimensional template