R E S E A R C H A R T I C L E
Open Access
Identifying classes of persons with mild
intellectual disability or borderline
intellectual functioning: a latent class
analysis
Peter J. G. Nouwens
1*, Rosanne Lucas
1,2, Nienke B. M. Smulders
1,2, Petri J. C. M. Embregts
1,3,4and Chijs van Nieuwenhuizen
1,5Abstract
Background:Persons with mild intellectual disability or borderline intellectual functioning are often studied as a single group with similar characteristics. However, there are indications that differences exist within this population. Therefore, the aim of this study was to identify classes of persons with mild intellectual disability or borderline intellectual functioning and to examine whether these classes are related to individual and/or environmental characteristics.
Methods:Latent class analysis was performed using file data of 250 eligible participants with a mean age of 26.1 (SD13.8, range 3–70) years.
Results:Five distinct classes of persons with mild intellectual disability or borderline intellectual functioning were found. These classes significantly differed in individual and environmental characteristics. For example, persons with a mild intellectual disability experienced fewer problems than those with borderline intellectual disability.
Conclusions:The identification of five classes implies that a differentiated approach is required towards persons with mild intellectual disability or borderline intellectual functioning.
Keywords:Mild intellectual disability, Borderline intellectual functioning, Intellectual disability, Latent class analysis, Heterogeneity, Profiles
Background
Persons with a mild intellectual disability (MID; intelligence quotient (IQ) range 50–69) or borderline intellectual
func-tioning (BIF; IQ range 70–85) are vulnerable for problems
in different domains. For instance, compared to individuals with an average IQ level, persons with MID or BIF are at higher risk to develop mental health, behavioral and academic problems, and are more likely to experience socio-economic disadvantages [1, 2]. The presence of such problems implies that persons with MID or BIF are also more vulnerable for a poorer quality of life [1, 2] and even exclusion from society [3]. To avoid these risks,
adequate and timely support is required that meets the support needs of these individuals [4].
Determination of the level of support needs of persons with MID or BIF is still largely based on IQ [5–7]. However, according to the American Association on Intellectual and Developmental Disabilities (AAIDD), a multidimensional perspective is needed that focuses on the additional per-sonal and environmental characteristics which impact the support needs of persons with an intellectual disability (ID) [1, 5, 8]. Given the vulnerability of persons with MID or BIF (apart from their lower IQ), they are in particular need of such a multidimensional perspective. Indeed, according to Soenen, Van Berckelaer-Onnes and Scholte [4] persons with MID or BIF display a range of problems which cannot be identified on the basis of the IQ-criterion alone. There-fore, insight into the support needs of persons with MID or * Correspondence:[email protected]
1Tranzo Department, Tilburg School of Social and Behavioral Sciences,
Tilburg University, Tilburg, the Netherlands
Full list of author information is available at the end of the article
BIF is limited when the personal and environmental charac-teristics are not taken into account [2, 4].
In many studies persons with MID or BIF are investi-gated as a single group having comparable personal and environmental characteristics [5]. However, there are in-dications that for persons with MID or BIF differences exist in both personal and environmental characteristics. Regarding personal characteristics, persons with MID or BIF face a great diversity of comorbid psychopathologies,
e.g. Autism spectrum disorders [9–12], attention deficit
hyperactivity disorder [13–15], and substance use
disor-ders [16–18]. Concerning environmental characteristics,
persons with MID or BIF come from a wide range of family backgrounds [19]. For example, whereas some persons with MID or BIF come from a supportive family, others have been confronted with inconsistent parenting and even maltreatment and abuse [19, 20]. Also, besides differences in personal and environmental characteris-tics, there are differences in the type of professional care received by persons with MID or BIF. For example, they are not only supported within the care for people with an intellectual disability, but are also widely represented in other service systems, such as youth services, criminal
justice systems, and mental health-care [21–25]. Given
these differences in characteristics and professional care, it is not surprising that variability exists in the support needs within this population [4, 19].Thus, the diversity within the population of persons with MID or BIF sug-gests possible heterogeneity and, consequently, the need for a differentiated approach. Better insight and under-standing of this heterogeneity can help in attempts to develop more individualized support programs meeting the support needs of persons with MID or BIF [19].
Until now, only a few studies have explored potential heterogeneity in persons with MID or BIF, e.g. by identify-ing classes [5, 22]. For example, Soenen et al. [5] identified four classes of persons with MID, based on the level of in-tellectual, adaptive and behavioral functioning. Further-more, Douma, Dekker, De Ruiter, Tick, Koot and Bodfish [22] used latent class analysis and identified six unique classes of youngsters with MID or BIF with antisocial and delinquent behaviors. Until now, no studies have focused on heterogeneity in personal and environmental factors in persons with MID and with BIF, through all age groups. Therefore, the present study aims to identify unique classes of persons with MID or BIF based on personal and environmental characteristics.
Methods
Participants
Data were collected from 250 persons with MID (IQ
range 50–69) or BIF (IQ range 70–85). Participants were
individuals referred to an organization that offers long-term inpatient/outpatient care to persons with an
intellectual disability, in the southern part of the Netherlands. To define the IQ scores of each participant, from their personal case file the most recent score of an IQ test, established by a certified diagnostician (e.g. a psychologist), was used. These age-related tests included, for instance, the Dutch versions of the Wechsler Pre-school and Primary Scale of Intelligence, WPPSI-III-NL [26], the Wechsler Intelligence Scale for Children-Third edition, WISC-III-NL [27], and the Dutch version of the Wechsler Adult Intelligence Scale-Third edition, WAIS-III-NL [28]. Excluded from the study were persons who: (i) already received care from the care provider being investigated, (ii) were referred for short-term support (e.g. respite care or crisis care), or (iii) were referred for temporary support because they were waiting for sup-port from another care provider.
The population of potential participants consisted of 525 persons with MID or BIF who were referred to the care provider being investigated between January 2011 and August 2012. In latent class analysis, the number of subgroups within a sample is partially dependent on sample size [29, 30]. As the number of subgroups tends to plateau with sample sizes of around 200 [30, 31], from the population of 525 persons a random sample of 250 participants was selected for the present study.
The representativeness of the sample was checked in two ways. First, the population receiving services from the care provider being investigated was compared with the population receiving services from the intellectual disability sector in the Netherlands as a whole. Using a
χ2-test, the distribution of the various Care Intensity
Packages in the clients from this care provider was compared with the distribution in the whole intellectual disability sector [32]. In the Netherlands, long-term care for persons with an intellectual disability is provided under the terms of the Exceptional Medical Expenses Act (AWBZ) and access to support requires a statement of need. Care Intensity Packages are an expression of support needs. At the time of data collection for the present study, the Care Intensity Package for an individ-ual was determined by an independent organization (called the CIZ) on a nationwide basis, using objective criteria. No significant differences were found, indicating that the clients of the care provider being investigated were representative of the population receiving care in the intellectual disability sector in the Netherlands. Second, the representativeness of the sample of 250 re-spondents was examined a posteriori by comparing the
gender (χ2(1) = 0.32, p = 0.57), age (t(773) = 0.66,
p = 0.51), and level of development (χ2(1) = 0.01,
p= 0.92) of participants with the initial group of eligible
persons (N = 525). As no significant differences were
The selected sample consisted of 250 persons, with significantly more males (60.8%) than females (39.2%) (χ2(1) = 245.82, p < 0.001) and a mean age of 26.1 (SD
13.8; range 3–70) years. The age category with the
high-est frequency was 11–20 years (39.2%), followed by the
age categories 21–30 (21.6%), 31–40 (13.6%), 41–50
(10.4%), 51–60 (3.6%), and 61–70 years (2.8%). A signifi-cantly higher proportion of participants had BIF (56.5%/
n = 141) than MID (43.6%/n = 109) (χ2(1) = 245.95,
p< 0.001). All included persons had significant intellec-tual limitations and adaptive behavior problems, as based on a valid CIZ (Care Needs Assessment Center) in-dication. The CIZ organization uses objective criteria (on a nationwide basis) to determine whether there is a signifi-cant limitation in intellectual and adaptive functioning.
Measures
A retrospective descriptive design was used. Data were provided by professionals from referring organizations and all the case files contained standardized information from the independent organization, the CIZ. Further-more, most of the case files consisted of intake reports, anamnesis, support history, former support plans and evaluations, and psychological reports. These case files were analyzed using a structured case analysis system based on the Signaling List [33] and on studies by Schalock et al. [34] and Van Nieuwenhuizen et al. [35]. This resulted in a scoring list of 313 variables in the following categories: personal characteristics (subcat-egories: personal information, IQ level, diagnoses, level of education, support needs, anamnesis), family charac-teristics (subcategories: family situation and upbringing, maltreatment and abuse), contextual characteristics (subcategories: life events and treatment history). To-gether, the family characteristics and contextual charac-teristics were labeled as ‘environmental’ characteristics. The presence or absence of these characteristics was based on concrete signals or references in the case files. In addition, the person providing the information was of
particular importance regarding the variables ‘problem
behavior’ and ‘DSM-IV diagnosis’. For these two
vari-ables, the information had to be provided by a certified clinician (e.g. a psychiatrist or a clinical psychologist). The researchers scored the same case files separately until an inter-rater agreement of at least 80% was
achieved; Cohen’s kappa was used to rate the inter-rater
agreement for the dichotomous variables (n= 75). After
the same three case files had been coded separately, the researchers did reach an inter-rater agreement of at least 80% and a Cohen’s kappa of > 0.70, indicating appropri-ate rappropri-ater agreement. After reaching a good inter-rater level, the case files analysis was performed by three researchers independently.
Procedure
Due to the vulnerability of the persons in the study group, we deliberately selected a retrospective case ana-lysis that did not require an active participation or action of the participants. According to the Dutch Act on Medical Treatment Agreements (article 7: 458) the fol-lowing strict conditions permit a retrospective case ana-lysis without ethical approval: (a) the study is of general interest, (b) the study cannot be conducted without the requested information, (c) the participant has not ex-pressly objected to the provision of the data, and (d) the anonymity of the participant is guaranteed. We used a passive informed consent concerning the retrospective analyses of file data. In the present study, the noun‘
cli-ent’ refers to persons with an intellectual disability and
their parents or legal guardians. Correspondingly, both for minors and for adults with an intellectual disability, clients and their parents or legal guardians were actively informed about the study by means of a tailormade bro-chure. The brochure also included information about the voluntariness of the study and the anonymity of the participants. Participants could object to the provision of the data. In the brochure, it was clearly stated who the client had to contact when he/she did not want to par-ticipate in this study. Three participants of the initial
sample (N = 525) did not want to participate in the
study and were therefore excluded. The names of all the participants were replaced by unique numbers to guar-antee anonymity. The names of the participants and their unique numbers were registered in a separate Excel file, which was locked with a password and stored in a protected environment.
Although according to the Dutch ‘Agreement on
Medical Treatment’Act (Article 7: 458) no ethical
ap-proval was needed for the purpose of this study, several additional steps were taken regarding the ethical aspects due to the vulnerability of the participants and the level of precision that we aimed to achieve. A priori the Client Advisory Board of Prisma (i.e. the organization where the study took place) was informed. The Client Advisory Board of Prisma has a legal status on behalf of the law
‘Engagement Clients in Health Facilities’ (WMCZ in the
were actively informed about this study and all acknowl-edged the importance and relevance.
Data analysis
Latent class analysis
The software program Latent GOLD (version 4.5) was used to perform a latent class analysis [36]. Variables in-cluded in the latent class analysis were chosen based on the socio-ecological person-environment fit conception [6], and literature on common risk factors for persons
with MID or BIF [1, 13, 20, 37–40]. As a consequence,
14 variables from the initial scoring list of 313 variables were included in the latent class analysis, divided into two higher categories: environmental variables and
per-sonal variables. The category ‘environmental variables’
consisted of two subcategories: (1) family variables and (2) contextual variables; variables were scored as ei-ther present or absent. Family variables were: divorce of parents, financial problems of parents, mental health problems of parents, harassment by primary caregiver, sexual abuse by primary caregiver, and in-consistent parenting. The contextual variables were: no informal support from friends and/or family, and difficulty with connecting to peers.
The following‘personal variables’were included: finan-cial problems, daytime activity, alcohol and/or drug ad-diction, problem behavior, prison sentence, and the Diagnostic and Statistical Manual of Mental Disorder-IV (DSM-IV) classification [41].
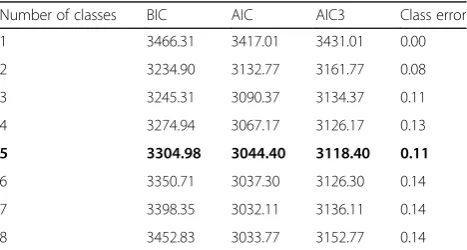
[image:4.595.305.539.597.722.2]Latent class analysis was used to identify classes of re-lated persons. Briefly, latent class analysis examines the underlying structure of categorical data using probabilistic methods to assign an individual to a class, which is based on the individual’s most likely membership (see, e.g. [42]). The first step in latent class analysis is to define the number of classes that contain distinctive classes. Class membership was based on the personal variables, family variables and contextual variables described above. To de-termine the most appropriate latent class model, as well as the number of classes, the Akaike’s Information Criter-ion (AIC) with a per-parameter penalty factor of 3 (AIC3) was used. The AIC3 is a relative indicator model of fit, with lower values indicating better fit of the model to the data. The AIC3 was chosen because of the categorical var-iables included and due to the relatively small sample size [36, 43, 44]. The best fitting class solution was chosen based on the lowest AIC3 score, class error around 10% and bivariate residuals≤4, since bivariate residuals≥4 in-dicate a possible correlation between the variables.
Class membership comparison
In a second step, class membership in relation to vari-ables other than the varivari-ables already included in the la-tent class analysis, was analyzed to define the different
classes in more depth using SPSS 19.0, PC. Since the collected data consisted of categorical variables, a
one-way analysis of variance (ANOVA) was conducted (F
-ra-tio). When the overall one-way ANOVA was significant,
post-hoc tests were performed to analyze significant dif-ferences between the different classes. The Bonferroni-correction was employed to correct for the problem of multiplicity used to indicate statistical significance.
Results
Latent class analysis
Regarding the latent class analysis, solutions for 1–8
classes are presented in Table 1.
AIC3 values decreased across solutions containing 1–5
class solutions, suggesting that the five-class solution best fitted the data. The class error for the five-class solution was also lower than for the six-class solution. Furthermore, the values of the bivariate residuals were near zero and close to each other, indicating no correl-ation between the different variables. The outcome of these indicators indicated that a five-class solution was the best explanation for the underlying structure of the data.
Class description
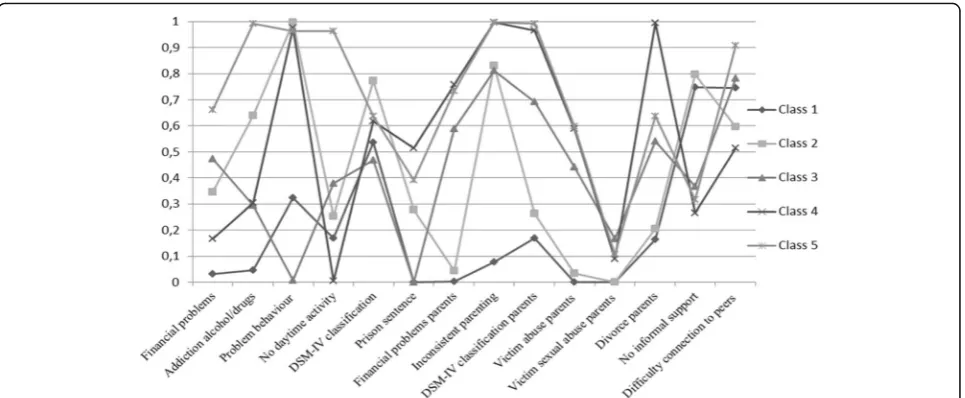
Figure 1 shows the probability of the presence of the personal and environmental (family and contextual) vari-ables included in the latent class analysis for each of the five classes. Class 1 (n= 85) represented the largest class (34.0%); given that this was the only class characterized
by more persons with MID (n = 55) than with BIF
(n= 30), Class 1 was labelled as‘Persons with mild intel-lectual disability’. Class 2 (n= 51) included 20.4% of the sample; in this class, 18 individuals had MID and 33 BIF. All persons in this class (100%) showed problem behav-ior, resulting in the label ‘Males with problem behavior’.
Class 3 (n= 47) comprises 15 persons with MID and 32
with BIF; this class accounted for 18.8% of the sample and consisted of persons who had the highest score on sexual abuse by parents, and high scores on personal
Table 1Fit statistics for Latent Class Analysis (n= 250)
Number of classes BIC AIC AIC3 Class error
1 3466.31 3417.01 3431.01 0.00
2 3234.90 3132.77 3161.77 0.08
3 3245.31 3090.37 3134.37 0.11
4 3274.94 3067.17 3126.17 0.13
5 3304.98 3044.40 3118.40 0.11
6 3350.71 3037.30 3126.30 0.14
7 3398.35 3032.11 3136.11 0.14
8 3452.83 3033.77 3152.77 0.14
financial problems and financial problems of parents. As
a result, Class 3 was labeled‘Persons with material
hard-ship and abuse by parents’. Participants in Class 4
(n= 37) included 14.8% of the sample and had the
low-est average age; this class comprises 10 individuals with MID and 27 with BIF. Because this class was character-ized by persons with high scores on problem behavior
and family variables, this group was labelled ‘Male
youngsters with problem behavior and family problems’.
Class 5 (n = 30) included 12% of the sample and
con-sisted of persons with high scores on all included vari-ables, especially on the variable addiction to alcohol
and/or drugs, resulting in the label‘Persons with
addict-ive problems’. This class includes 13 individuals with
MID and 17 with BIF.
Class comparison
The presence of the personal and environmental (family and contextual) variables showed a significant difference between the five classes (see Additional file 1). These class differences are described below.
Concerning the personal variables, the five classes showed a significant difference in mean age and gender
distribution. More specifically, ‘Male youngsters with
problem behavior and family problems’ (Class 4) were
the youngest (mean age 19.1 years) and ‘Persons with
material hardship and abuse by parents’ (Class 3) were
the oldest (mean age 29.8 years). Regarding gender
distribution, only ‘Persons with material hardship and
abuse by parents’ (Class 3) consisted of more females
(68%) than males (32%).
Besides differences in mean age and gender, there were also differences in the amount of financial problems and
daytime activity. Although the prevalence of financial
problems was highest among ‘Persons with addictive
problems’(Class 5; 67%),‘Persons with material hardship
and abuse by parents’(Class 3) also had financial
prob-lems (51%). For daytime activity,‘Male youngsters with
problem behavior and family problems’ (Class 4) always
had daytime activity (100%), whereas none of the
‘Persons with addictive problems’(Class 5) had any
day-time activity (0%).
Other significant differences were found in addiction to alcohol and/or drugs, prison sentence, and DSM-IV classifications. Addiction to alcohol and/or drugs was
most prevalent in ‘Persons with addictive problems’
(Class 5; 100%) and ‘Males with problem behavior’
(Class 2; 64%). Regarding prison sentence,‘Male
young-sters with problem behavior and family problems’(Class
4) were confronted with a prison sentence (56%) signifi-cantly more often than all other classes. Finally, the prevalence of DSM-IV classifications was highest among
‘Males with problem behavior’ (Class 2; 80%) and the
lowest for‘Persons with material hardship and abuse by
parents’(Class 3; 47%).
With regard to family variables, several significant
dif-ferences were found. For instance, all parents of ‘Male
youngsters with problem behavior and family problems’
(Class 4) were divorced (100%), whereas in‘Persons with
mild intellectual disability’ (Class 1) 15% of the parents
were divorced. Furthermore, the prevalence of parental
financial problems was highest among ‘Male youngsters
with problem behavior and family problems’ (Class 4;
79%) and lowest among ‘Persons with mild intellectual
disability’(Class 1; 0%). Also, all‘Persons with addictive
problems’ (Class 5) were confronted with at least one
[image:5.595.58.541.87.286.2]primary caregiver classified with a DSM-IV diagnosis
(100%). This was also the case for most of the ‘Male
youngsters with problem behavior and family problems’
(Class 4; 96%). In contrast, of the‘Persons with mild
in-tellectual disability’ (Class 1) 20% had to deal with at
least one primary caregiver classified with a DSM-IV diagnosis.
Differences were also found with regard to sexual abuse by primary caregiver(s). For example, 18% of the
‘Persons with material hardship and abuse by parents’
(Class 3) had been a victim of sexual abuse by their
pri-mary caregiver(s), followed by ‘Persons with addictive
problems’(Class 5; 12%). ‘Persons with mild intellectual
disability’ (Class 1) and ‘Males with problem behavior’
(Class 2) had never been sexually abused by primary caregiver(s) (0%). Regarding harassment by the primary caregiver(s), the highest prevalence was found for
‘Persons with addictive problems’ (Class 5; 62%),
whereas none of the‘Persons with mild intellectual
dis-ability’ (Class 1) had been confronted with harassment
by primary caregiver(s) (0%).
Regarding the contextual variables, the five classes showed a significant difference with regard to
problem-atic connection to peers and informal support. ‘Persons
with addictive problems’ (Class 5; 89%),‘Persons with
material hardship and abuse by parents’ (Class 3; 76%)
and ‘Persons with mild intellectual disability’ (Class 1;
76%) had the most difficulty with connecting to peers
and had no friends. Furthermore, 81% of the‘Males with
problem behavior’ (Class 2) had no informal support
and for ‘Male youngsters with problem behavior and
family problems’ (Class 4) this was the case for 23% of
the persons.
Other differences were found related to the amount of contact with health-care providers, and the age at the moment health-care was first received. Compared with
the other four classes,‘Male youngsters with problem
be-havior and family problems’ (Class 4) had the most
(mean 6.5 times) contact with health-care providers be-fore referral to the care provider being investigated, and were also the youngest at the moment health-care was first received (mean age 12.5 years). Those with the least
contact were ‘Persons with mild intellectual disability’
(Class 1; mean 3.7 times), and ‘Persons with material
hardship and abuse by parents’(Class 3) were the oldest
at the moment health-care was received for the first time (mean age 23.9 years).
Discussion
In many studies, persons with MID or BIF are investigated as a single group and considered to have comparable per-sonal and environmental characteristics [5]. However, there are indications that, within these two populations,
differences exist in personal and environmental
characteristics. Therefore, a differentiated approach to-wards these individuals may be needed to acknowledge possible heterogeneity and achieve better insight into the support needs of these persons. Thus, this study investigated classes of persons with MID or BIF and identified five unique classes of persons with either MID or BIF.
In the present study, ‘Persons with mild intellectual
disability’ (Class 1) had the least personal and
environ-mental problems. Almost half of the group with MID (n= 53/48.6%) are part of this class, whereas this applies to a considerably smaller proportion of those with BIF
(n = 32/22.7%). Additionally, compared to persons with
MID, individuals with BIF are overrepresented in the classes with more personal and environmental problems. This is in line with Podesta and Radstaak [45], and Nou-wens et al. [19] who found indications that individuals with BIF, compared to those with MID, experienced more individual and family problems. Also, whereas per-sons in class 1 experienced relatively few problems, many of them experienced problems with connecting to peers, resulting in the absence of friends. This might be explained by the high percentage of the DSM-IV classifi-cation of Pervasive Developmental Disorders in this class, since features of this disorder include lack of ap-propriate social skills, leading to problems with entering into friendships [11, 46].
In ‘Males with problem behavior’ (Class 2) and ‘Male
youngsters with problem behavior and family problems’
(Class 4) personal problem behavior often co-occurred with family problems, which is in line with earlier find-ings [47]. In‘Males with problem behavior’(Class 2), the externalizing problem behavior of these persons might have placed high demands on their parents, resulting in inconsistent parenting practices [48]. In contrast, in
‘Male youngsters with problem behavior and family
problems’ (Class 4) the co-occurrence of personal and
family problems could be explained by a reciprocal rela-tionship between child and family problems, with the problem behavior of the child and parental problems having a continuous and negative influence on each other, thereby reinforcing the personal and family prob-lems [49, 50]. Although the development of child and family problems may vary between these classes, in both classes the personal and family problems need to be ad-dressed in intervention planning.
Class 3, ‘Persons with material hardship and abuse
by parents’, consisted of more women than men. The
a mood disorder, which was the most prevalent DSM-IV classification within this class [52].
Another finding of this study was that addiction was a
major problem in ‘Persons with addictive problems’
(Class 5). This supports earlier results showing that per-sons with an intellectual disability are at increased risk of substance-related problems compared to persons without an intellectual disability [16]. The absence of daytime activities for all persons in Class 5 is not sur-prising, given that problematic substance users with MID or BIF often lack daytime activities [53, 54].
Implications
The present results imply that a more differentiated ap-proach is required towards persons with MID or BIF. The identification of five classes is a first step towards a better understanding of the heterogeneity within the population of persons with MID or BIF. More specific-ally, it provides more insight into the characteristics on different domains that together influence the support needs of these persons. The differentiation of five sub-groups can be used as guidance in individual support
planning. However, further ‘fine-tuning’ of the specific
type of support within this ‘class’ is still required, since every individual with MID or BIF has his/her own unique characteristics.
Strengths and limitations
There is some evidence suggesting marked similarities between people with MID and BIF [1]. In the present study, differences were found both within and between the classes for individuals with MID and BIF. Future re-search should investigate in more detail the differences between persons with MID and BIF. In the present study, we investigated the possibility of identifying clas-ses within the population of persons with MID or BIF of all ages. However, some limitations of this study need to be addressed. Data were collected by examining case files. As the completeness of these files differed between the participants, some information may have been incomplete. In future research, file data could be
com-plemented with a person’s and his/her parents’ own
reporting of several life aspects, e.g. by use of a question-naire, or conducting an interview [55].
Another limitation concerns the quality of the available file data. For example, although we used the most recent IQ data to identify persons with MID or BIF, some of the
‘most recent’IQ data was 21 years old. Also, the IQ data
originated from diverse IQ tests. Another limitation, is that due to the incompleteness of data, some evidence risk factors could not be used in the latent class analysis (e.g. education level of parents). These aspects might have in-fluenced our results. In future research, this might be overcome by complementing file data with more recent
information on the individual’s intellectual abilities, and with additional data on relevant risk factors.
A final limitation is the wide age range. Because our sample consisted of individuals aged from 3 to 70 years, the results can only offer a general understanding of the typology within this group. Future studies should focus, e.g. on specific age groups to better examine the con-founding variable of the developmental period.
Conclusions
This study is a first step towards a better understanding of the heterogeneity within the population of persons with MID or BIF. The identification of five classes of persons with MID or BIF challenges the undifferentiated approach towards these persons and seems to confirm that more differentiated individual support is needed.
Additional file
Additional file 1: Table S2.Significant differences between the five classes of individuals with mild intellectual disability or borderline intellectual functioning (n= 250). (DOCX 18 kb)
Abbreviations
AAIDD:American Association in Intellectual and Developmental Disabilities; AIC: Akaike’s information criterion; ANOVA: Analysis of variance;
BIF: Borderline intellectual functioning; DSM: Diagnostic and statistical manual of mental disorders; ID: Intellectual disability; IQ: Intelligence quotient; MID: Mild intellectual disability; WAIS-III-NL: Dutch version of the Wechsler Intelligence Scale-Third edition; WISC-III-NL: Dutch version of the Wechsler Intelligence Scale for Children-Third edition; WPPSI-III-NL: Dutch version of the Wechsler Preschool and Primary Scale of Intelligence
Acknowledgements
The authors thank the Prisma Foundation for participation in this study and Erik Severijns for his contribution to the case file analyses.
Funding
The Prisma Foundation made this study possible in kind, by contributing support from three employees.
Availability of data and materials
The datasets used and analyzed during the current study are available from the corresponding author on reasonable request.
Authors’contributions
PN, RL and NS made substantial contributions to conception and design, acquisition of data, analysis and interpretation of data, and has been involved in drafting the manuscript. PE and CN made substantial contributions to conception and design, and has been involved in drafting the manuscript and revising it critically for important intellectual content. All authors read and approved the final manuscript.
Ethics approval and consent to participate
According to the Dutch Act on Medical Treatment Agreements (article 7: 458), ethical approval was not needed for the purpose of this study. We used a passive informed consent concerning the retrospective analyses of file data.
Consent for publication
Not applicable.
Competing interests
Publisher’s Note
Springer Nature remains neutral with regard to jurisdictional claims in published maps and institutional affiliations.
Author details
1Tranzo Department, Tilburg School of Social and Behavioral Sciences,
Tilburg University, Tilburg, the Netherlands.2Prisma Foundation, Waalwijk,
the Netherlands.3Department of Medical and Clinical Psychology, Tilburg School of Social and Behavioral Sciences, Tilburg University, Tilburg, the Netherlands.4Dichterbij Innovation and Science, Gennep, the Netherlands. 5GGzE Research Group Forensic Mental Health Care, GGzE Centre for Child &
Adolescent Psychiatry and De Catamaran, Hospital for Youth Forensic Psychiatry & Orthopsychiatry, GGzE, Eindhoven, The Netherlands.
Received: 10 January 2017 Accepted: 10 July 2017
References
1. Emerson E, Einfeld S, Stancliffe RJ. The mental health of young children with intellectual disabilities or borderline intellectual functioning. Soc Psychiatry Psychiatr Epidemiol. 2010;45(5):579–87.
2. Hassiotis A, Strydom A, Hall I, Ali A, Lawrence-Smith G, Meltzer H, Head J, Bebbington P. Psychiatric morbidity and social functioning among adults with borderline intelligence living in private households. J Intellect Disabil Res. 2008;52(2):95–106.
3. Bouck EC. The postschool outcomes of students with mild intellectual disability: does it get better with time? J Intellect Disabil Res. 2014;58:534–48. 4. Soenen S, Van Berckelaer-Onnes IA, Scholte EM. A comparison of support for two groups of young adults with mild intellectual disability. Br J Learn Disabil. 2016;44:146–58.
5. Soenen S, Van Berckelaer-Onnes I, Scholte E. Patterns of intellectual, adaptive and behavioral functioning in individuals with mild mental retardation. Res Dev Disabil. 2009;30(3):433–44.
6. Buntinx WHE, Schalock RL. Models of disability, quality of life, and individualized supports: implications for professional practice in intellectual disability. J Policy Practice Intellect Disabil. 2010;7(4):283–94.
7. De Bildt A, Sytema S, Kraijer D, Sparrow S, Minderaa R. Adaptive functioning and behaviour problems in relation to level of education in children and adolescents with intellectual disability. J Intellect Disabil Res. 2005;49(9):672–81. 8. Luckasson R, Borthwick-Duffy S, Buntinx WH, Coulter DL, Craig EMP, Reeve
A, Schalock R, Snell ME, Spitalnik DM, Spreat S, et al. Mental retardation: definition, classification, and systems of supports. Washington, DC: American Association on Mental Retardation; 2002.
9. Bryson SE, Bradley EA, Thompson A, Wainwright A. Prevalence of autism among adolescents with intellectual disabilities. Can J Psychiatry. 2008;53: 449–59.
10. Emerson E, Hatton C. Mental health of children and adolescents with intellectual disabilities in Britain. Br J Psychiatry. 2007;191:493–9. 11. LaMalfa G, Lassi G, Bertelli M, Salvini R, Placidi GF. Autism and intellectual
disability: a study of prevalence on a sample of the Italian population. J Intellect Disabil Res. 2004;48:262–7.
12. Matson JL, Shoemaker M. Intellectual disability and its relationship to autism spectrum disorders. Res Dev Disabil. 2009;30:1107–14.
13. Dekker MC, Koot HM. DSM-IV disorders in children with borderline to moderate intellectual disability. II: Child and family predictors. J Am Acad Child Adolesc Psychiatry. 2003;42:923–31.
14. Lindblad I, Gillberg C, Fernell E. ADHD and other associated developmental problems in children with mild mental retardation. The use of the“ five-to-fifteen”questionnaire in a population-based sample. Res Dev Disabil. 2011; 32:1805–2809.
15. Xenitidis K, Paliokosta E, Rose E, Maltezos S, Braham J. ADHD symptom presentation and trajectory in adults with borderline and mild intellectual disability. J Intellect Disabil Res. 2010;54:668–77.
16. Chapman SLC, Wu LT. Substance abuse among individuals with intellectual disabilities. Res Dev Disabil. 2012;33(4):1147–56.
17. Frielink N, Schuengel C, Kroon AAC, Embregts PJCM. Pretreatment for substance-abusing people with intellectual disabilities: intervening on autonomous motivation for treatment entry. J Intellect Disabil Res. 2015;59: 1168–82.
18. Didden R, VanDerNagel J, Van Duijvenbode N. Substance use disorders. In: Singh NN, editor. Handbook of evidence-based practices in intellectual and
developmental disabilities. Cham: Springer International Publishing; 2016. p. 957–65.
19. Nouwens PJG, Lucas R, Embregts PJCM, Van Nieuwenhuizen C. In plain sight but still invisible: a structured case analysis of people with mild intellectual disability or borderline intellectual functioning. J Intellect Dev Disabil. 2017;42:36–44.
20. Emerson E, Einfeld S, Stancliffe RJ. Predictors of the persistence of conduct difficulties in children with cognitive delay. J Child Psychol Psychiatry. 2011; 52(11):1184–94.
21. Bonta J, Blais J, Wilson HA. A theoretically informed meta-analysis of the risk for general and violent recidivism for mentally disordered offenders. Aggress Violent Behav. 2014;19:278–87.
22. Douma JCH, Dekker MC, de Ruiter KP, Tick NT, Koot HM, Bodfish J. Antisocial and delinquent behaviors in youths with mild or borderline disabilities. Am J Ment Retard. 2007;112(3):207–20.
23. Herrington V. Assessing the prevalence of intellectual disability among young male prisoners. JIDR. 2009;53:397–410.
24. Lindsay WR: Criminal Behavior, offending and pathways into forensic intellectual disability services. In: Challenging behavior.edn. Edited by Hastings R, Rojahn J. Elsevier: 2013: 105–142.
25. Stuiveling SJ, De Brauw WM. Zorg voor Jeugdigen met een Lichte Verstandelijke Handicap en/of Psych(iatr)ische problemen [treatment for youth with a mild intellectual disability and/or psych(iatr)ic problems]. The Hague: Court of Audit; 2007.
26. Hendriksen J, Hurks P. WPPSI-III-NL Wechsler Preschool and Primary Scale of Intelligence: Technische handleiding [WPPSI-III-NL technical manual]. Amsterdam: Pearson; 2009.
27. Kort W, Schittekatte M, Dekker PH, Verhaeghe P, Compaan EL, Bosmans M, Vermeir G. WISC-III NL Wechsler Intelligence Scale for Children. Derde Editie NL. In: Handleiding en Verantwoording [WISC-III wechsler intelligence scale for children. Third Edition the Netherlands. Manual and justification]. Amsterdam: Hartcourt Test Publishers/Nederlands Instituut voor Psychologen; 2005.
28. Wechsler D. WAIS-III, nederlandstalige bewerking: Technische handleiding [WAIS-III, dutch edit: Technical manual]. Lisse: Swets Test Publishers; 2001. 29. Nagin DS, Land KC. Age, criminal careers, and population heterogeneity:
Specification and estimation of a nonparametric, mixed poisson model. Criminology. 1993;31:327–62.
30. Boel-Studt SM. Examining typologies and outcomes of children and adolescents in psychiatric residential treatment facilities. Iowa City: The University of Iowa; 2014.
31. Nagin DS, Tremblay RE. Analyzing developmental trajectories of distinct but related behaviors: a group-based method. Psychol Methods. 2001;6:18–34. 32. Zorg CI. Trendrapportage zorgzwaarte intramurale AWBZ zorg [report on
trends in inpatient care under the exceptional medical expenses act]. Centrum Indicatiestelling Zorg: Driebergen; 2011.
33. Orobio de Castro B, Veerman JW, Bons E, De Beer L. Kansen gekeerd: criminaliteitspreventie door gezinsondersteuning [turned opportunities: prevention of criminality by family support]. Duivendrecht/Utrecht: PI Research BV/Capacity Group Developmental Pychology, University of Utrecht; 2002.
34. Schalock RL, Felce D. Quality of life and subjective well-being: conceptual and measurement issues. London: John Wiley and Sons London; 2004. 35. Van Nieuwenhuizen C, Bogaerts S, Ruijter E, Bongers I, Coppens M, Meijers
R. TBS-behandeling geprofileerd: een gestructureerde casussenanalyse [profiling TBS-treatment: a structural case analysis]. Eindhoven: GGzE; 2011. 36. LukočienėO, Varriale R, Vermunt JK. The simultaneous decision(s) about the
number of lower- and higher-level classes in multilevel latent class analysis. Sociol Methodol. 2010;40(1):247–83.
37. Cooper S, Smiley E, Morrison J, Williamson A, Allan L. Mental ill-health in adults with intellectual disabilities: prevalence and associated factors. Br J Psychiatry. 2007;190(1):27–35.
38. Douma JCH, Dekker MC, Verhulst FC, Koot HM. Self-reports on mental health problems of youth with moderate to borderline intellectual disabilities. J Am Acad Child Adolesc Psychiatry. 2006;45(10):1224–31. 39. Einfeld SL, Ellis LA, Emerson E. Comorbidity of intellectual disability and
mental disorder in children and adolescents: a systematic review. J Intellect Dev Disabil. 2011;36(2):137–43.
41. APA. Diagnostic and statistical manual of mental disorders (revised 4th ed.). Washington: American Psychiatric Association; 2000.
42. Bitter NA, Roeg DPK, Van Nieuwenhuizen C, Van Weeghel J. Identifying profiles of service users in housing services and exploring their quality of life and care needs. BMC Psychiatry. 2016;16(419):1–11.
43. Bozdogan H. Choosing the number of component clusters in the micture-model using a new informational complexity criterion of the Inverse-Fisher Information Matrix. In: Opitz O, Lausen B, Klar R, editors. Information and classification, concepts, methods and applications. Berlin: Springer; 1993. p. 40–52. 44. Fonseca JR, Cardoso MG. Mixture-model cluster analysis using information
theoretical criteria. Intelligent Data Anal. 2007;11(2):155–73.
45. Podesta L, Radstaak B. Zwakbegaafde jeugdigen hebben meer in plaats van minder problemen dan jeugdigen met een licht verstandelijke beperking [Youth with borderline intellectual functioning have more rather than fewer problems than youngsters with mild intellectual disability].
Orthopedagogiek. 2012;51:320–31.
46. Gillan D, Coughlan B. Transition from special education into post-school services for young adults with intellectual disability: Irish Parents’ experience. J Policy Practice Intellect Disabil. 2010;7(3):196–203.
47. Hulbert-Williams L, Hastings R, Owen DM, Burns L, Day J, Mulligan J, Noone SJ: Exposure to life events as a risk factor for psychological problems in adults with intellectual disabilities: a longitudinal design. J Intellect Disabil Res.2013.
48. Hastings RP, Beck A. Stress intervention for parents of children with intellectual disabilities. J Child Psychol Psychiatry. 2004;45:1338–49. 49. Panico L, Becares L, Webb EA: Exploring household dynamics: the reciprocal
effects of parent and child characteristics. Longit Life Course Stud 2014;5. 50. Patterson GR. Performance models for antisocial boys. Am Psychol. 1986;41:
432–44.
51. Walker JL, Carey PD, Mohr N, Stein DJ, Seedat S. Gender differences in the prevalence of childhood sexual abuse and in the development of pediatric PTSD. Arch Womens Ment Health. 2004;7(2):111–21.
52. Lunsky Y. Depressive symptoms in intellectual disability: does gender play a role? J Intellect Disabil Res. 2003;47(6):417–27.
53. Ting To W, Neiryinck S, Vanderplasschen W, Vanheule S, Vandevelde S. Substance use and misuse in persons with intellectual disabilities (ID): Results of a survey in ID and addiction services in Flanders. Res Dev Disabil. 2014;35:1–9.
54. Van der Nagel J, Kiewik M, Buitelaar J, De Jong C. Staff perspectives of substance use and misuse among adults with intellectual disabilities enrolled in Dutch disability services. J Policy Practice Intellect Disabil. 2011; 8(3):143–9.
55. Achenbach TM, Krukowski RA, Dumenci L, Ivanova MY. Assessment of adult psychopathology: meta-analyses and implications of cross-informant correlations. Psychol Bull. 2005;131:361–82.
• We accept pre-submission inquiries
• Our selector tool helps you to find the most relevant journal • We provide round the clock customer support
• Convenient online submission • Thorough peer review
• Inclusion in PubMed and all major indexing services • Maximum visibility for your research
Submit your manuscript at www.biomedcentral.com/submit