2017 2nd International Conference on Artificial Intelligence and Engineering Applications (AIEA 2017)
ISBN: 978-1-60595-485-1
ISAR Imaging Based on MEMP Method and Low
Rank Matrix Denoising Technique
YUANHANG TANG, XINFEI LU and WEIDONG CHEN
ABSTRACT
Matrix enhancement and matrix pencil (MEMP) method is an efficient approach for 2-D frequencies estimation in ISAR imaging. However, the MEMP method belongs to the category of spectral estimation algorithm and is sensitive to noise. In the MEMP method, an enhanced matrix formed using the echo matrix is leveraged to extract the 2-D frequencies. Based on the low rank property of this enhanced matrix, we propose a low rank matrix denoising technique for MEMP method. Simulation and quasi real data results demonstrate the effectiveness and robustness of the proposed denoising approach. With the proposed denoising technique, the tolerance to noise of MEMP method has been improved by 10dB.
KEYWORDS
ISAR imaging, Frequency estimation, Matrix enhancement and matrix pencil, Low rank matrix denoising.
INTRODUCTION
In inverse synthetic aperture radar (ISAR) imaging, it is often desired to estimate two-dimensional (2-D) frequencies from the echo matrix. The conventional method used to resolve the caterers is Discrete Fourier Transform (DFT). However, DFT suffers from the Rayleigh resolution limit when the data set is relatively small. To overcome the Rayleigh limit, several sparse recovery methods based on compressive sensing (CS) have been proposed [1, 2]. Most CS methods require the caterers of the target locate exactly on the prediscretized scene grids. Otherwise, the imaging results would be severely affected [3]. To solve the off-grid problem, many direct methods according to theories of Exampling [4] and the finite rate of innovation (FRI) [5] have been proposed, such as multiple signal classification (MUSIC) [6], estimation of signal parameters via rotational invariance techniques (ESPRIT) [7], and matrix pencil [8].
_________________________________________
Variants of MUSIC and ESPRIT such as root-MUSIC [11], U-ESPRIT [12] have also been developed from their 1-D versions to 2-D versions. All of these algorithms overcome the Rayleigh resolution limit but suffer from computational difficulty. More importantly, their performance is seriously affected by low SNR and few snapshots.
A computationally efficient method for estimating 2-D frequencies called matrix enhancement and matrix pencil (MEMP) has been proposed by Y. Hua [13]. It exploits the inherent structure in the original data matrix and forms an enhanced matrix from the original echo matrix. Subsequently, the enhanced matrix is used to estimate the 2-D frequencies through matrix pencil approach. However, the MEMP method belongs to the category of spectral estimation algorithm and is sensitive to noise. In [9], the author proposed a denoising technique based on non-convex constraint. Here, we propose a low rank matrix denoising technique based on the low rank property of the enhanced matrix to reduce the influence of noise.
In section II, a 2-D ISAR signal model is formulated. It is shown that the imaging problem can be modeled as 2D- frequencies estimation. In section III, the matrix enhancement is introduced, and the number of 2-D frequencies can be obtained from the principal eigenvectors of the enhanced matrix. In section IV, low rank matrix denoising technique is proposed to eliminate the negative effect of noise. In section V, simulation and the quasi real data results are shown to verify the effectiveness and robustness of our proposed low rank matrix denoising technique. The conclusion is given in section VI.
ISAR SIGNAL MODEL
Under the high-frequency condition, a radar target can be considered as a collection of a finite number of scattering centers. Using the small angle approximation which is a general assumption in ISAR imaging, the measured radar scattering signal from K scattering centers at M sampled frequency points
m
f (m0,1, , M 1 ) and N different look angles n(n0,1, , N1 ) is then
given by [12]
4 1
, K jc f xm kx f yny k
k k
x m n s e
(1)Where sk(k 1, 2, , K ) represent the kth scattering coefficients of the kth
scattering point,
x yk, k
is the location of the thk scattering center, c is the
free-space speed of electromagnetic wave. x m
f m f , fnx nf0 and f is the sample interval in frequency, is the sample interval in observation angle, f0 is
The Rayleigh resolution limit in two dimensions obtained by conventional DFT method are given by
2
r c BW
(2)
0
2
c c f
(3)
Where r is the resolution limit in range, c is the resolution limit in
cross-range, BW is the bandwidth of the ISAR imaging system, is the accumulated
coherent observation angle during the imaging time.
MATRIX ENHANCEMENT AND MATRIX PENCIL METHOD
For simplicity, let k exp 4 k f
j x
c
,
0
4 exp
k k
f
j y
c
then Eq.
1 can be expressed as
1
, K m n
k k k k
x m n s
(4)Eq. 4 implies that echo matrix x m n
,
consists of K 2-D sinusoids at the 2-Dfrequencies
k, k
k1, 2, , K
. In noisy case,We writex m n
,
=x m n,
+u m n,
, u m n
,
denote additive white Gaussian noise with zero mean and variance2. The MEMP method is an efficient approachto extract out 2-D frequencies from this kind of 2-D data set. This method can be faster than 2-D FFT method when the number of 2-D sinusoids is much smaller that the data set. We can obtain the location of the scatters after extracting out the 2-D frequencies from the echo data. The scattering coefficients can be estimated using least square (LS) method since the location of the scatters are obtained.
The enhanced matrix Xe is formed using echo matrix XM N according to
[13]
0 1
1 2 1
1 1
M P M P e
P P M
X X X
X X X
X
X X X
(5)
( ,0) ( ,1) ( , )
( ,1) ( , 2) ( , 1)
( , 1) ( , ) ( , 1)
m
x m x m x m N Q
x m x m x m N Q
x m Q x m Q x m N X (6) e
X Is a P
M P 1
Henkel block matrix, and Xm is a Q
N Q 1
Henkel matrix, so the deminsion of matrix Xe isPQ
M P 1
N Q 1
. Thenthe enhanced matrix Xe is given by
L
e R
X E AE (7)
Where 1 L L d L P L d Z Z U E Z U
(8)
, , ,
R
M P
d d
R R R
E Z U Z U Z (9)
1 2
( , , , K)
diag
A (10)
1 2
( , , , K)
d diag
U (11)
1 1
1 2 2 2
1 1 1
1 2
1 1 1 1
1 1 N Q N Q L R Q K
Q N Q
K K K
Q Z Z (12)
In order to estimate the 2-D frequencies, the rank of enhanced matrix Xe must
be equal to the number of caterersK. From (6) we know that rank
Xe K if andonly ifrank
EL = rank
ER K. Under this condition the free parametersP , Qmust satisfy
1
1
PQ K
M P N Q K
(13)
After obtaining the enhanced matrix, we can use matrix pencil method to estimate k and k respectively [8]. The matching approach between k and k is
x yk, k
k 1, 2, , K according to
k, k
. Since the locations of the caterers are known, the scattering coefficients can also be estimated.LOW RANK MATRIX DENOISING TECHNIQUE
The number of scattering points K is relatively small compared to the size of
the enhanced matrix. So the enhanced matrix Xe has low rank property. Here, we
propose a low rank matrix denoising technique to eliminate the negative effect of noise using the low rank property of the enhanced matrix. The denoising problem can be described as an optimization problem
2 2
, ,Z
1
min s.t.
2 F e F
W V WV Z ZX (14)
Where Xe is the enhanced matrix with noise, Z is assistant matrix with same
dimension as Xe , W has a dimension of PQ K , V has a dimension of
1
1
K M P N Q , F represents Frobenious norm of a matrix. Is a parameter related to noise level
A common and straightforward strategy widely used for solving problem (14) is alternating minimization method. Given the current iteratesW , V andZ , the
algorithm updates these three variables by minimizing (14) with respect to each one separately while fixing the other two. For example, by fixing the values of V
andZ, we obtain the new pointW .
2
† arg min1
2
PQ K F
W R
W ZV WV Z
(15)
Where †
V is the Moore-Penrose pseudo-inverse ofV . While fixing others at
their latest available values, we can update V and Z as the following iterative
procedure.
-1 †
-1 †
+ +
+
=
=
T T
T T
W ZV ZV VV
V W Z W W W Z
Z W V
(16)
we find the method is particularly effective for solving the low rank matrix denoising problem.
In [10], the SOR method for solving a linear system of equations is devised by applying extrapolation to the GS method. The new trial point is a weighted average between the previous iterate and the computed GS iterate successively for each component. We need to choose a proper value of the weight in order to get faster convergence. Applying the same idea to the basic schemes (16) gives a nonlinear SOR scheme:
1
1
+ 1
1
T T
T T
W ZV VV
W W W
V W W W Z
V V V
Z W V
(17)
Where the weight1. Obviously, =1 is the GS method
Since a fixed weight is generally inefficient for nonlinear problems, here we present an updating strategy for using the residual criterion. Let us denote the residual by
e
S X WV (18)
After the point
W
,V ,Z
is computed, we calculate the residual ratio
FF
S
S
(19)
Where
e
S X W V (20)
is,
1,1
for some1
0,1 .If this happens, we increasetomin
,
, where 0 is an increment and 1 is an upper bound. So the convergence can be guaranteed, and the rate of convergence can also be accelerated. From the above considerations, we can get low rank matrix demising technique as below.
Algorithm 1: Low rank matrix denoising technique
Input: Low rank matrix with noiseXe , rank estimation K
Output: Low rank matrix after demising Initialization: Set 0 1 1
RK M P N Q
V , Z 0 Xe , =1 , 1 , 0 ,
1 0,1
and k0
While not convergent do
1: Compute
W
,V ,Z
according to (17)With
, ,
k , k , k
W V Z W V Z ;2: Compute the residual ratio
according to (19); 3: If
1 then set =1 and go to step 1;4: Update
k 1, k 1, k 1
, ,
W V Z W V Z and increment k ;
5: If
1 then set = max
, 0.25
1
and =min
,
;Return W
V or Z
We can get matrixW, V and Z after certain number of iterations, then WV or
Z is the low rank enhanced matrix after denoising. It is worthwhile to note that the
iteration procedure has no relevance with the noise level, however the denoising result has close connection with the noise level.
SIMULATION AND QUASI REAL DATA RESULTS
The MEMP method based on spectral estimation algorithm is seriously influenced by noise, we will use simulation results to illustrate the sensitivity of the MEMP method to noise. The low rank matrix denoising technique is used to denoise. After using our proposed denoising technique, the robustness of the MEMP method to noise have been improved.
The simulated ISAR data are generated from fmin 1GHz to fmax 1.1GHz in
101
M equally spaced frequency points and from min=0 to max=5 in N 21
equally spaced angles. So the Rayleigh resolution limit in range and cross-range isr 1.5m ,c 1.7m respectively. We set three scattering points located at (1m, 1m), (1m, 2m) and (2m, 1m) respectively, and their scattering coefficients are all equal to one for simplification. The distance between these three scattering points in two dimensions are 1m, which are smaller than Rayleigh resolution limit, so they are indistinguishable when using 2D-FFT method.
setP
M1 2
, Q
N1 2
to maximize the dimensions of noise subspace. It has to be noted that when using MEMP method and low rank denoising technique, the number of scatting points K must be known. Fortunately, we can estimate thenumber of scatterers using Gerschgorin disk criterion [16].
To evaluate the noise sensitivity of the MEMP method and verify the robustness to noise of our proposed denoising technique, the Monte Carlo simulation has been carried out.
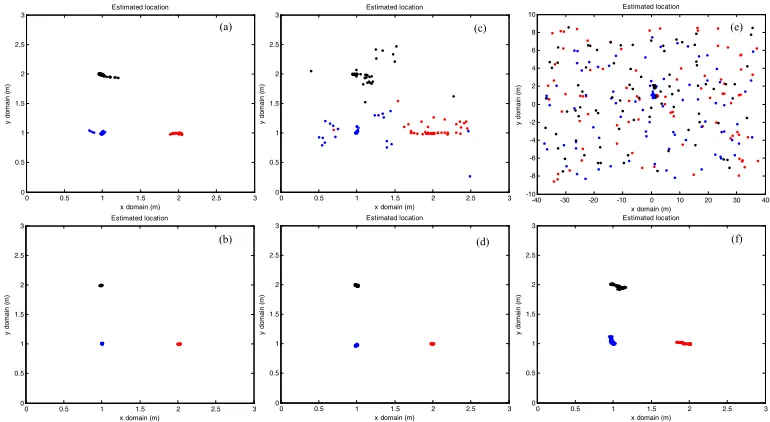
Fig. 1 shows the estimated locations for 100 times Monte Carlo simulations at different SNRs without or with denoising technique. The SNR is 15dB, 10dB and 5dB respectively. Fig. 1(a) (c) (e) represents the estimated locations under different SNRs without denoising technique, and Fig. 1(b) (d) (f) represents the estimated locations with denoising technique.
The simulation results show that the MEMP method can estimate the 2D-locations with high accuracy when the SNR is high. However, the performance of estimation is becoming to degrade when increasing the noise level. And the MEMP method is completely out of work when the SNR is lower than 10dB. So the tolerance to noise of MEMP method without denoising is approximately 15dB.
It is obvious that the denoising technique can eliminate the negative effect of noise significantly. When the SNR is decreased to 5dB and using denoising technique, the MEMP method can still estimate the locations of three scattering points with high accuracy. That is to say after using denoising technique, the tolerance to noise of MEMP method is imp- proved by 10dB.
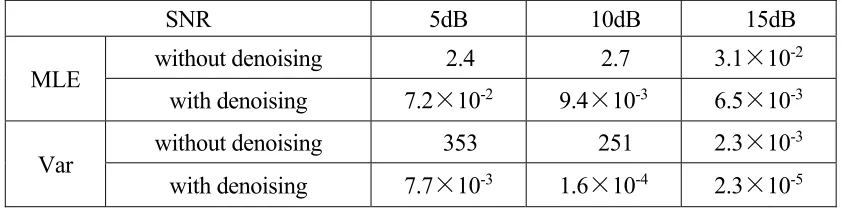
To illustrate the performance improvement after using low rank matrix denoising technique specifically. We calculate the mean location error between estimated locations and the precisely known locations of all scattering points, we also calculate the variance of estimated locations during 100 index- pendent times under different SNRs with or without denoising technique. Mean location error and variance are defined as
0 0.5 1 1.5 2 2.5 3 0 0.5 1 1.5 2 2.5
3 Estimated location
x domain (m)
y d om ai n (m )
0 0.5 1 1.5 2 2.5 3 0 0.5 1 1.5 2 2.5
3 Estimated location
x domain (m)
y d om ai n (m ) (a) (d)
0 0.5 1 1.5 2 2.5 3 0 0.5 1 1.5 2 2.5
3 Estimated location
x domain (m)
y d om ai n (m ) (c)
0 0.5 1 1.5 2 2.5 3 0 0.5 1 1.5 2 2.5
3 Estimated location
x domain (m)
y d om ai n (m ) (b)
-40 -30 -20 -10 0 10 20 30 40 -10 -8 -6 -4 -2 0 2 4 6 8
10 Estimated location
x domain (m)
y d om ai n (m ) (e)
0 0.5 1 1.5 2 2.5 3 0 0.5 1 1.5 2 2.5
3 Estimated location
x domain (m)
[image:8.612.102.487.476.687.2]y d om ai n (m ) (f)
1 1
1
1 ˆ ˆ
MLE=
1 ˆ ˆ
var( ) var( )
K T
t t
k k k k
k t K
k k
k
x x y y
TK
Var K
x y(21)
Where
ˆ ˆt, t
k kx y are the th
t estimated value of?
Location
x yk, k
,var( )xˆk var( )yˆk are the variance of estimated value of ,x yk kduring T independent times, and T = 100 is the independent Monte Carlo simulation times, K is the number of caterers. The mean location error and the
variance under different conditions are show in Table 1.
The mean location error and the variance are extremely large when the SNR is lower than 15dB without denoising technique, which means that the MEMP method is completely out of work under these conditions. The SNR must be larger than 15dB so as to estimate the location of the scatting points with high accuracy if without denoising. When using denoising technique, the SNR can be as low as 5dB to estimate the location of the scatting points accurately.
In the last, we use the quasi real data of an airplane (B-727) provided by the U.S. Naval Research Laboratory to test the performance of our proposed denoising technique. The quasi real data is available on the website http://airborne.nrl. navy.mil/∼vchen/tftsa.html. An additive noise is added to the original B-727’s data, and the SNR is set to 10 dB. The reconstruction of target spatial domain is discretized with 256 range cells and 48 cross range cells.
[image:9.612.87.508.497.602.2]The red circles in Fig. 2(a) and Fig. 2(b) are the position recovery results by MEMP method with and without denoising technique. We use the conventional FFT-based ISAR image as the background for fair comparison. As stated above, the denoising technique based on low rank enhanced matrix can eliminate the negative effect of noise significantly.
TABLE 1. MEAN LOCATION ERROR AND VARIANCE UNDER DIFFERENT CONDITION.
SNR 5dB 10dB 15dB
MLE without denoising 2.4 2.7 3.1×10
-2
with denoising 7.2×10⁻² 9.4×10⁻³ 6.5×10⁻³
Var without denoising 353 251 2.3×10
-3
range c
el
l num
ber
corss range cell number
5 10 15 20 25 30 35 40 45
50
100
150
200
250
range c
el
l num
ber
corss range cell number
5 10 15 20 25 30 35 40 45
50
100
150
200
250
[image:10.612.108.493.65.224.2](a) Without demising technique (b) with demising technique Figure 2. ISAR imaging results of B-727 by MEMP without (a), with (b) demising technique.
CONCLUSION
The sensitivity of matrix enhancement and matrix pencil method to noise is illustrated in this paper. We proposed a low rank matrix denoising technique using the low rank property of the enhanced matrix. The effectiveness of our proposed denoising approach is also verified using simulated data and B727’s quasi real data.
ACKNOWLEDGEMENTS
This work is supported by the National Natural Science Foundation of China under Grant No. 61401140.
REFERENCES
1. M.A. Herman, T. Strohmer, “High-resolution radar via compressed sensing,” IEEE Transactions on Signal Processing, vol. 57, no. 6, pp. 2275-2284, 2009.
2. R. Baraniuk, P. Steeghs, “Compressive radar imaging,” IEEE Radar Conference, pp. 128-133, 2007.
3. Y. Chi, L.L. Scharf, A. Pezeshki, A.R. Calderbank, “Sensitivity to basis mismatch in compressed sensing,” IEEE Transactions on Signal Processing, vol. 59, no. 5, pp. 2182-2195, 2011.
4. M. Mishali, Y.C. Eldar, A.J. Elron, “Xampling: Signal acquisition and processing in union of subspaces,” IEEE Transactions on Signal Processing, vol. 59, no. 10, pp. 4719-4734, 2011.
5. M. Vetterli, P. Marziliano, T. Blu, “Sampling signals with finite rate of innovation,” IEEE Transactions on Signal Processing, vol. 50, no. 6, pp. 1417-1428, 2002.
6. J.W. Odendaal, E. Barnard, W.I. Pistorius, “Two dimensional high resolution radar imaging using the MUSIC algorithm,” IEEE Transactions on Antennas and Propagation, vol. 42, no. 10, pp. 1386-1391, 1994.
7. R. Roy, T. Kailath, “ESPRIT-estimation of signal parameters via rotational invariance techniques,” IEEE Transactions on Acoustics, Speech, and Signal Processing, vol. 37, no. 7, pp. 984-995, 1989. 8. Y. Hua, T.K. Sarkar, “Matrix pencil method for estimating parameters for exponentially
dampediundamped rinuso ds in noise,” IEEE Transactions on Acoustics, Speech, and Signal Processing, vol. 36, no. 5, pp. 814-824, 1990.
10. G.H. Golub, C.F. Van Loan: Matrix computations. In: Johns Hopkins Studies in the Mathematical Sciences, 3rd edn. Johns Hopkins University Press, Baltimore (1996).
11. A.R. Koushik, B.S. Shruthi, R. Rajesh, R. Sharma, “A root-music algorithm for high resolution ISAR imaging,” IEEE International Conference on Recent Trends in Electronics, Information & Communication Technology (RTEICT), India, May 20-21, 2016.
12. X. Wang, M. Zhang, J. Zhao,”Super-resolution ISAR imaging via 2D unitary ESPRIT,” Electronics Letters, vol. 51, no. 6, pp. 519-521, 2015.
13. Y. Hua, “Estimating two-dimensional frequencies by matrix enhance- ment and matrix pencil,” IEEE Transactions on Signal Processing, vol. 40, no. 9, pp. 2267-2280, 1992.
14. J. Zhao, M. Zhang, X. Wang, Z. Cai, D. Nie, “Three-dimensional super resolution ISAR imaging based on 2D unitary ESPRIT scattering centre extraction technique,” IET Radar, Sonar & Navigation, vol. 11, no. 1, pp. 98-106, 2017.
15. Z. Wen, W. Yin, Y. Zhang, “Solving a low-rank factorization model for matrix completion by a nonlinear successive over-relaxation algorithm,” Mathematical Programming Computation, vol. 4, no. 4, pp. 333-361, 2012.