2017 2nd International Conference on Computer, Network Security and Communication Engineering (CNSCE 2017) ISBN: 978-1-60595-439-4
Texture Classification by Bit-plane Multifractal Spectrum and Bit-plane
Barycentric Coordinates of Wavelet Coefficients Based on SVD
Shu-li WANG
*and Guan-xiang WANG
School of Mathematical Sciences, Peking University, Beijing 100871, China
*Corresponding author
Keywords: Texture classification, Singular value decomposition, Wavelet transform, Bit plane, Multi-fractal spectrum, Barycentric coordinates.
Abstract A new texture classification method based on singular value decomposition(SVD) and
wavelet transform is presented. Wavelet transform is employed on texture images having been preprocessed with SVD. The elements of the signature vector of an image are the fractal dimensions and barycentric coordinates of the bit planes of the wavelet coefficients in both the 3-Level high frequency domains and the third low frequency domain. The one-nearest-neighbor classifier with standard L-norm distance is utilized to perform supervised texture classification. Compared with some other classification methods, the method is experimentally proved more efficient and less time-consuming.
Introduction
Texture understanding and analysis play important roles in many aspects of computer vision and image processing. Despite lots of efforts in last decades, it still remains a challenging problem to model textures efficiently. Some available methods of texture classification and retrieval can be found in [1,2,3,4]. SVD is an important matrix theory and has been popularly employed in image processing, such as data compression [5], texture segmentation [6], and texture classification [7]. Specifically, wavelet-based methods have been intensively researched since wavelet analysis offers an efficient representation of multiresolutions and orientations of images [8,9,10,11]. Recently, models based on wavelet subband coefficients have also been used on texture classification. The existing models in literatures contain the Characteristic Generalized Gaussian Density (CGGD) model [12], the Bit-plane Probability (BP) model [13,14], the Refined Histogram [15], the Local Energy Histogram [16], and so on. Particularly, the Bit-plane Probability (BP) signature is a very competitive feature by modeling wavelet high-frequency subband coefficients via the Product Bernoulli Distributions (PBD). The Bit-plane Probability (BP) signature is built by the PBD model parameters. More specifically, the BP signature in conjunction with the use of weighted L-norm distance and the minimum distance classifier is presented concretely in paper [14].
this paper. The proposed method gives a satisfaction performance in comparison with some current state-of-art methods in supervised texture classification.
The rest of the paper is organized as follows. In Section 2, the details of the proposed texture classification method are presented. The experiments results and comparisons are shown in Section 3. Finally, the conclusion is given in Section 4.
Proposed Texture Classification Method
The BP-MFS-BCC Method
Due to the fractal dimension alone does not provide enough description of objects, multifractal spectrum (MFS) analysis, as an extension of classical fractal analysis, was proposed to describe complex patterns with objects of multiscales [17-19]. Precisely speaking, for a given objective function f(x,y) with domain S ⊂ R, define a point categorization and split the domain D into K subdomain D, j = 1, … , K. Then the vector d = (d, … , d) is called the MFS of f(x,y), where d is the fractal dimension of D, j = 1, … , K. Obviously, in MFS analysis, the two key roles are the objective function and the point categorization criteria. Since the characteristic of multi-scaling and triple direction decomposition, wavelet transform (WT) is widely used in representation of textures. Here, the high frequency subbands of the WT of an image are taken as objective functions, and every subband is divided into several binary bit plains using the wavelet coefficients.
Let I be a gray image, W,, W,, W, be the 3 matrices of wavelet coefficients of high frequency in decomposition level i. For simplicity, we only focus on the absolute values of all wavelet coefficients. According to computing algorithm of WT, amplitudes of wavelet coefficients increase exponentially with multiplication factor √2 as the scale i of wavelet decomposition increases. So we make a
uniform measure for those coefficients by multiplying a factor 1/√2, which keeps all these coefficients in [0,255] as the original gray levels of I do. Thus each subband W,(j = 1,2,3) can be cut into 8 binary bit planes by quantization. As a logical image, each bit plane possesses fractal property in some sense and its fractal dimension is denoted by d,(), k = 1, … ,8. Hence the MFS of W, is
MFSW, = ( d,(), … , d,(")),
And the MFS of the i-th level of WT is a vector of 24-dimension
MFS(W) = ( MFSW, , MFSW, , MFSW, .
Assuming L-level wavelet decomposition is made on I, the whole MFS of the 3L high frequency subbands is defined as a vector of dimension of 24L,
MFS(I, L) = ( MFS(W), … , MFS(W$).
To emphasize the fact that all fractal dimensions are the dimension of bit planes of wavelet coefficients, above MFS is called MFS based on bit plane(BP-MFS),
BP − MFS(I) = ( MFS(W), … , MFS(W$).
x) =*×,-. ∑ ∑ ∑* x(i, j, k) 1 2 1 " 1 ,
y) =2×,-. ∑ ∑ ∑* y(i, j, k)
1 2 1 "
1 ,
z) ="∑ ∑ ∑* z(i, j, k)
1 2 1 "
1 ,
x(i, j, k), y(i, j, k), z(i, j, k) refer to the three-dimensional coordinates of each non-zero pixel in the 8 bit planes and num refers to the total number of the non-zero pixels in the 8 bit planes.
Our Method
To extract efficient features of texture images, this paper utilizes SVD theory to preprocess images as the first step. In detail, we reconstruct texture images with SVD by discarding some part of singular values, and then the feature extracting method of BP-MFS-BCC is employed on these reconstructed texture images. This preprocessing step aims to retain the most valuable information of images from the useful singular values and to reduce minimal interference from the unuseful singular values. In the next section, the selection of the valuable singular values will be determined by experience.
Experimental Results
To evaluate the performance of our signature for texture classification, we have tested it on texture images from the well-known and widely used Brodatz database [20] and UMD database [21]. In Brodatz database, a typical set of 80 grey 640 × 640 images is tested. Each image is divided into 16 nonoverlapping patches of 160 × 160, and thus total 1280 samples are available. 15 kinds of grey 960 × 1280 images are chosen from UMD database. Similarly, each image is divided into 16 nonoverlapping patches of size 240 × 320, and thus total 240 samples are gotten.
In the following experiments, we choose randomly half of the sample images in each class from the database as the training samples and the rest images are used for testing. In addition, one-nearest-neighbor (1NN) classifier is used in texture classification and such experiment is repeated 100 times to obtain the average results of classification performance. 3-level wavelet decomposition with the Daubechies 10 (db10) filter bank is utilized to obtain the signatures of the images.
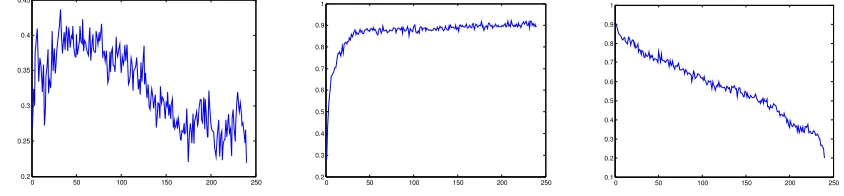
[image:3.612.103.507.498.598.2]Selection of the Valuable Singular Values
Figure 1. Three ways to selecting singular values’ variation trends of classification accuracy rate on Brodatz. 0 20 40 60 80 100 120 140 160
0.01 0.02 0.03 0.04 0.05 0.06 0.07 0.08 0.09
0 20 40 60 80 100 120 140 160 0 0.1 0.2 0.3 0.4 0.5 0.6 0.7 0.8
0 20 40 60 80 100 120 140 160 0 0.1 0.2 0.3 0.4 0.5 0.6 0.7 0.8
0 50 100 150 200 250
0.2 0.25 0.3 0.35 0.4 0.45
0 50 100 150 200 250 0.2 0.3 0.4 0.5 0.6 0.7 0.8 0.9 1
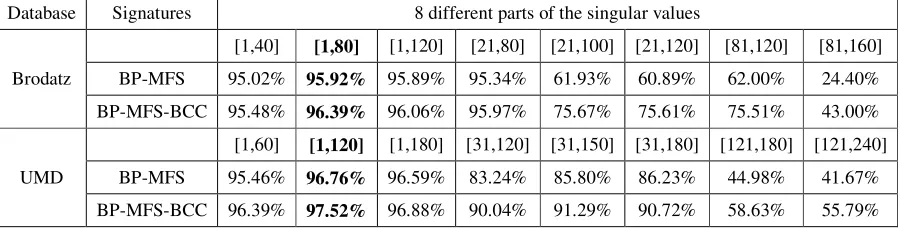
[image:3.612.92.514.632.730.2]In this experiment, three ways to selecting singular values as image signature are tested and the results are shown in Figure 1 and Figure 2. In Figure 1 and Figure 2, the first plot describes variation trend of the classification accuracy rate when selecting each singular value as image signature, the second plot describes variation trend of the classification accuracy rate when selecting the top n singular values as image signature, and the third plot describes variation trend of the average classification accuracy rate when discarding the top n singular values as image signature. The plots in both Figure 1 and Figure 2 shows that, in texture classification, the smaller singular values play little role and the most valuable singular values focus on the first half part. Additionally, we choose 8 different parts of the singular values to reconstruct texture images and the average classification accuracy rates (ACAR) on both two databases are shown in Table 1. Figure 1, Figure 2 and Table 1 show that it is reasonable to reconstruct texture images with SVD by remaining the first half of the singular values.
Our Method on Texture Classification
We compare both BP-MFS signature and BP-MFS-BCC signature combined with SVD with BP method proposed in [14] and LEH method proposed in [16] on texture images from the Brodatz database and the UMD database. In these experiments, the number of the training samples in each texture image class is set as 8, half of total samples in each class. Besides the average classification accuracy rate (ACAR), the computational costs with different methods are also compared. The time for texture classification (TTC) is defined here as the costing time for the entire test samples being classified in once test. The ACAR and TTC of the four methods on above mentioned two data sets are listed in Table 2. As shown in Table 2, the proposed method gives a better performance.
Table 1. The ACAR of feature extraction with 8 different parts of the singular values to reconstruct texture images. Database Signatures 8 different parts of the singular values
Brodatz
[1,40] [1,80] [1,120] [21,80] [21,100] [21,120] [81,120] [81,160] BP-MFS 95.02% 95.92% 95.89% 95.34% 61.93% 60.89% 62.00% 24.40% BP-MFS-BCC 95.48% 96.39% 96.06% 95.97% 75.67% 75.61% 75.51% 43.00%
UMD
[image:4.612.82.532.377.492.2][1,60] [1,120] [1,180] [31,120] [31,150] [31,180] [121,180] [121,240] BP-MFS 95.46% 96.76% 96.59% 83.24% 85.80% 86.23% 44.98% 41.67% BP-MFS-BCC 96.39% 97.52% 96.88% 90.04% 91.29% 90.72% 58.63% 55.79% Table 2. The ACAR and TTC(in seconds) of four methods tested on images from Brodatz database and UMD database.
Database BP-MFS-BCC BP-MFS BP LEH
Brodatz ACAR TTC
96.39% 1.08
95.92% 1.05
86.82% 0.14
96.25% 120.05
UMD ACAR
TTC
97.52% 0.05
96.76% 0.03
82.06% 0.02
96.98% 1.88
Summary
References
[1] Hui Ji, Xiong Yang, Haibin Ling and Yong Xu, Wavelet Domain Multifractal Analysis for Static and Dynamic Texture Classification,. IEEE Trans. Image Process., VOL. 22, NO. 1, pp. 286-299, 2013.
[2] Roland Kwitt, Peter Meerwald and Andreas Uhl, Efficient Texture Image Retrieval Using Copulas in a Bayesian Framework, IEEE Trans. Image Process., VOL. 20, NO. 7, pp. 1452-1464, 2011.
[3] Mohand Sa Allili, Wavelet Modeling Using Finite Mixtures of Generalized Gaussian Distributions: Application to Texture Discrimination and Retrieval,. IEEE Trans. Image Process., VOL. 21, NO. 4, pp. 1452-1464, 2012.
[4] X. Liu and D. Wang, Texture Classification Using Spectral Histograms, IEEE Trans. Image Process., vol. 12, no. 6, pp. 661-670, Jun. 2003.
[5] Ori Bryt and Michael Elad, Compression of facial images using the K-SVD algorithm. J. Vis. Commun. Image R., 19, pp.270-282, Mar. 2008.
[6] Alireza Tavakoli Targhi and Azad Shademan, Clustering of singular value decomposition of image data with applications to texture classification. Proceedings of SPIE, Visual Communications and Image Processing 2003, vol. 5150, pp. 972-979, 2003.
[7] Bae-Muu Chang , Hung-HsuTsai and Chih-Yuan Yen, SVM-PSO based rotation-invariant image texture classification in SVD and DWT domains. Engineering Applications of Artificial Intelligence, 52, pp. 96–107, Mar. 2016.
[8]T. Randen and J. H. Husoy, Filtering for texture classification: A comparative study, IEEE Trans. Pattern Anal. Mach. Intell., vol. 21, no. 4, pp. 291C310, Apr. 1999.
[9] A. Laine and J. Fan, Texture Classification by Wavelet Packet Signatures,. IEEE Trans. Pattern Anal. Mach. Intell., vol. 15, no. 11, pp.1186C1191, Nov. 1993.
[10] S. K. Choy and C. . Tong, Statistical wavelet subband characterization based on generalized Gamma density and its application in texture retrieval,. IEEE Trans. Image Process., vol. 19, no. 2, pp. 281C289, Feb. 2010.
[11] S. C. Kim and T. J. Kang, Texture classification and segmentation using wavelet packet frame and Gaussian mixture model, Pattern Recognit., vol. 40, no. 4, pp. 1207C1221, Apr. 2007.
[12] S. K. Choy and C. S. Tong, Supervised texture classification using characteristic generalized Gaussian density,. J. Math. Imag. Vis., vol. 29, no. 1, pp. 35C47, Sept. 2007.
[13] M. H. Pi, C. S. Tong, S. K. Choy and H. Zhang, A fast and effective model for wavelet subband histograms and its application in texture image retrieval,. IEEE Trans. Image Process., vol. 15, no. 10, pp. 3078C3088, Oct. 2006.
[14] S. K. Choy and C. S. Tong, Statistical properties of bit-plane probability model and its application in supervised texture classification,. IEEE Trans. Image Process., vol. 17, no. 8, pp. 1399C1405, Aug. 2008.
[15] L. Li, C. S. Tong and S. K. Choy, Texture Classification Using Refined Histogram. IEEE Trans. Image Process., Vol. 19, No. 5, pp. 1371-1378, 2010.
[16] Yongsheng Dong and Jinwen Ma, Wavelet-Based Image Texture Classification Using Local Energy Histograms. IEEE Signal Processing Letters, Vol. 18, No. 4, pp. 247-250, 2011
[18] Andre Ricardo Backes and Odemir Martinez Bruno, Fractal and Multi-Scale Fractal Dimension analysis: a comparative study of Bouligand-Minkowski method. INFOCOMP, vol. 7, pp. 74-83, 2008.
[19] Yong Xu, Hui Ji and Cornelia Fermuller, A Projective Invariant for Textures. CVPR, vol. 2, pp. 1932-1939, 2006
[20] [Online]. Available: http://www.ux.uis.no/tranden/brodatz.html
[21] [Online].Available:http://www.cfar.umd.edu/ fer/High-resolution-data-base/hr-database.htm.