2016 6th International Conference on Information Technology for Manufacturing Systems (ITMS 2016) ISBN: 978-1-60595-353-3
1 GENERAL INSTRUCTIONS
VSM is one of the most commonly used text representation methods in text classification. VSM has the basic idea that the document is formalized into a vector in multidimensional vector space. The similarity among texts is represented through vector similarity in space. It only provides a theory frame, and the feature item weight computing method is not fixed. A better algorithm can be selected through comparison, thereby improving the performance of text classification [1].
In the VSM, TF-IDF (Term Frequency-Inverse Document Frequency) method is mainly adopted as commonly-used weight computing method for text vectorization. The importance of the feature item in the document is effective represented by the method to certain extent. However, it has some defects.
Data set distribution is always unbalanced among categories, namely the quantity of documents in different categories may be greatly different, which may seriously affect the computing result of TF- IDF [2]. B.C.How and K.Narayanan [3] proposed CTD (category term descriptor) in order to weaken the influence of data set skew aiming at the problem.
If a feature word appears in a category frequently, which appears in the other categories rarely, the feature word should have higher weight. However, such word may be provided with lower weight according to IDF definition. Many scholars improved TF-IDF aiming at the defect, such as CRF for replacing IDF item proposed by Deng Zhihong [4], etc., BOR-TFI weight function of Shen Zhibin [5], etc., TF-IDF-DIC weight function of Tai Deyi [6], etc., WA-DI-SI algorithm of Zhang Yu [7] etc., TW-TF-IDF algorithm of Lu Yonghe [8], etc., ETFIDF algorithm of Guo Hongyu [9] etc. Some scholars also introduced feature selection function to modify weight of feature word, such as TF-IDF-CHI
algorithm of Zhao Xiaohua[10] etc., TF-IDF algorithm of Li Yuan[11], etc. with introduction of information entropy IG .
Only word frequency information of document is considered aiming at own information of traditional feature weight algorithm on documents. Structure information of documents is ignored. In the paper, document structure matrix DS (Document Structure) is introduced for correcting feature weight on the basis of document-based feature structure influence on classification. Actual text classification experiment is implemented according to the model, thereby validating its effectiveness.
2 FEATURE WEIGHTING METHOD
2.1 Classic feature weight
The most common feature weight algorithm mainly refers to TF- IDF algorithm till present. The computation formula is shown as follows:
(1)
Wherein, represents the appearance
frequency of the feature in the document , and is the document quantity of feature item appearance in the training set, N refers to total document quantity in the training set, and the value of is generally 0.01 in actual application. Standardized treatment is implemented on tfidf as shown in the following formula, wherein represents feature vector dimension:
(2)
Research of Feature Weighting Method Based on Document
Structure
Qiang-rong Jiang, Yan-hui Shangguan & Lie-jin Song
Beijing University of Technology, Beijing, China
Traditional TF-IDF algorithm has the following deficiencies: (1) when the feature frequently occurs in a category, which basically doesn't appear in the other categories, the feature should be provided with higher category distinguishing ability. However, such feature weight can be reduced because of the factor in IDF; (2) the feature appears in several documents in a concentrated mode in one category, which does not appear in other documents nearly. It is obvious that the feature does not have category representation ability. The condition can not be considered in traditional algorithm.
2.2 Related improvement of TF-IDF
Many scholars put forward their own improvement algorithms aiming at the shortcomings of the traditional TF- IDF algorithms. In the paper, TF- IDF- CHI algorithm and ETFIDF algorithm are mainly introduced.
2.2.1 TF- IDF- CHI
The importance of each feature in each category is considered. Zhao Xiaohua[10] utilized statistics (CHI) to correct weight of each feature, and proposed TF- IDF- CHI algorithm. Zhang Aihua [12] and other people also proved that CHI can filter noise feature through experiments, and the classification effect robustness can be increased. Lu Yonghe [8] and other people further improved the method, and implemented logarithm standardization on TF and CHI. It is discovered through experiment that TF- IDF- logCHI has better effect. The computation formula is shown as follows:
(3)
2.2.2 ETFIDF
Feature distribution among categories and within categories is not considered in traditional TF-IDF algorithm, Guo Hongyu [9] proposed a feature w eight algorithm ETFIDF based on theory of information entropy aiming at the problem. Information entropy is introduced in the algorithm to represent the dispersion of feature item in each category, therefore features with more uniform distribution in different categories have lower weight, features with less uniform distribution has larger weight. The feature item entropy computation formula is shown as follows:
(4)
Wherein, represents the document quantity containing feature item in the training set. represents document quantity containing feature item in the category , represents the category quantity in the training set. Since the
entropy is proportionally changed with the distribution uniformity of the feature item in each category, can be introduced into feature computation formula for obtaining computation formula of ETFIDF. It is shown in the following formula.
(5)
The weight undergoes standardization treatment for obtaining ETFIDF. The computation formula is shown as follows:
(6)
Feature weight obtained through computation according to the above formula is inversely proportional with distribution uniformity of the feature item in different categories of the training set. Namely, the feature item distribution is more uniform in the category, the obtained feature weight is lower, and its distribution in the category is less uniform, and the obtained feature weight is larger. 2.3 Analysis on weight computing method
The above algorithms are analyzed. It can be found that TF item is used for distinguishing among documents in computation. IDF, CHI and information entropy belong to overall computation from the document set. The importance of the feature is measured. These algorithms have better effect on text classification sensitive to feature word such as theme classification, etc. However, text emotion is related to feature importance on one hand, meanwhile, relative position relationship of the feature in documents also can produce certain influence on emotional tendencies on the other hand aiming at the problem of sentiment classification.
Table 1. Document example.
No. text
1 The room is very not conformable. 2 The room is not very comfortable.
3 WEIGHT IMPROVEMENT ALGORITHM BASED ON DOCUMENT STRUCTURE
It can be observed through the above analysis that word frequency information of the feature item is only considered in the commonly used feature weighting method aiming at information contained in the document. The structure information of the feature is not represented.
It is assumed that one document contains n features after word segmentation and pre-processing. The same feature items may be contained. All feature items are sequenced according to order of feature item appearance in the document as shown in figure 1. In one document, the relationship among neighboring features is shown as the solid line arrow in the figure. Non-adjacent feature items’ relationship is shown as the dash line arrow.
[image:3.612.55.300.256.336.2]t1 t2 t3 t4 t5 t6 …… tn
Figure 1. Document structure representation.
In the paper, a 2D matrix should be firstly defined in order to describe the document structure. It is used for describing the structure relationship of feature items in the document. The matrix computation formula is shown as follows:
(7)
Wherein, is the finally-obtained document structure matrix. It is a 2D matrix, wherein each item of the matrix represents the relative position relationship between feature item and feature item . is the set of all feature items contained in the document. refers to the distance of feature item and feature item in
document . ws represents the largest
distance of related feature items in the document. DS computation formula shows that the relationship of any two feature items in the same document is weakened with distance increase. If feature item and feature item appear for many times in the same document synchronously, the relationship among co-occurrence feature items can be highlighted through superposition mode.
The structure of one document is described in matrix DS. In the paper, three weight algorithms of TF-IDF-DS, TF-IDF-logCHI-DS and ETFIDF-DS are constructed through integrating DS in TF-IDF, TF-IDF-logCHI and ETFIDF. The computation formula is shown as follows.
(8)
Wherein, represents TF-IDF,
TF-IDF-logCHI and ETFIDF, and refers to
corresponding feature weight which is corrected through document structure.
4 EXPERIMENTAL ANALYSIS
4.1 Experiment steps
In the paper, the experimental data comes from larger scale Chinese Hotel Review Corpus [13]
provided by Dr Tan Songbo from
Institute of Computing Technology, Chinese
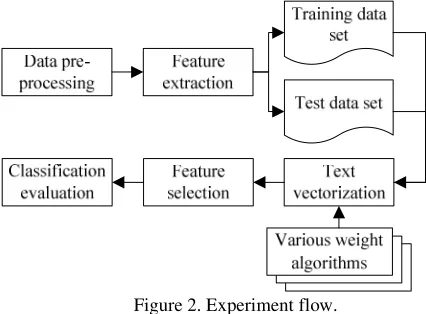
[image:3.612.317.530.313.470.2]Academy of Sciences. After repeated data in the corpus is removed in the experiment, a total of 4745 comments are available, including 2302 positive comments and 2443 negative comments. Quantity in each category is basically balanced. In the experiment, 70% comments are extracted randomly as training data set in the experiment. The remaining 30% comments are regarded as test data set. The experiment flow is shown in figure 2:
Figure 2. Experiment flow.
The experiment is completed under Python environment. The jieba model under Python is adopted in Chinese word segmentation of data pre-processing. Commonly used stop words and punctuation marks are filtered. TF-IDF, IDF-logCHI and ETFIDF as well as IDF-DS, TF-IDF-logCHI-DS and ETFIDF-DS obtained by correcting the method are adopted in weight
computing method for comparison during
experiment in the paper. CHI statistics is adopted by feature selection method for feature reduction. Classification performance under different feature quantities is compared. SVM algorithm is used in classification algorithm. Linear kernel is used for kernel function, and penalty factor is C = 0.1. 4.2 Evaluation standard
algorithm on the whole data set. The calculation formula of each index is shown as follows:
(9)
(10)
(11)
(12)
Wherein, a represents the quantity of input text which is correctly classified by the classifier to some category, b represents the quantity of input text which is wrongly classified by the classifier to some category, c represents the quantity of input text which is excluded by the classifier out of some category wrongly, and n represents the category quantity in the data set.
4.3 Experiment results
4.3.1 Analysis on parameter ws value
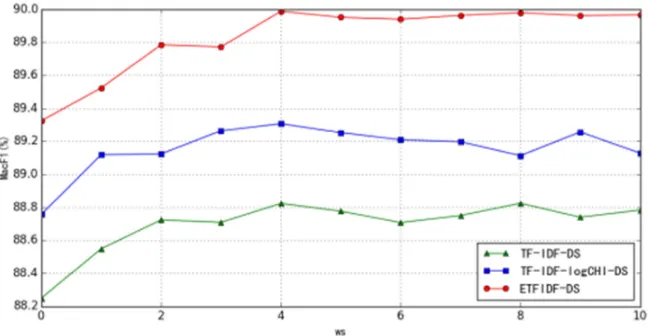
[image:4.612.314.558.201.324.2]The distance ws of feature items in the document is considered in the algorithm based on document feature structure proposed by the paper. On the basis, the influence change of three algorithms-TF-IDF-DS, TF-IDF-logCHI-DS and ETFIDF-DS for final classification categories when ws value lasts from 0 to 9 is validated in the chapter. Table 2 shows classification micro-average MacF1 value of three algorithms under different ws values.
Table 2. Influence of ws values on results.
ws 0 1 2 3 4
TF-IDF-DS 88.25 88.55 88.72 88.71 88.82
TF-IDF-logCHI-DS 88.76 89.12 89.12 89.26 89.31
ETFIDF-DS 89.32 89.52 89.79 89.77 89.99
ws 5 6 7 8 9
TF-IDF-DS 88.78 88.71 88.75 88.82 88.74
TF-IDF-logCHI-DS 89.25 89.21 89.20 89.11 89.26
ETFIDF-DS 89.95 89.94 89.96 89.98 89.96
[image:4.612.148.472.386.554.2]Fold line drawing corresponding to table 2 is shown in Figure 3:
Figure 3. Influence of ws value on results.
It is obviously that the performance of feature vector obtained by method based on document structure in the classification is gradually improved when ws value is between 0 and 9. However, when ws value is larger than 4, the classification performance is not improved basically, and it can be reduced on the contrary. Therefore, it can be concluded that feature T is mostly related to features with distance of 4 generally, and it is weakly with distance larger than 4. The features evenly can produce influence on T as noise information. Therefore, we use the three methods of TF-IDF-DS, TF-IDF-logCHI-DS and ETFIDF-DS for calculating
feature weight in the following experiment, and ws value is 4.
4.3.2 Effectiveness of DS algorithm
Table 3. Comparison of many model results.
No. TF-IDF
TF- IDF-logCHI
ETFID F
TF-IDF-DS
TF-IDF- logCHI-DS
ETFI DF-DS 1(%) 86.68 87.89 88.38 87.63 89.00 89.01 2(%) 87.44 88.24 89.14 88.48 89.35 90.00 3(%) 87.09 87.68 88.44 88.04 88.50 89.57 4(%) 89.01 89.31 90.00 89.97 89.37 90.70 5(%) 88.31 88.82 89.37 88.07 90.00 89.30 6(%) 87.61 88.05 88.74 88.86 88.59 89.52 7(%) 89.42 89.64 90.83 90.23 89.84 91.26 8(%) 88.56 89.29 90.12 88.61 89.13 89.99 9(%) 88.15 89.01 89.85 90.24 89.69 91.11 10(%) 88.03 88.45 89.22 88.06 89.63 89.43 Avg (%) 88.03 88.64 89.41 88.82 89.31 89.99
[image:5.612.315.561.176.491.2]Fold line drawing corresponding to Table 3 is shown in figure 4.
Figure 4. Comparison of various model results.
Figure 4 shows that weight correction algorithm DS based on document feature structure can improve the algorithms of TF-IDF, TF-IDF-logCHI and ETFIDF. Average value is obtained from the F1 value in 10 experiments. It is obvious that DS algorithm can improve TF - IDF algorithm F1 value from 88.03 to 88.82%. F1 value of TF-IDF-logCHI algorithm is improved from 88.64% to 89.31%. F1 value of ETFIDF algorithm is improved from 89.41% to 89.99%. These results show the effectiveness of weight correction algorithm based on document feature structure. Meanwhile, it is also obvious that the correction algorithm has a certain generality. The result is verified in many weight algorithms.
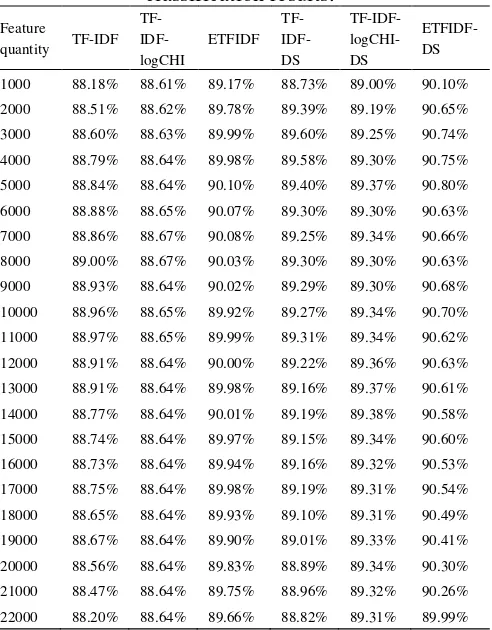
4.3.3 Analysis on feature selection influence The feature dimension of hotel data set after feature extraction is 22942D. The dimensions are too high during classification. CHI statistics is adopted for feature selection aiming at various weight computing methods applied in the paper. The feature quantity is increased by 1000 each time since 1000, which is increased till 22000. The micro average F1 value under all feature quantity is shown in Table 4.
Table 4. Influence of feature quantity on classification results.
Feature
quantity TF-IDF TF- IDF-logCHI
ETFIDF TF- IDF-DS
TF-IDF- logCHI-DS
ETFIDF-DS
1000 88.18% 88.61% 89.17% 88.73% 89.00% 90.10% 2000 88.51% 88.62% 89.78% 89.39% 89.19% 90.65% 3000 88.60% 88.63% 89.99% 89.60% 89.25% 90.74% 4000 88.79% 88.64% 89.98% 89.58% 89.30% 90.75% 5000 88.84% 88.64% 90.10% 89.40% 89.37% 90.80% 6000 88.88% 88.65% 90.07% 89.30% 89.30% 90.63% 7000 88.86% 88.67% 90.08% 89.25% 89.34% 90.66% 8000 89.00% 88.67% 90.03% 89.30% 89.30% 90.63% 9000 88.93% 88.64% 90.02% 89.29% 89.30% 90.68% 10000 88.96% 88.65% 89.92% 89.27% 89.34% 90.70% 11000 88.97% 88.65% 89.99% 89.31% 89.34% 90.62% 12000 88.91% 88.64% 90.00% 89.22% 89.36% 90.63% 13000 88.91% 88.64% 89.98% 89.16% 89.37% 90.61% 14000 88.77% 88.64% 90.01% 89.19% 89.38% 90.58% 15000 88.74% 88.64% 89.97% 89.15% 89.34% 90.60% 16000 88.73% 88.64% 89.94% 89.16% 89.32% 90.53% 17000 88.75% 88.64% 89.98% 89.19% 89.31% 90.54% 18000 88.65% 88.64% 89.93% 89.10% 89.31% 90.49% 19000 88.67% 88.64% 89.90% 89.01% 89.33% 90.41% 20000 88.56% 88.64% 89.83% 88.89% 89.34% 90.30% 21000 88.47% 88.64% 89.75% 88.96% 89.32% 90.26% 22000 88.20% 88.64% 89.66% 88.82% 89.31% 89.99%
[image:5.612.63.293.237.360.2]Fold line drawing corresponding to Table 4 is shown in Figure 5.
[image:5.612.115.496.581.736.2]Table 4 and Figure 5 show that ETFIDF-DS algorithm based on document feature structure has the best performance in classification. The obtained F1 value is the highest when the feature quantity is 5000. Meanwhile, it is obvious that feature weight algorithm integrated with DS has better performance compared with original algorithm classification. Therefore, it can be concluded that weight algorithm based on document feature structure is beneficial for improving text classification performance.
5 CONCLUSION
In the paper, improvement of feature weight algorithm in text representation is mainly studied. Weight computing method based on document feature structure DS is proposed. DS matrix is introduced on TF-IDF, TF-IDF-logCHI and ETFIDF methods undergoes weight correction. TF-IDF-DS, TF-IDF-logCHI-DS and ETFIDF-DS models are obtained. It is discovered through comparison that classification effect is improved as a whole by DS-based weight algorithm. However, the paper still has the following deficiencies:
Firstly, DS computation mode proposed in the paper is not the best representation of document structure. Figure 4 shows that the classification effect obtained from DS-based algorithm is not improved in some experiments. It is obvious that the algorithm is certain instability. The document structure representation still should be further studied.
Secondly, SVM is utilized only for classification experiment aiming at choice of classifiers. Therefore, other classifiers also can be considered in the experiment. The representation effect of DS-based algorithm on other classifiers is validated.
Finally, experiment corpus of the paper is limited to sentiment classification. Experiment is not implemented on theme-related classification. Therefore, wider corpus can be selected in future study for experiment, thereby validating the universality of algorithm improvement.
REFERENCES
[1] Duan Jiangli. Research of Feature Selection and Weighting Algorithm in Text Classification System Based on SVM. Taiyuan University of Technology, 2011.
[2] Shi Congying, Xu Chaojun, Yang Xiaojiang. Study of TFIDF Algorithm. Computer Application, 2009, 29 (B06): 167-170.
[3] How B C, Narayanan K. An Empirical Study of Feature Selection for Text Categorization based on Term Weightage// Web Intelligence, 2004. WI 2004. Proceedings. IEEE/WIC/ACM International Conference on. 2004:599-602.
[4] Deng Z H, Tang S W, Yang D Q, et al. A Linear Text Classification Algorithm Based on Category Relevance Factors. Lecture Notes in Computer Science, 2002, 2555:88-98.
[5] Shen Zhibin, Bai Qingyuan. Improvement of Feature Weighting Algorithm in Text Classification. Journal of Nanjing Normal University: Engineering and Technology Edition, 2008, 8 (4): 95-98.
[6] Tai Deyi, Wang Jun. Improvement Feature Weighting Algorithm for Text Classification. Computer Engineering, 2010, 36 (9):197-199.
[7] Zhang Yu, Zhang Dexian. Improved Feature Weight Algorithm. Computer Engineering, 2011, 37 (5): 210-212. [8] Lu Yonghe, Li YanFeng. Improvement of Text Feature
Weighting Method Based on TF-IDF Algorithm. Library and Information Service 2013, 57 (3): 90-95.
[9] Guo Hongyu. Research on term weighting algorithm based on information entropy theory. Computer Engineering and Applications, 2013 (10): 140-146.
[10] Zhao Xiaohua, Ma Jianfen, Modify of Method of Feature’s Weight in Text Classification algorithm. Computer Knowledge and Technology, 2009, 5 (36) : 10626-10628.
[11] Li Yuan. Research on Word Segmentation and Feature Selection of Chinese Text Classification. Jilin University, 2011.
[12] Zhang Aihua, Jing Hongfang, Wang Bin, etc. Research on Effects of Term Weighting Factors for Text Categorization. Journal of Chinese Information, 2010, 24 (3):97-104. [13] Tan Songbo. Hotel comment corpus about Chinese
emotional digging [DB/OL].