2016 International Conference on Electronic Information Technology and Intellectualization (ICEITI 2016) ISBN: 978-1-60595-364-9
SV Protocol Controller Based on Precise Time
Control of FPGA
Bing Ai, Ruihan Wang, Kun Liu and Qiang Shi
ABSTRACT
Digital input electric energy meter has been widely used in smart substation, this paper reviews three applications of smart substation digital input electric energy meter, correspondence analysis scheme of digital input electric energy meter accuracy. In order to analyze the digital transmission can affect the measurement accuracy of sampling value to quantitatively, based on the design of a field programmable gate array (FPGA) implementation of precise time control sampling measurements (SV) message controller. The implementation of frame loss or error and random number generation, sending SV messages between discrete values of key technology loop regulation etc. The test results demonstrated the feasibility of this technique, smart substation digital measuring device calibration and explore smart substation digital power lay the foundation of measurement scheme.
INTRODUCTION
Digital input meter input signal as a digital signal, which cannot be used by the traditional meter basic error checking system and method[2-6]. Digital input meter calibration should be from the function(error detection and correction, anti-network traffic) to consider error problem, or the digital power metering system should be as a whole. As the key device for digital electric energy metering. Effect of time performance and accuracy of the data information of merging unit on the measurement equipment has been more and more attention. In the condition of reference voltage, the reference current, reference frequency and cosφ equals to 1.0, when the sampled value packet loss rate does not exceed 0.01%, measurement accuracy of the instrument in line with the appropriate level of accuracy requirements.
Considering the influence of digital input power meter applications and access to forms, the accuracy of digital input meter is also closely rated to merging unit delay, packet interval discrete values and other characteristics.
There is an urgent need for a device of simulating the exception of SV digital transmission and electrical signals exactly in order to quantitatively analyze, evaluate the capability of digital input meter error detection and error correction and explore intelligent digital substation power metering applications.
This paper reviews three typical applications of smart substation digital input electric energy meter, correspondence analysis scheme of digital input electric energy meter accuracy, discusses the key technologies of generating a random number of packets dropped frames, sending interval discrete values to achieve closed loop regulation, providing total solutions. Finally, the experimental data are given.
TYPICAL APPLICATIONS OF INTELLIGENT SUBSTATION DIGITAL ENERGY METERING AND FACTORS AFFECT METER ACCURACY
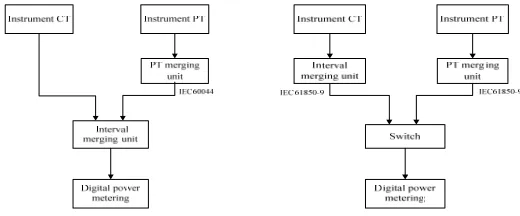
Scheme I as shown in Figure 1. It is characterized by a digital input meter receiving real-time current and voltage sampling value of the packets directly interval, exported by interval merging unit output. The number of PT merging unit could be reduced if we use the combined current and voltage transformers.
[image:3.612.164.424.145.253.2]
Figure 1. Scheme of digital power metering. Figure 2. Scheme of digital power metering.
Compared to traditional power meter, the factors affecting the accuracy of meter about scheme I are: The quantization error of the combined unit’s front sampling, synchronization error, sampling frequency, SV transmission FER/BER, SV packet interval discrete values.
Scheme II as shown in Figure 2. It is characterized by receiving digital signal from interval merging unit and the PT merging unit, achieving error compensation, calculating electric power and energy by digital signal processing algorithms. It is necessary for digital input meter to have two-way signal reception and processing capability if we do not use network services.
Compared to traditional power meter, the factors affecting accuracy of meter about scheme II are: The quantization error of the combined unit’s front sampling, synchronization error, sampling frequency, SV transmission FER/BER, SV packet interval discrete values, synchronization algorithm error of digital input meter, network data throughput handling capacity. Among them, the risk of accuracy tolerance caused by network traffic anomalies is bigger than the scheme I.
Scheme III as shown in Figure 3. It is characterized by receiving digital signal from interval merging unit and the PT merging unit, achieving error compensation, obtaining the phase current instantaneous value by vector sum of operation, calculating electric power and energy by digital signal processing algorithms. It is necessary for digital input meter to have at least two-way signal reception and processing capability if we do not use network services.
THE OVERALL PROGRAM DESIGN
Digital input meter error detection and network throughput processing capability were checked and evaluated by analyzing basic test method of digital power meter, increasing in the SV message controller between network equipment and meter, simulating a situation of electrical signals or synchronous abnormal in the process of the SV network transmission. Network transmission anomaly including signal lines were severely disrupted in the transmission process of the SV message, frame drop and error code caused by the wrong CRC error detection code. Electrical signals or sync signal anomaly includes data quality significance exception and synchronization signal anomaly.
[image:4.612.304.469.260.375.2]
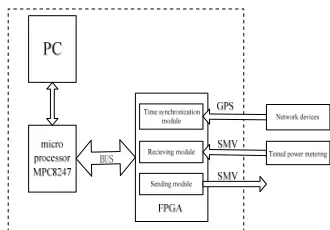
Figure 3. Digital power metering. Figure 4. SV controller system architecture diagram.
The SV packet controller uses a dual CPU architecture of FPGA and POWERPC, takes full advantage of the flexibility programmable logic, rich peripheral interfaces, high-speed parallel processing and high real-time characteristics of FPGA. Sending and receiving the SV message by optical Ethernet transceiver controlled by FPGA, taking the characteristics of the POWERPC stability and logic operation ability, establishing communication between microprocessor MPC8247 and the PC, achieving the function of controlling packet loss, changing the nominal delay, adjusting packet sending interval discrete values and other anomalies. Meanwhile, in order to achieve precise time control, using hardware on precision OCXO, and receiving real-time external GPS reference clock signal through the FPGA, controlling the time rate of change in accordance with the absolute time.
parameters will be sent to the embedded microprocessor according to the internal protocol and pre-analysis results.
THE KEY TECHNICAL DESIGN PRINCIPLES
1.The Generation of Random Numbers
Normally, an exception occurred in the form of roughly divided into hardware failure or software logic causes and random anomalies caused by the overall characteristics of the hardware and software system or external interference. Whole cycle data are used for a settlement window throughout all kinds of digital power meter power metering algorithms, and extraction algorithms based on random numbers to generate random numbers window are used in order to simulate actual operating conditions mentioned above. Random number generated by providing a control window proportion of total length (total) and change the frame number (act), and interval forms the changing proportions of simulation. For example, analog SV packet loss 50 per 4000 means total=4000 and act=50 when setting variable n[0,total-1] and defining send packet sequence number, in which situation it will reorganize to control real-time data whenever n cycle to 0.
2. The Simulation After Dropping Frames
We set dtCounter as the variable of original message count value reaches a relatively seconds, and variable f as PC software configurable packet transmission frequency. In such condition, regardless continuous or random control mode is choose, parameters per frame send are as followings:
seqdtCounter / (count / 1000) (1)
offsetdtCounter%(count/1000) (2)
When continuous manner is selected as the control mode, it generates a random number by calling an equal probability random number extraction algorithm based on the probability of the window and the random number belongs to [0,total-act-1], so that the SV packets will be abandoned if xnxact, in contrast, the SV
then it will be abandoned, else it will be sent. In comparison, if act≥total/2, the array flag[total] with each element initialed with 0 will be created, and generates total-act random numbers (x,y,…) from natural number range [0,total-1], after that flag[x], flag[y],…will all be set 1. So that current SV packet will be sent if it send sequence n satisfy flag[n]=1 and abandon the packet if not.
3.The Simulation By Sending Interval Dispersion
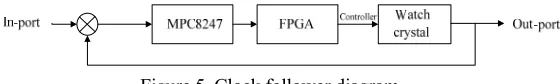
[image:6.612.161.441.399.441.2]Considering the former signal source packet obstruction or interval dispersion to more than 1ms or other adverse conditions, 3ms’s buffer is set in embedded system. Because of the difference of the accuracy of the clock oscillator between interfaced signal source and SV controller, a closed-loop adjustment system is created like Figure 5. between the in-port and out-port in SV controller in order to prevent SV controller interrupt output packets or overflow, and the closed-loop adjustment system constitutes the clock follower regulator. So input signal is the number of packets received and the output is the number of packets sent, MPC8247 is a controller, FPGA is an actuator and watch crystal is the controlled object. MPC8247 computes the difference between the input and output of both the number of packets immediately, at the same time it controls FPGA’s adjustment of crystal interrupt count value according to the difference between the range, to realize the consistency of the sending rate between the signal source and SV packet controller.
Figure 5. Clock follower diagram.
Setting variable [-10,10] as the packet interval discrete values, according to PC software configurable packet transmission frequency and Statistical count value per unit time of FPGA, we can calculate the count value related
toist*count/1000000, and the count value corresponding average transmit
packets per frame interval is tcount/f , when the control mode is chose as a continuous manner, a random number x will be generated by calling random numbers equal probability extraction algorithm based on window. When the sequence n sent by current SV packet satisfies xnxact and x is odd, then
is regarded as negative number, and if x is even, then it is regarded as positive number and corresponding part sends parameters like:
seq n/(f/1000) (3)
Note: seq is ms number, seq [0,999], offset represents ms’s relative delay. At the same time, if n<x or n xact, it will send parameters as:
seqn/(f/1000) (5)
offsetn%(f/1000)*t (6)
Note :sum int [ ]
0
i er smp
n
i
(7)
Besides, if the control model is set as random manner, by calling the window-based equal probability random number extraction algorithm for cnt times, we can get random number arrays x, y, … that belongs to [0, total-cnt*blocknum-1], in which cnt[1,act]. When iniblocknum and i{x,y,…}, if n equals i, then smpinter[n]= blocknum, else smpinter[n]=0. Parameters sent is calculated by equation (5) and (6).
THE SIMULATION WITH SYNCHRONIATION DATA QUALITY ANOMALIES
We set variable dt Counter as relatively seconds count value when original message arrives. Whether the control model is set as continuous manner or random one, parameters sent by per frame packets organization is calculated under equation (1) and (2). As long as n is in sampling sequence, embedded systems based on changes in the data communication with the host computer software to obtain the relative packet header address offset value and the data length, and the original value is replaced with the changes in value, otherwise, the original message is forwarded without any treatment.
Figure 6. Detection of signal source Figure 7. Detection of SV controller discrete values. discrete values.
signal and Figure 7. is an image detection when the interval discrete value equals to 0. The results show that the discrete-time can be adjusted within the configured time control and control accuracy≤ 30ns by using the control technology of message controller in the case of original message sending interval discrete values <= 1 ms.
CONCLUSION
This paper analyzes the different factors that affect the accuracy of energy measurement program on the basis of application solutions for smart substation digitization power measurement. A new packet controller based on the FPGA was proposed by combining digital energy metering basic error test method. The results show that this method could as a reference for the development of intelligent substation digital measuring device and measurement solutions by controlling packet loss and delaying variation rated.
REFERENCES
1. Gao Jia. A. 2011. “Brief Discussion on the Application of the Digital Energy Meter”. Metrology & Measurement Technique, 38 (12): 31-32.
2. Lin Guo-ying, Zhou Shang-li, Sun Wei-ming, et al. 2011. “Calibration Technology of Nontraditional Electric Energy Measuring Equipment in Digitalized Substation”. Proceedings of the CSU-EPSA, 23 (3): 145-148.
3. Hui Yuan, Dongmei Yao, Chaojun Zhang. 2011. “Study on calibration method for digital watt-hour meters”. China Measurement & Test, 48(548): 88-91.
4. Shui Liu, Yang Jie Huang, Bin Li. 2011. “The Study of Calibration Technology for Digital Power Metering”. Electrical Measurement & Instrumentation, 48 (544): 66-71.
5. Xiaoxi, Gao Ying-Nan. 2010. “ Discussion on the Electric Energy Traceability of Digital Power Meter”. Metering International, 2010(2): 14-16.
6. Qian Li, Shuhan Zhang, Yibiao Lu, et al. 2010. “The study of Onsite Metering and Calibration of Fully Digital Power Metering System ”. Electrical Measure mentation, 47(538): 25-28.