Full Length Research Article
SELECTED PROPERTIES OF HYBRID PARTICLEBOARD COMPOSITE MADE FROM OIL PALM
EMPTY FRUIT BUNCH (EFB) AND MERPAUH (IRVINGLA MALAYANAN OLIVE) PARTICLES
BONDED WITH MELAMINE UREA FORMALDEHYDE RESIN
1*
Norul Hisham Hamid,
1Mohd Fitri Yazid,
1Noraishah Hassan and
2Micheal David Hale
1
Faculty of Forestry, Universiti Putra Malaysia (UPM), 43400 UPM Serdang, Selangor, Malaysia
2School of Environment, Natural Resource and Geography, Bangor University, Gwynedd, LL57 2UW,
United Kingdom
ARTICLE INFO ABSTRACT
The Merpauh (Irvingla malayana olive) sawdust was mixed with empty fruit bunch (EFB) of oil palm tree, aimed to improve the homogeneous EFB particleboard. The EFB and Merpauh fibres with diameter of less than 1 mm and more than 1 mm were prepared and they were mixed with ratios of 40:60, 60:40, 80:20 and 100:0. The particleboard with a target density of 750 Kg/m3 and sized of 340mm x 340mm x 12mm were prepared with 12% melamine urea formaldehyde (MUF) and 3 % hardener. The physical and mechanical properties of particleboard were tested in according to JIS 5908: 2003. The results showed that all the physical and mechanical properties of either mixture (EFB/wood) or homogenous EFB particleboards met a minimum requirement of JIS 5908: 2003 standard, except for thickness swelling.
Copyright © 2015 Norul Hisham Hamid et al. This is an open access article distributed under the Creative Commons Attribution License, which permits unrestricted use, distribution, and reproduction in any medium, provided the original work is properly cited.
INTRODUCTION
For more than 2 decades, Malaysian wood based panel industries especially particleboard and medium density fiberboard are relied on Rubber wood as a main material for their production; due to its abundantly supply from plantation. However, the supply of Rubber wood was declined as a consequence to decline of Rubber tree plantation area from 1.4 million ha in 2001 to 1 million ha in 2009. This is mainly due to low latex price in global market (Teoh et al., 2011). Many Rubber tree plantations were converted to a more profitable Oil palm plantation. This can be observed by the growth of oil palm plantation from only 1.7 million ha in 1990 to 4.8 million ha in 2013, and Malaysia government is targeting for 5.8 million ha by 2020. The annual availability of oil palm stem for trunk, frond and empty fruit bunches (EFB) was estimated
*Corresponding author: Norul Hisham Hamid,
Faculty of Forestry, Universiti Putra Malaysia (UPM), 43400 UPM Serdang, Selangor, Malaysia
to be around 13.6 million logs based on 100,000 ha of replanting each year (Anis et al., 2011). The oil palm trunk had many weaknesses such as low strength, durability, dimensional stability and machining properties (Anis et al., 2011). Conversion of low quality oil palm biomass into composites is a priority solution and its development was reported in many studies (Rozman et al., 2003; Jacob et al., 2004; Abdul Khalil et al., 2010; Mohd Shukri et al., 2011; Hamid et al., 2014).
Among them, only oil palm plywood was successfully commercialised. The oil palm veneer found to be only suitable as a core layer integrated with face and back layers of tropical hardwood veneer; due to its soft structure. The technology to manufacture particleboard and medium density fiberboard is hindrance by a hygroscopic nature of oil palm biomass. The objective of this study is to improve the physical and mechanical properties of oil palm particleboard by hybrid it with tropical wood waste and melamine urea formaldehyde resin.
ISSN: 2230-9926
International Journal of Development Research
Vol. 5, Issue, 03, pp. 3913-3920, March,2015
International Journal of
DEVELOPMENT RESEARCH
Article History:
Received 15th December, 2014
Received in revised form 30th January, 2015
Accepted 27th February, 2015
Published online 31st March, 2015
Key words:
Empty fruit bunches, Merpauh,
Wastes, Particleboard, Hybrid, JIS5908.
MATERIALS AND METHODS
The fresh oil palm Empty fruit bunch (EFB) fibre bundle was obtained from Seri Ulu Langat Palm oil mill Sdn Bhd, in Dengkil Selangor. The length of the EFB fiber bundle were 5 – 15 cm and its initial moisture content (MC) was ranged from 14% - 15 %. The wood sawdust from Merpauh (Irvingla malayana olive Meerpa) was obtained from BJ Timber Trading, Serdang, Selangor. The Melamine urea formaldehyde (MDF) was supplied by the Malayan Adhesive and Chemical (MAC) Sdn. Bhd., Shah Alam, Selangor.
Processing of EFB Fibre and manufacturing of particleboard
The oil palm fruit bunch was steamed and was pressured to separate the bunch from its fruit. The bunch without fruit was Empty Fruit Bunch. The EFB and Merpauh fibres which further crushed by a crushing machine to obtain a particle diameter of less than 1 mm and more than 1 mm. The mixture of EFB and Merpauh particles with ratios of 40:60, 60:40, 80:20 and 100:0 were prepared for manufacturing the particleboard with a target density of 750 Kg/m3 and sized of 340mm x 340mm x 12mm. The 12% of melamine urea formaldehyde (MUF) and 3 % hardener were sprayed and blended for 5 minutes. The furnish mat was manually formed using a jig and cold press was applied by ballasted the mat with 70 kg square cement block for 5 minutes. Cold press aimed to reduce thickness and increased the density of the furnish before hot press. The cold press was also aimed to remove air between the particle and resin. The furnish was hot pressed at pressure between 10 bar - 30 bar with temperature of 160ºC for 7 minutes. The hot press aimed to compress the material to the required thickness and to heat cures the resin to form the bonds that give the panel a specific properties and strength. All the particleboards were conditioned in a conditioning room at RH 65± 5% relative humidity (RH), 20±2 ºC for 7 days. All the physical and mechanical properties of particleboard were tested according to Japanese Industrial Standard JIS A 5098 (2003). The conditioned particleboard were trimmed and cut into a smaller specimen for testing as shown in Table 1.
Physical and mechanical tests
Water Absorption
This test was intended to assess the extent of changes and the rate of water absorption after 24 hour submerged period. The specimens were oven dried, weighed and submerged in 3 cm under the water. The specimens were taken out, wiped with a tissue paper and reweighed. The water absorption was calculated according to the following formula:
Water absorption (WA) = ((M2 – M1)/ M1) x 100
Where: M1 is weight of specimen before immersion (g) and M2 is weight of specimen after immersion (g)
Thickness swelling
The thickness swelling aimed to measure the dimensional changes due to the water absorption. The thickness at the centre of specimen was measured to the nearest of 0.01 mm by using a micrometer before and after submerged in water.
The thickness swelling due to water absorption was calculated as the following formula:
Thickness swelling (TS) = ((T2 – T1)/T1) x 100
Where: T1 is thickness before water absorption (mm), T2 is thickness after absorption (mm).
Density test
The density was obtained by measuring oven dried weight and volume of the specimen. Thedensity was calculated using the following formula:
Density (DN, Kg/m³) = M/V
Where: M is weight of the test piece (kg) and V is volume of the test piece (kg)
Moisture content test
The specimen was weighed, oven dried at 103±2 °C for 24 hours, cooled in silica gel and reweighed. The moisture content was measured as the following formula:
Moisture content (MC) = ((M1 – M0)/M0) X 100
Where: M0 is mass (g) after drying to constant weight at 103±2ºC and M1 is mass (g) before drying.
Static Bending Test
The static bending test was measured using INSTRON universal testing machine. Specimen sized of 25mm X 25mm X 200mm (r x t x l) was used in this study and the distance between the supporting roller was 150mm. The speed rate of 8.0 mm/min speed was applied at the center of the span until the failure occurred. The maximum load of the specimen was recorded. The MoR and MoE were calculated using the following formula:
MOR = (3PL/2bt)
Where: MOR is modulus of rapture (N/mm²), P is Maximum load (N), L is Span between center of support (mm), b is width of the specimen (mm), t is thickness of the specimen (m).
MOE = (∆PL³/4bd³∆s)
[image:2.595.50.274.569.632.2]Where: MOE is modulus of elasticity (N/mm²), L is span between centers of support (mm), ∆P is Increment in load on
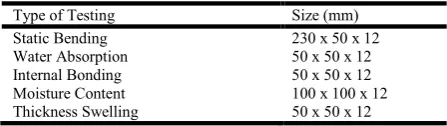
Table 1. Type of testing and its dimensions
Type of Testing Size (mm)
Static Bending 230 x 50 x 12 Water Absorption 50 x 50 x 12 Internal Bonding 50 x 50 x 12 Moisture Content 100 x 100 x 12 Thickness Swelling 50 x 50 x 12
the straight line portion of the load deflection curve (N), b is Width of the specimen (mm), d is Thickness of the specimen (mm), ∆s is increment in deflection corresponding to ∆P increment in load (mm)
Internal Bond Test
The internal bond test aimed to test the strength in tension perpendicular to the plane of the board and the test was conducted using INSTRON universal testing machine. Both surface of the specimens were applied with epoxy resin and attached to the metal block. The metal block were pulled in an opposite directions until the specimen was failure and the maximum load was recorded. Internal bond strength was calculated using the following formula:
IB = (P’/bl)
Where: IB is internal bond (N/mm²), P’ is Maximum load (N) at the time of failing force, b is width of the test pieces (mm), I is length of test pieces (mm)
All the data from the tests were statistically analysed for the analysis of variance (ANOVA) and Waller Duncan using SPSS version 13.
RESULTS AND DISCUSSION
General
The physical and mechanical properties of the particleboard made from empty fruit bunch (EFB) and wood particles using melamine urea formaldehyde (MUF) were evaluated according to the Japanese Industrial Standard for Particleboard (JIS A 5908:2003). Table 4 shows the results of ANOVA on the physical and mechanical properties of particleboard.
All the physical and mechanical properties of the particleboard such as DN, MC, TS, MoR, MoE, and IB were not significantly different (P>0.1) with particle size, except for water absorption. The particleboard made from particle diameter more than 1 mm (46.30 %) had a significantly higher WA than those of particle diameter less than 1 mm (42.96 %). Larger particle size generally had larger voids and this created space for more moisture accommodation (Hamid et al., 2014). The averages DN, MC, WA, TS, MoR, MoE and IB of particleboard made from particle diameter less than 1 mm were 722.13 kg/m3, 18.94 %, 42.96 %, 18.31 %, 5.46 %, 455.94 MPa and 0.11 MPa. While the averages were 693.18 kg/m3, 18.83 %, 46.30 %, 16.57 %, 8.06 MPa, 508.81 MPa
and 0.16 MPa for particleboard made from particle diameter more than 1mm.
Physical Properties
Density
The density of a substance is defined the ratio of its mass to its volume and is expressed in the International system (SI) in units of kilogram per cube (kg/m3) (Glass and Zelinka, 2010). The average density of particleboard was not significantly different with the particle size. The average densities of particleboard were ranged from 672.73 to 746.64 kg/m3 for particle diameter less than 1mm and from 674.82 to 711.87 kg/m3 for particle diameter more than 1mm (Figures 1 and 2). The board densities either particle size or ratio were within the acceptable range of JIS A 5908:2003 (400 kg/m3 – 900 kg/m3).
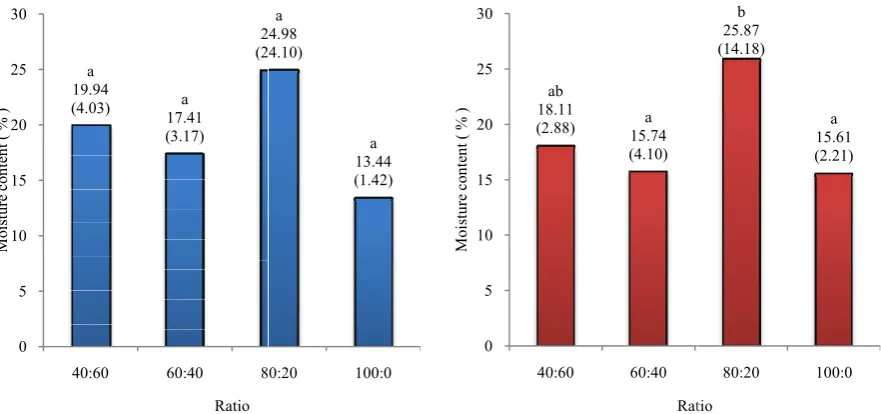
Moisture Content
The averages moisture content was also not significantly different by the particle size, ranging from 13.44 % to 24.98 % in particleboard made from particle diameter less than 1 mm. In contrast, the averages moisture content was not significantly different for 60:40 (15.74 %) and 100:0 (15.61 %) ratios in particleboard made from particle size less than 1 mm. The averages were then significantly increased in 40:60 ratio (18.11%) and reached a maximum values in 80:20 ratio (25.87%). This showed that particleboard made from 100% EFB gave the lowest moisture content (Figures 2 and 3).
Water Absorption
Figures 5 and 6 show the average water absorption after 24 hours submerged period. The water absorption for 100:0 ratios (46.96%) was significantly higher than other ratios in particleboard made from particle diameter less than 1mm.
Meanwhile, the average water absorption was not significantly different with the ratio in particleboard made from particle diameter more than 1mm. The average water absorption of 60:40 ratio was the highest (49.80%). Sreekala et al. (2002) mentioned that a weak compatibility between the particle surface and the adhesive could lead to the formation of void structures within the composites, which facilitates water absorption. Water absorption is probably controlled by the structure related factors such as wood cell wall collapse during consolidation, the vertical density distribution, and horizontal
[image:3.595.82.516.504.592.2]density distribution in the panel (Xu, 1993). Nurrohana et al. (2011) reported that the particleboard made from oil palm trunk with fibre diameter less than 1 mm, density of
Table 2. The summary of ANOVA on physical and mechanical properties of particleboard
Properties Particle diameter Df F Significance
< 1 mm >1 mm
Density (DN, Kg/m3) 722.13 (66.29) 693.18 (77.65) 1 1.86 0.18NS
Moisture content (MC, %) 18.94 (12.26) 18.83 (8.28) 1 0.01 0.97NS
Water absorption (WA, %) 42.96 (3.95) 46.30 (4.82) 1 6.87 0.01** Thickness swelling (TS, %) 18.31 (3.76 ) 16.57 (1.30) 1 4.60 0.04NS
Modulus of rupture (MoR, MPa) 5.56 (3.17) 8.06 (5.70) 1 3.52 0..07NS Modulus of elasticity (MoE, MPa) 455.94 (220.52) 508.81 (356.09) 1 0.38 0.54NS
Internal bonding (IB, MPa) 0.11 (0.11) 0.16 (0.14 ) 1 1.56 0.22NS
**NS is not significant at p>0.1, ** is significant at P<0.05, The parentheses are standard deviations.
500 kg/m3 density, 12% urea formaldehyde and 1% wax gave water absorption of 33.15%. The highest WA (97.56%) was from particleboard produced from particle diameter more than 2 mm, 8% urea formaldehyde, without wax and density of 700 kg/m3. The particleboard made of oil palm fibre diameter less than 1 mm from bark, leaves, frond, and core part of trunk with phenol formaldehyde and density of 800 kg/m
ranged from 58% to 70% (Hashim et al., 2011).
of 10 % polyhydroxyalkanoates to oil palm trunk particle (less than 1 mm) to produce binder less particleboard at density of 800 kg/cm3 only reduced WA to 58 % compared to untreated board (85%) (Baskaran et al., 2012). This indicates that particleboard made from melamine urea formaldehyde in this study absorbed less water compared to phenol formaldehyde.
[image:4.595.81.522.332.539.2]Figures in the parentheses are standard deviations. Mean followed by the same letter(s) in the same bar are not significant different at the 0.05 probability level according to the Waller
Figure 1. The average density of particleboard made from particle diameter less than 1 mm.
Figures in the parentheses are standard deviations. Mean followed by the same letter(s) in the same bar are not different at the 0.05 probability level according to the Waller
Figure 3. The average moisture content of particleboard made from particle size less than 1 mm.
a 672.73 (94.43)
a 737.60 (56.15)
746.64 (53.41)
620 640 660 680 700 720 740 760
40:60 60:40 80:20
D
en
si
ty
(
k
g
/m
3)
Ratio
a 19.94
(4.03) a
17.41 (3.17)
24.98 (24.10)
0 5 10 15 20 25 30
40:60 60:40 80:20
M
o
is
tu
re
c
o
n
te
n
t
(
%
)
Ratio
3916 Norul Hisham Hamid et al. Selected properties of hybrid particleboard composite made from oil palm empty fruit bunch (EFB) and merpauh (irvingla malayanan olive) particles bonded with melamine urea formaldehyde resi
500 kg/m3 density, 12% urea formaldehyde and 1% wax gave water absorption of 33.15%. The highest WA (97.56%) was from particleboard produced from particle diameter more than mm, 8% urea formaldehyde, without wax and density of 700 . The particleboard made of oil palm fibre diameter less than 1 mm from bark, leaves, frond, and core part of trunk with phenol formaldehyde and density of 800 kg/m3 had a WA ., 2011). The addition of 10 % polyhydroxyalkanoates to oil palm trunk particle (less than 1 mm) to produce binder less particleboard at density of 800 kg/cm3 only reduced WA to 58 % compared to untreated This indicates that particleboard made from melamine urea formaldehyde in this study absorbed less water compared to phenol formaldehyde.
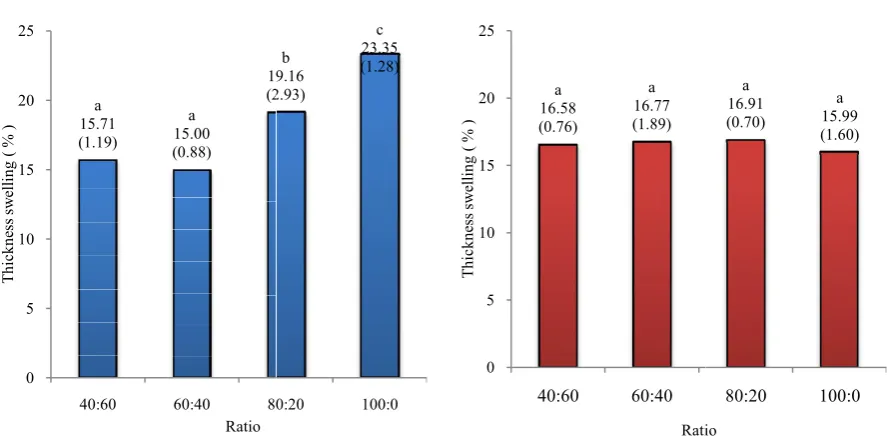
Thickness Swelling
Figures 7 and 8 shows the average thickness swelling of particleboard from both particle diameters.
thickness swelling was increased with the ratio in particleboard made from particle diameter more than 1mm. The 100:0 ratio had the highest per
lowest was 60:40 ratio (15 %). The averages percentage of thickness swelling was not significantly different with the ratio in particleboard made from particle diameter more than 1mm, ranging from 15.99 % to 16.99 %. All the thic
values either particle diameter or ratio were not met the minimum requirement for Japanese standard JIS 5908 (12%). For comparison; the board (600 kg/m
Figures in the parentheses are standard deviations. Mean followed by the same letter(s) in the same bar are not significant different at the 0.05 probability level according to the Waller-Duncan test.
Figure 1. The average density of particleboard made rom particle diameter less than 1 mm.
Figure 2. The average density of particleboard made from particle diameter more than 1 mm.
Figures in the parentheses are standard deviations. Mean followed by the same letter(s) in the same bar are not different at the 0.05 probability level according to the Waller-Duncan test.
Figure 3. The average moisture content of particleboard made from particle size less than 1 mm.
Figure 4. The average moisture content of particleboard made from particle size more than 1 mm. a
746.64 (53.41)
a 731.57 (55.83)
80:20 100:0
a 687.89 (58.51)
a 674.82 (19.10)
650 660 670 680 690 700 710 720
40:60 60:40
D
en
it
y
(
K
g
/m
3
)
Ratio
a 24.98 (24.10)
a 13.44 (1.42)
80:20 100:0
ab 18.11
(2.88) 15.74a (4.10)
0 5 10 15 20 25 30
40:60 60:40
M
o
is
tu
re
c
o
n
te
n
t
(
%
)
Ratio
Selected properties of hybrid particleboard composite made from oil palm empty fruit bunch (EFB) and merpauh (irvingla malayanan olive) particles bonded with melamine urea formaldehyde resi
Figures 7 and 8 shows the average thickness swelling of particleboard from both particle diameters. The averages thickness swelling was increased with the ratio in particleboard made from particle diameter more than 1mm. The 100:0 ratio had the highest percentage (23.35%), and the lowest was 60:40 ratio (15 %). The averages percentage of thickness swelling was not significantly different with the ratio in particleboard made from particle diameter more than 1mm, ranging from 15.99 % to 16.99 %. All the thickness swelling values either particle diameter or ratio were not met the minimum requirement for Japanese standard JIS 5908 (12%). For comparison; the board (600 kg/m3) made with 8% urea
Figures in the parentheses are standard deviations. Mean followed by the same letter(s) in the same bar are not significant
Figure 2. The average density of particleboard made from particle diameter more than 1 mm.
Figures in the parentheses are standard deviations. Mean followed by the same letter(s) in the same bar are not significant
Figure 4. The average moisture content of particleboard particle size more than 1 mm.
a 711.87 (79.36)
a 698.13 (129.48)
80:20 100:0
Ratio
b 25.87 (14.18)
a 15.61 (2.21)
80:20 100:0 Ratio
formaldehyde, 1% wax and unscreened particle gave thickness swelling of 41.25%. However, board (500 kg/m
12% urea formaldehyde, 1% wax and particle diameter more than 1mm gave TS of 12.31% (Nurrohana
averages TS of particleboard made from bark, leave, frond, middle and core parts of oil palm trunk with phenol formaldehyde at density of 800 kg/m3 were ranging from 14 % to 22 % (Hashim et al., 2011). The TS of binderless oil palm particleboard from strand diameter of 3 to 5 cm with density of 800 Kg/cm3 was 41.6 %; while it was 45 % for fine particle (Hashim et al., 2010). The TS of binder less
particleboard made from particle diameter less
blended with 10 % polyhydroxyalkanoates and density of 800 kg/cm3 was 13.55 % (Baskaran et al., 2012).
[image:5.595.77.523.318.536.2]Figures in the parentheses are standard deviations. Mean followed different at the 0.05 probability level according to the Waller
Figure 5. The average water absorption of particleboard made from particle size less than 1 mm.
Figures in the parentheses are standard deviations. Mean followed by the same letter(s) in the same bar are not significant different at the 0.05 probability level according
Figure 7. The average thickness swelling of particleboard made from particle size less than 1 mm.
a 42.75 (2.46)
a 39.93 (3.68)
42.23 (3.51)
36 38 40 42 44 46 48
40:60 60:40 80:20
W
at
er
a
b
so
rp
ti
o
n
(
%
)
Ratio
a 15.71 (1.19)
a 15.00 (0.88)
19.16 (2.93)
0 5 10 15 20 25
40:60 60:40 80:20
T
h
ic
k
n
es
s
sw
el
li
n
g
(
%
)
Ratio
3917 International Journal of Development Research,
formaldehyde, 1% wax and unscreened particle gave thickness swelling of 41.25%. However, board (500 kg/m3) made form 12% urea formaldehyde, 1% wax and particle diameter more (Nurrohana et al., 2011). The averages TS of particleboard made from bark, leave, frond, middle and core parts of oil palm trunk with phenol were ranging from 14 % The TS of binderless oil palm particleboard from strand diameter of 3 to 5 cm with density of was 41.6 %; while it was 45 % for fine particle binder less oil palm particleboard made from particle diameter less than 1 mm blended with 10 % polyhydroxyalkanoates and density of 800
., 2012).
This indicates that melamine urea formaldehyde and wax used in this study could not reduce the
EFB fibres, despite MUF is classified as moisture resistance adhesive.
Mechanical Properties
Static bending is an important mechanical property, because in most structures wood is subjected to loads which cause it to bend (Tsoumis, 1991).
Modulus of Rupture
The average MoR was significantly increased with increasing ratio in particleboard made from particle diameter less than
Figures in the parentheses are standard deviations. Mean followed by the same letter(s) in the same bar are not significant different at the 0.05 probability level according to the Waller-Duncan test.
Figure 5. The average water absorption of particleboard made from particle size less than 1 mm.
Figure 6. The average water absorption of particleboard made from particle size more than 1 mm.
Figures in the parentheses are standard deviations. Mean followed by the same letter(s) in the same bar are not significant different at the 0.05 probability level according to the Waller-Duncan test.
Figure 7. The average thickness swelling of particleboard made from particle size less than 1 mm.
Figure 8. The average thickness swelling of particleboard made from particle size more than 1 mm. a
42.23 (3.51)
b 46.96 (2.98)
80:20 100:0
a 44.21 (3.75)
a 49.80 (7.46)
41 42 43 44 45 46 47 48 49 50 51
40:60 60:40
W
at
er
a
b
so
rp
ti
o
n
(
%
)
Ratio
b 19.16 (2.93)
c 23.35 (1.28)
80:20 100:0
a 16.58 (0.76)
a 16.77 (1.89)
0 5 10 15 20 25
40:60 60:40
T
h
ic
k
n
es
s
sw
el
li
n
g
(
%
)
Ratio nal of Development Research, Vol. 05, Issue, 03, pp. 3913-3920, March, 2015
This indicates that melamine urea formaldehyde and wax used in this study could not reduce the hygroscopicity nature of , despite MUF is classified as moisture resistance
Static bending is an important mechanical property, because in most structures wood is subjected to loads which cause it to
The average MoR was significantly increased with increasing ratio in particleboard made from particle diameter less than
by the same letter(s) in the same bar are not significant
ater absorption of particleboard made from particle size more than 1 mm.
Figures in the parentheses are standard deviations. Mean followed by the same letter(s) in the same bar are not significant
Figure 8. The average thickness swelling of particleboard made from particle size more than 1 mm.
a 44.31 (1.97)
a 46.87 (2.82)
80:20 100:0 Ratio
a 16.91 (0.70)
a 15.99 (1.60)
80:20 100:0
1mm (Figure 9). The 100:0 ratio had the highest MoR (9.36 MPa) and the lowest was 40:60 ratio (2.92 MPa), in particleboard made from particle diameter less than 1mm (Figure 9). On the contrary, the average MoR was significantly highest in 100:0 compared to other ratios in particleboard diameter more than 1mm. The average MoR for 40:60, 60:40, and 80:20 were 3.71MPa, 5.53MPa and 6.99MPa respectively. Overall, only the MoR from 100:0 ratio of particleboard made from both diameters met the minimum requirement of JIS 5908:2003 (8MPa). The averages MoR of oil palm particleboard made from particle diameter less than 1mm and more than 2mm were 6.53Mpa and 13.02Mpa respectively
Figures in the parentheses are standard deviations. Mean followed by the same letter(s) in the same bar are not significant different at the 0.05 probability level according to the Waller
Figure 9. The average MoR of particleboard made from particle size less than 1 mm.
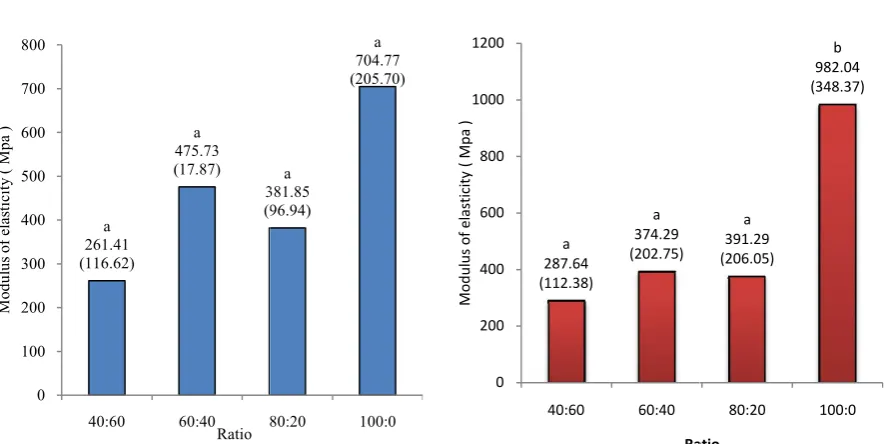
Figures in the parentheses are standard deviations. Mean followed by the same letter(s) in the same bar different at the 0.05 probability level according to the Waller
Figure 11. The average MoE of particleboard made from particle size less than 1 mm.
a 2.92 (1.31) b 5.75 (2.41) 4.21 (1.07) 0 1 2 3 4 5 6 7 8 9 10
40:60 60:40 80:20
M o d u lu s o f ru p tu re ( M p a ) Ratio a 261.41 (116.62) a 475.73 (17.87) 381.85 (96.94) 0 100 200 300 400 500 600 700 800
40:60 60:40 80:20
M o d u lu s o f el as ti ci ty ( M p a ) Ratio
3918 Norul Hisham Hamid et al. Selected properties of hybrid particleboard composite made from oil palm empty fruit bunch (EFB) and merpauh (irvingla malayanan olive) particles bonded with melamine urea formaldehyde resi
1mm (Figure 9). The 100:0 ratio had the highest MoR (9.36 MPa) and the lowest was 40:60 ratio (2.92 MPa), in particleboard made from particle diameter less than 1mm contrary, the average MoR was significantly highest in 100:0 compared to other ratios in particleboard diameter more than 1mm. The average MoR for 40:60, 60:40, and 80:20 were 3.71MPa, 5.53MPa and 6.99MPa respectively. o of particleboard made from both diameters met the minimum requirement of JIS The averages MoR of oil palm particleboard made from particle diameter less than 1mm and more than 2mm were 6.53Mpa and 13.02Mpa respectively
(Nurrohana et al., 2011). The MoR of oil palm particleboard made from phenol formaldehyde either using bark, leave, frond, middle or core parts of trunk were ranging from 8 MPa to 16 MPa (Hashim et al., 2011).
palm particleboard from strand sized of 3 to 5 cm with density of 800 Kg/cm3 was 25 MPa; while fine particle had MoR of 4.9 MPa (Hashim et al., 2010).
palm particleboard made from particle diameter less
mm blended with 10 % polyhydroxyalkanoates and density of 800 kg/cm3 was 11 MPa; while the MoR of untreated board was 9 MPa (Baskaran et al
particleboard either particle diameter was probably caused by
Figures in the parentheses are standard deviations. Mean followed by the same letter(s) in the same bar are not significant different at the 0.05 probability level according to the Waller-Duncan test.
[image:6.595.80.524.334.556.2]of particleboard made from particle size less than 1 mm.
Figure 10. The average MoR of particleboard made from particle size more than 1 mm.
Figures in the parentheses are standard deviations. Mean followed by the same letter(s) in the same bar different at the 0.05 probability level according to the Waller-Duncan test.
Figure 11. The average MoE of particleboard made from particle size less than 1 mm.
Figure 12. The average MoE of particleboard made from particle size more than 1 mm.
ab 4.21 (1.07) c 9.36 (3.12) 80:20 100:0 a 3.70 (1.51) a 5.53 (2.02) 0 2 4 6 8 10 12 14 16 18 40:60 60:40 M o d u lu s o f ru p tu re ( M p a ) Ratio a 381.85 (96.94) a 704.77 (205.70) 80:20 100:0 a 287.64 (112.38) a 374.29 (202.75) 0 200 400 600 800 1000 1200 40:60 60:40 M o d u lu s o f el as ti ci ty ( M p a ) Ratio
Selected properties of hybrid particleboard composite made from oil palm empty fruit bunch (EFB) and merpauh (irvingla malayanan olive) particles bonded with melamine urea formaldehyde resi
The MoR of oil palm particleboard made from phenol formaldehyde either using bark, leave, frond, middle or core parts of trunk were ranging from 8 MPa ., 2011). The MoR of binderless oil palm particleboard from strand sized of 3 to 5 cm with density of 800 Kg/cm3 was 25 MPa; while fine particle had MoR of ., 2010). The MoR of binderless oil palm particleboard made from particle diameter less than 1 mm blended with 10 % polyhydroxyalkanoates and density of was 11 MPa; while the MoR of untreated board et al., 2012). A lower MoR in particleboard either particle diameter was probably caused by
Figures in the parentheses are standard deviations. Mean followed by the same letter(s) in the same bar are not significant
Figure 10. The average MoR of particleboard made from particle size more than 1 mm.
Figures in the parentheses are standard deviations. Mean followed by the same letter(s) in the same bar are not significant
Figure 12. The average MoE of particleboard made from than 1 mm.
a 6.99 (3.20) b 15.99 (5.04) 80:20 100:0 Ratio a 391.29 (206.05) b 982.04 (348.37) 80:20 100:0 Ratio
its lower density (672.73 to 746.64 kg/m3 for particle diameter less than 1mm and from 674.82 to 711.87 kg/m
Modulus of Elasticity
The averages MoE was not significantly different with the ratio in particleboard made from particle diameter less than 1mm, ranging from 261.41Mpa to 704.77Mpa (Figure 11). Same as the MoR, the average MoE was significantly highest in 100:0 ratio (982.04 MPa) compared to other ratio in particleboard made from particle diameter more than 1mm (Figure 12). The averages MoE for 40:60, 60:40 and 80:20 ratios were 287.64 MPa, 374.29 MPa, and 391.29 MPa respectively. The MoE of oil palm particleboard made from 12 % urea formaldehyde, 1 % wax and particle diameter less than 1mm and more than 2mm were 940 MPa and 1850 MPa respectively (Nurrohana et al., 2011).
Internal Bonding
Internal bonding (IB) strength is the maximum stress sustained by a specimen from a test with tension forces applied perpendicular to the surface. Tests are made on specimens in the dry condition to determine the resistance of the specimen to delimitation or splitting in the direction perpendicular to the plane of the board (Cai and Ross, 2010). The averages IB were not significantly different with the ratio in particleboard made from particle diameter less than 1mm, ranging from 0.28MPa to 7.67MPa. In contrast, the averages IB of particleboard made from particle diameter more than 1 mm were significantly different with the ratio. The averages were 7.68MPa, 0.12MPa, 9.83MPa and 0.35MPa for 40:60, 60:40, 80:20 and 100:0 ratios. All the IB values were met a mi requirement of JIS 5908:2003 (0.15Mpa), except for particleboard made by 60:40 ratios from particle diameter more than 1mm.
Figures in the parentheses are standard deviations. Mean followed by the same letter(s) in the same bar are not significant different at the 0.05 probability level according to the Waller
Figure 13. The average IB of particleboard made from particle size less than 1 mm.
a 5.17 (2.14)
a 7.67 (4.84)
a 4.83 (3.76)
0 1 2 3 4 5 6 7 8 9
40:60 60:40 80:20
In
te
rn
al
b
o
n
d
in
g
(
M
p
a
)
Ratio
3919 International Journal of Development Research,
for particle diameter less than 1mm and from 674.82 to 711.87 kg/m3).
The averages MoE was not significantly different with the ratio in particleboard made from particle diameter less than 1mm, ranging from 261.41Mpa to 704.77Mpa (Figure 11). Same as the MoR, the average MoE was significantly highest Pa) compared to other ratio in particleboard made from particle diameter more than 1mm (Figure 12). The averages MoE for 40:60, 60:40 and 80:20 ratios were 287.64 MPa, 374.29 MPa, and 391.29 MPa respectively. The MoE of oil palm particleboard made from 12 % urea formaldehyde, 1 % wax and particle diameter less than 1mm and more than 2mm were 940 MPa and 1850 MPa
Internal bonding (IB) strength is the maximum stress sustained by a specimen from a test with tension forces applied perpendicular to the surface. Tests are made on specimens in the dry condition to determine the resistance of the specimen or splitting in the direction perpendicular to the The averages IB were not significantly different with the ratio in particleboard made from particle diameter less than 1mm, ranging from 0.28MPa rast, the averages IB of particleboard made from particle diameter more than 1 mm were significantly different with the ratio. The averages were 7.68MPa, 0.12MPa, 9.83MPa and 0.35MPa for 40:60, 60:40, 80:20 and 100:0 ratios. All the IB values were met a minimum requirement of JIS 5908:2003 (0.15Mpa), except for particleboard made by 60:40 ratios from particle diameter
The IB of oil palm particleboard made from 12% urea formaldehyde, 1% wax and particle diameter less than 1mm and more than 2 mm were 0.42MPa and 0.25MPa respectively (Nurrohana et al., 2011). The averages IB of oil palm particleboard made from phenol forma
of 800 kg/m3 using either bark, leave, frond, middle and core parts of trunk were ranging from 0.1 MPa to 1.3 MPa
et al., 2011). The IB of binderless oil palm particleboard from strand diameter of 3 to 5 cm with density of 80
0.93 MPa; while fine particle had MoR of 0.5 MPa
al., 2010).The IB of binderless oil palm particleboard made from particle diameter less than 1 mm blended with 10 % polyhydroxyalkanoates and density of 800 kg/cm3 was 1.81 MPa, while the IB of untreated board was 0.5 MPa
et al., 2012).
Conclusion
The density, mechanical and internal bonding properties of particleboard made from EFB / wood particles ratios or a homogenous EFB for both particle diameters met a minimum requirement of JIS 5908:2003, except for thickness swelling. Overall, particleboard made from homogenous EFB particle diameter more than 1 mm had the optimum thickness swelling and static bending properties.
REFERENCES
Abdul Khalil, HPS., Bhat,
Degradation, mechano-physical, and morphology properties of empty fruit bunch reinforced polyester composites. Journal of Bioresource
Anis, M., Kamaruddin, H., Astimar 2011. Plywood from oil palm trunks. Research 23: 1159 -1165.
parentheses are standard deviations. Mean followed by the same letter(s) in the same bar are not significant different at the 0.05 probability level according to the Waller-Duncan test.
Figure 13. The average IB of particleboard made from less than 1 mm.
Figure 14. The average IB of particleboard made from particle size more than 1 mm.
a 4.83 (3.76)
a 0.28 (9.10)
80:20 100:0
a 7.68 (2.07)
a 0.12 (4.67) 0
2 4 6 8 10 12
40:60 60;40
In
te
rn
al
b
o
n
d
in
g
(
M
p
a
)
Ratio
International Journal of Development Research, Vol. 05, Issue, 03, pp. 3913-3920, March, 2015
The IB of oil palm particleboard made from 12% urea formaldehyde, 1% wax and particle diameter less than 1mm and more than 2 mm were 0.42MPa and 0.25MPa respectively The averages IB of oil palm particleboard made from phenol formaldehyde at the density using either bark, leave, frond, middle and core parts of trunk were ranging from 0.1 MPa to 1.3 MPa (Hashim The IB of binderless oil palm particleboard from strand diameter of 3 to 5 cm with density of 800 kg/cm3 was 0.93 MPa; while fine particle had MoR of 0.5 MPa (Hashim et The IB of binderless oil palm particleboard made from particle diameter less than 1 mm blended with 10 % polyhydroxyalkanoates and density of 800 kg/cm3 was 1.81 the IB of untreated board was 0.5 MPa (Baskaran
The density, mechanical and internal bonding properties of particleboard made from EFB / wood particles ratios or a homogenous EFB for both particle diameters met a minimum ement of JIS 5908:2003, except for thickness swelling. Overall, particleboard made from homogenous EFB particle diameter more than 1 mm had the optimum thickness swelling
I. and Sartika, MY. 2010. physical, and morphology properties of empty fruit bunch reinforced polyester
Journal of Bioresource 5(4): 2278-2296. , Astimar, AA. and Mohd. Basri, W. 2011. Plywood from oil palm trunks. Journal of Oil Palm parentheses are standard deviations. Mean followed by the same letter(s) in the same bar are not significant
Figure 14. The average IB of particleboard made from particle size more than 1 mm.
a 9.83 (6.10)
b 0.35 (0.18)
80:20 100:0
Ratio
Baskaran, M., Hashim, R., Said, N., Mohamed Raffi, S., Balakrishnan, K., Sudesh, K., Sulaiman, O., Arai, T., Kosugi, A., Mori, Y., Sugimoto, T. and Sato, M. 2010. Properties of binderless particleboard from oil palm trunk with addition of polyhydroxyalkanoates. Composites (Part B):1109-1116. Doi:10.1016/j.compositesb.2011.10.008. Cai, Z. and Ross, RJ. 2010. Mechanical properties of
wood-based composites materials. Wood handbook: Wood as Engineering Material. Madison, WI: Department of Agriculture, Forest Services.
Glass, SV. and Zelinka, 2010. Moisture relations and physical properties of wood. Wood as an Engineering Material: Chapter 4. General Technical Report FPL; GTR-190. Madison, WI: U.S. Department of agricultural, Forest Service, Forest Product Laboratory. pp. 4.1-4.19.
Rozman, H.D., Saad, MJ. and Mohd Ishak, ZA. 2003. Flexural and impact properties of oil palm empty fruit bunch (EFB)–polypropylene composites—the effect of maleic anhydride chemical modification of EFB”. Polymer Testing 22: 335–341
Hamid, NH., Hale, M. and Ahmad Ludin, N. 2014. Equilibrium moisture content and moisture exclusion efficiency of acetylated rattan (Calamus manan). Journal of Tropical Forest Science 26(1): 32-40.
Hashim, R., Saari, N., Sulaiman, O., Sugimoto, T., Hiziroglu, S., Sato, M. and Tanaka, R. 2010. Effect of particle geometry on the properties of binderless particleboard manufactured from oil palm trunk. Materials and Design 31: 4251-4257. Doi:10.1016/j.matdes.2010.04.012. Hashim, R., Wan Nadhari, WNA., Sulaiman, O., Hiziroglu, S.,
Sato, M., Kawamura, F., Seng, TG., Sugimoto, T. and Tanaka, R. 2011. Evaluation of some properties of exterior particleboard made from oil palm biomass. Journal of Composites Materials 45: 1659. Doi: 10.1177/0021998310385028.
Jacob, M., Thomas, S. and Varughese, KT. 2004. Mechanical properties of sisal/oil palm hybrid fibre reinforced natural rubber composites. Journal of Composites Science and Technology 64: 955-965. Doi:10.1016/S0266-3538(03)00261-6.
JIS-A 5098. 2003. Particleboard, Japanese Standards Association, 1-24 Akasaka, 4 Minato-ku, Tokyo 107, Japan.
Mohd Shukri, MR., Razak, W., Othman, S., Janshah, M., Aminuddin, M., Tamar, AT. and Izyan, K. 2011. Properties of composites boards from oil palm frond agriculture waste. Journal of Bioresource 6(4): 9-19.
Nurrohana, A., Jamaludin, K., siti Zalifah, M., Shaik Abdul Karim, Y. and Anis, M. 2011. Manufacture and properties of oil palm particleboard. International Symposium and Exhibition in Sustainable Energy and Environment 1-3 June 2011, Melaka, Malaysia. Doi: 978-4577-0342-3/11. Sreekala, MS., George, J., Kumaran, MG. and Thomas, S.
2002. The mechanical performance of hybrid phenol formaldehyde – based composites reinforced with glass and oil palm fibres. Composite Science Technology 62: 339-353.
Teoh, YP., Mat Don, M. and Ujang, S. 2011. Assessment of the properties, utilization, and preservation of rubberwood (Hevea brasiliensis): a case study in Malaysia. Journal of Wood Science 57:255–266.
Tsoumis, G. 1991. Science and Technology of Wood. Structure, Properties and Utilization. Van Nostrand reinhold. New York. 491p.
Xu, W. 1993. Primary wood processing, Principle and Practice. Horizontal Density Distribution of particleboard. Origin and implications dissertation. London: Chapmall & Hall. pp. 102-103.