METEOROLOGICAL SERVICE
SOLAR RADIATION OBSERVATIONS 1981
U.D.C.
551. 506.3
551. 521. 12(41'.',
CON TEN T S
Solar Radiation Observations at Valentia Observatory
1. Introduction
2. Site of Observatory
3. Measurement of Global Solar Radiation
4. Measurement of Diffuse Solar Radiation
5. Measurement of Direct Sun Radiation
6. Measurement of Long-wave (Infra-Red) Radiotion
7. Direct Sun Observations
8. Radiation Balance
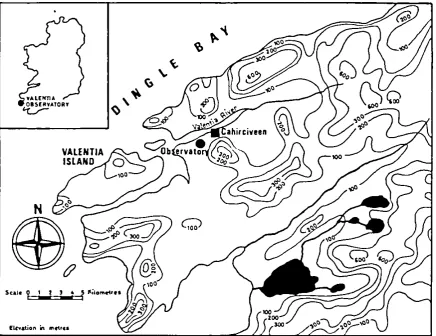
Figure 1 Map showing site of Valentia Observatory and its
Figure 2 Figure 3
environs
General layout of Observatory
Exposure diagram showing Azimuth and Elevation of all objects which obsure the pyranometers
together with Azimuth and Elevation of the sun at different times of the yeor
Solor Radiation Observations ot Kilkenny ~~teoralogical Station
1. Introduction
2. Site of Observations
3. Measurement of Global Solar Radiation
4. Meosurement of Diffuse Solar Rodiation
Figure 4 Map showing site
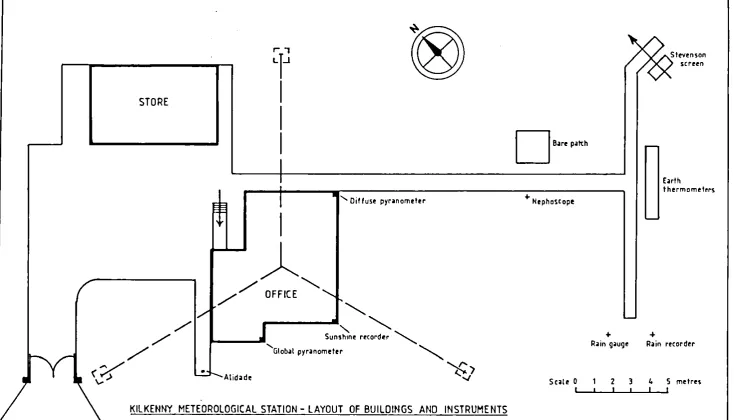
Figure 5 Layout of buildings and instruments
Figure 6 Exposure diagram showing Azimuth and Elevation of
all objects which obscure the pyranameters
together with Azimuth and Elevation of the sun at different times of the year
Solar Radiation Observations at Birr Meteorological Station
1. Introduction
2. Site of Observations
3. Measurement of Global Solar Radiation
4. Measurement of Diffuse Solar Radiation
Figure 7 ,,lop showing site
Figure 8 Layout of bUildings and instruments
Figure 9 Exposure diagram showing Azimuth and Elevation of
all objects which obscure the pyranometers
together with Azimuth and Elevation of the sun at different times of the year
Solar Radiation Observations at Dublin Airport
I. Introduction
2. Site of Observatians
3. Measurement of Global Solar Radiation
4. Measurement of Diffuse Solar Radiation
Figure 10 Map showing site
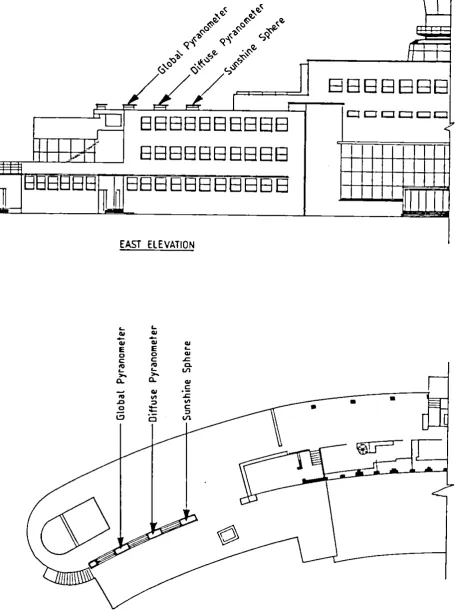
Figure II Layout of specific instruments on Terminal
BUilding
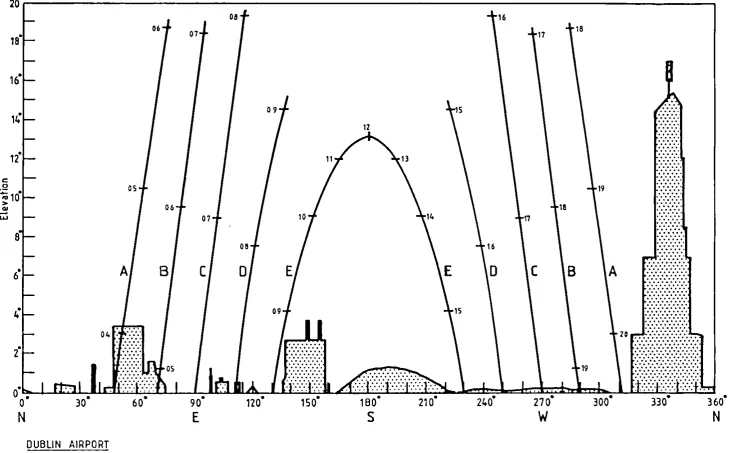
Figure 12 Exposure diagram showing Azimuth and Elevation of
all objects which obscure the pyranameters
together with Azimuth and Elevation of the sun at different times of the year
CON TEN T S (Contd).
Solar Radiation Observations at Molin Head Page
1. Introduction 24
2. Site of Observations 24
3. Measurement of Global Solar Radiation 24
4. Measurement of Diffuse Solar Radiation 24
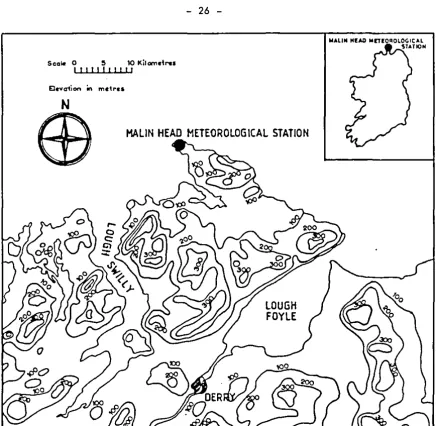
Figure 13 Map showing site 26
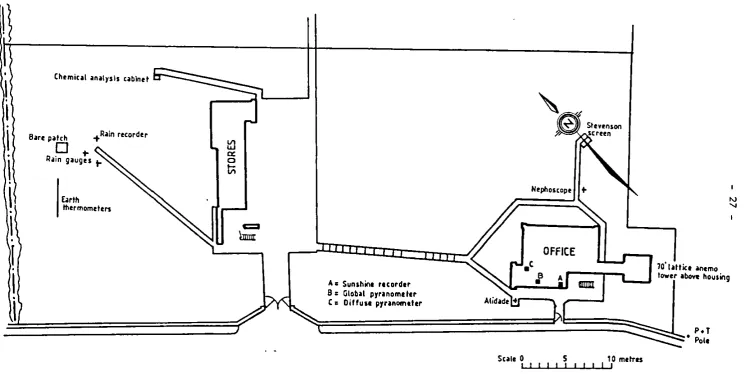
Figure 14 Layout of buildings and instruments 27
Figure 15 Exposure diagram showing Azimuth and Elevation of 28
all objects which obscure the pyranometers together with Azimuth and Elevation of the sun at different times of the year
Solar Radiation Observations at Clones
1. Introduction 29
2. Site of Observations 29
3. Measurement of Global Solar Radiation 29
4. Measurement of Diffuse Solar Radiation 29
Figure 16 ~bp showing site 31
Figure 17 Layout of buildings and instruments 32
Figure 18 Exposure diagram showing Azimuth and Elevation of 33
all objects which obscure the pyranometers together with Azimuth and Elevation of the sun at different times of the year.
Solar Radiation Observations at Belmullet
1. Introduction 34
2. Site of Observations 34
3. Measurement of Global Solar Radiation 34
Figure 19 Mop showing site 35
Figure 20 Layout of bUildings and instruments 36
Figure 21 Exposure diagram showing Azimuth and Elevation of 37
all objects which obscure the pyranometers together with Azimuth and Elevation of the sun at Different
times of the year
APPENDIX. Instruments used in 1981 38
Table 1 Doily Totals of Global Solar Radiation at Valentia 39
Table 2 Doily Totals of Diffuse Solar Radiation at Valentia 40
Table 3 Doily Totals of Radiation Balance at Valentia 41
Table 4 Instantaneous Values of Direct Solar Radiation at 42
Normal Incidences at Valentia
Table 5 Doily Totals of Direct Solar Radiation at Ncrmal 45
Incidence at Valentia
Table 6 Doily Totals of Long-wove (Infra-Red) Radiotion at Valentio 46
TobIe 7 Doily Totals of Global Solor Radiotion ot Kilkenny 47
Table 8 Doily Totals of Diffuse Solar Radiation at Kilkenny 48
Table 9 Doily Totals of Global Solar Radiation at Birr 49
Table 10 Doily Totals of Diffuse Solar Radiation at Birr 50
Table 11 Doily Totals of Global Solar Radiation at Dublin Airport 51
Table 12 Doily Totals of Diffuse Solar Radiation at Dublin Airport 52
Table 13 Doily Totals of Global Solar Radiation at Molin Head 53
Table 14 Doily Totals of Diffuse Solar Radiation at Molin Head 54
Table 15 Doily Totals of Global Solar Radiation at Clones 55
Belmullet
r----__.._
G 1977
Clones. D 1981
G 1981
Dubli
n
. • G 1971
BIrr
0 1979
Kilkenny. G 1969
01979
Scale
a
t=WII _ _ _ _ 50lOa
KilometresIRISH METEOROLOGICAL SERVICE
SUM MAR Y
This volume contains a brief description of the site, equipment and observing procedures in use at the seven stations in the Irish network of Solar Radiation measuring stations i.e. Valentia Observatory, Kilkenny, Birr,
Dublin Airport, Malin Head, Clones and Belmullet. The network diagram is an
the following page.
In previous years hourly values were published but as and from January 1976, only daily totals are published dport from the spot values of Direct Sun at Normal Incidence (Table 4).
The hourly values may be had on request from: The Director, Meteorological
Service, Glasnevin Hill, Dublin 9.
In compliance with a World Meteorological Organisation (WMO)
recommendation a new radiation scale has been adopted from 1st January 1981. This is the World Radiometric Reference 1981 (WRR 1981) and replaces the
International Pyrheliometer Scale, 1956 (IPS 1956) which has been in use for
all radiation data published to date by the Irish ~~teorological Service. The
WRR (1981) scale is 2.2 percent greater than the IPS (1956) scale.
Archived radiation data up to 31st December 1980 will not be increased
by the 2.2 percent. However, all radiation values in the following Tables are
I
-SOLAR RADIATION OBSERVATIONS AT VALENTIA OBSERVATORY
1981
I. Introduction
Solor Radiation observations were begun at Valentia Observatory in
September, 1954. At that time a Moll thermopile pyronometer and a recording
millivoltmeter were installed, and have, since then, provided a continouos
record of Global Solar Radiation. A Linke-Feussner thermoelectric
iron-clad Actinometer (Kipp and Zonen) was also brought into use at the some time and 0 schedule of routine observations on direct sunlight has been
maintained when weather conditions permitted. In 1962, a second Moll
thermopile pyronometer, fitted with shading ring, was installed to provide a record of Diffuse Solar Radiation.
Measurement of the Radiation Balance wi th a Funk type Net Pyrradiometer was introduced on a routine basis as from 1st January, 1971.
Measurements of the Direct Sun radiation, using on Eppley Normal Incidence Pyrheliometer, and of Infra-Red radiation, using on Eppley Precision Radiometer (Pyrgeometer), were introduced on a routine basis as and from 1st January 1979.
Data derived from these instruments and the results obtained from
the direct sunlight observations for the period 1954 - 1959 have been
published in [I]. The data for 1960 and subsequent years have been
published in annual volumes. This volume contains the data for 1981.
2. Site of the Observatory
The observator~ which is in the extreme south-west of Ireland, (Lat. 510 56' N; Long. 10 15'W), is situated on the south-east side of the narrow estuary of Valentia River, which runs from approximately north-east to south-west (Fig. I). It is about 1.2 Km to the south-west of the
town of Cahirciveen~ To the north. ocross the river estuary. is 0 range
of hills 120 to 360 m high. To the north-east, beyond the town of Cahirciveen, the estuary opens out considerably ond the terrain is generally on open
boggy basin with only a gentle gradient. To the south-east, however,
the ground rises rapidly again to a range of hills 270 to 360 m high, the
highest peak (Bentee 375 m) being only 1.5 Km from the Observatory. To
the south, the country opens out to a distance of nearly 8 Km from the Observatory, where the Kilkeaveragh range of hills runs east west, varying in height from 120 to 390 m. There is on opening to the sea to the
south-west between the mainland and Valentia Island. The hills on the
Island rise to a height of 270 m. North of the island there is another opening to the sea, and the circle of hills is completed by a range to the north-west, 120 to 270 m high, separated by a narrow gulley from the range to the northward.
3. Measurement of Global Solar Radiation
3.1 Exposure of the Pyronometer
The layout of the Observatory is shown in Fig. 2. The sensor is exposed on the roof of the Radiation House and the recording instruments ore instolled inside the house. The pyranometer is at a height of 4
metres above ground level and 20 metres above ~~an Sea Level. The nature
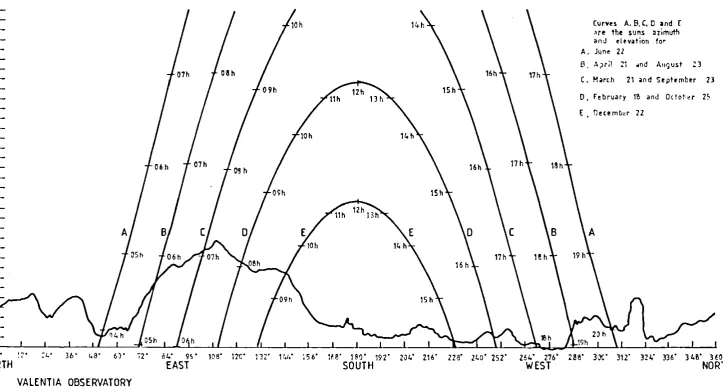
of the exposure can be seen in Fig. 3, in which the outline of all obscuring
objects is plotted on on Elevation-Azimuth diagram. Agart from one sector,
2
-on the Diffuse Rodiati-on is negligible.
In the sector 0800 ta 1500E from north, the elevation of the obscuring
objects lies between 80 and 10.50 approximately. The loss of Diffuse
Radiation according to Blackwell's formula [2] works out at approximately 1~. This is also very small, so no corrections have been made to the data to allow for this loss. The loss of radiation due to the obscuring of the direct solor beam occurs malnly 1n the some sector (0800 to 1500 ). During the period from the end of August to mid-April, the initial 30 to 70 minutes of the direct sun is cut off. This affects the hourly values given for the first and occasionally the second hour but the effect on the total for the day is negligible. No attempt has been made to correct the radiation data for this loss of direct sunlight •
. 3.2 Pyranometer Used
Details concerning the pyranometer and recording equipment are given in the Appendix.
3.3 Calibration of the Pyranometer
The pyranometer, recorder and integrator were calibrated by means of the Actinometer and Millivoltmeter, described in paragraphs 7.1 and 7.2
below. The calibration was done by comparing the intenSity of the direct
sunlight as measured by the pyranometer with the corresponding intensity as measured by means of the actinometer.
3.4 Timing Control
To facilitate accurate timing, time marks were made on the chart,
automatically, by standard clock, at each hour L.A.T. This clock, which
also controlled the print-out unit, was adjusted daily to keep it within
t
minute of true L.A.T.4. Measurement of Diffuse Solar Rodiation
4.1. Exposure of the Pyranometer
The Diffuse Pyranometer is mounted on the same site as the Global Pyranometer, at a distance of 3.1 metres west of the latter. A description of the site is given in 3.1 above.
4.2 Pyranometer Used
See Appendix
4.3 Colibration of the Pyranometer
The shading-ring was displaced below the horizontal position. The
pyranometer was then calibrated in exactly the some way as the Global
Pyranometer (para 3.3 above). The calibration was checked by comparing
-the values recorded during the hours when the sky was overcast with the corresponding values as recorded on the Global Pyranometer.
4.4 Shading-Ring Correction
3
-ring simultaneously with the eclipse of the sun's disc. corrections were computed following the method described
[2].
5. Measurement of Direct Sun Radiation
5.1 Exposure of the Pyrheliometer
Theoreti cal by Blackwell
The Direct Sun Pyrheliometer is mounted on the some site as the Global Pyranometer at a distonce of 2.4 metres north-west of the latter. A description of the site is given in 3.1 obove.
5.2 Pyrheliometer Used
See Appendi x
The Pyrheliometer is mounted on an Eppley Solar Tracker - a
power driven equatorial mount with provision for varying the elevation
and azimuth settings. The tracker settings ore adjusted as necessary
to keep the pyrheliometer directed ot the sun at all times.
5.3 Calibration of the Pyrheliometer
The pyrheliometerand integrator were colibrated by meons of the Actinometer and Millivoltmeter, as described in paragraphs 7.1 ond
7.2 below. The calibration was done by comparing the intensity of the
radiation as meosured by the pyrheliometer with the intensity measured by the actinometer.
6. Measurement af Infra-red Rodiation
6.1 Exposure of the Radiometer (Pyrgeometer)
The Infra-red Radiometer is maunted on the same site as the Global
Pyranometer at a distance of I metre south-west of the latter. A
description of the site is given in 3.1 above.
6.2 Radiometer Used
See Appendix
6.3 Calibration of the Radiometer
The radiometer was calibrated in a water-heated hemispherical cavity which provided a source of isotropic black-body radiatian. The radiation os meosured by the radiometer was compared with the radiation in the cavity as calculated from the Stefan-Boltzmann low.
7. Direct Sun Observations
7.1 A Linke-Feussner thermoelectric iron-clad actinometer (Serial
No. 93) by Kipp and Zonen, provided with red ond yellow
filters, was used for 011 instantaneous direct sun observations. Sangamo Weston Millivoltmeter No. 56501 was used.
The actinometer body consists of six massive copper rings, which ore made to serve as diaphragms. The openings of these diaphrcsms decrease progressively towards the thermopile, and the chambers formed between them are specially shaped so as to eliminate
turbulent air currents within the instrument. Felt lagging around
4
-The detachable filter head consists of a heovy copper core, which is screwed on to the exterior ring and carries a filter disc. Only a small segment of this disc protrudes from the head, so that the filters
are kept at actinometer temperature. The ~bll thermopile is divided into
two equal sections, connected in opposition cnd each conSisting of twenty constantin-monganin couples. One of the sections is screened from radiation and thus acts as a compensating device for the elimination of thermal effects associated with quasi-adiabatic pressure changes, occurring near the
thermopile surface.
A thermcmeter for reading the temperature of the instrument is set inside the copper parts.
7.1. 1. Fi Hers Used
7.2
Three filters of Schott glass OG
I
,
RG2, and RG8 received from the Radiation Commission of the nternationol Association af ~~teorology, were used for all the observations. These filters were tested at Davos Observatory and a certificate with the reduction foctor (DR) supplied.For Filter OG
1, DR
=
1. lOSFor Filter RG
2, DR 1.132
For Fil ter RGS' DR
=
1.050Co 1 i bro t i on of the Actinometer
In 1961, an Angstrom Compensating Pyrheliometer (No. 54S) was
received, with calibration dota, from Stockholm. This instrument is
reserved as I~tianal Reference Standard. Its calibration has been
maintained in agreement with IPS 1956 by participation in the W.M.O. Region VI Comparisons of National Standard Pyrheliometers held at Davos in 1964-,-in Corpentras, France, in 1969 and at Davos in October, 1975, and also by participation in a comparison organised by the E.E.C. in Corpentras in 1975.
The Actinometer and associated meter were calibrated by reference to the Pyrheliometer.
7.3 Observational Routine
All observations were made at a site about 6 metres south east of the Radiation House (Fig. 2) and at a height af 15.5 metres above M.S.L. Observations were mode three times dOily, when sky conditions permitted,
at approximately 1030, 1230 i.e. at approximately the average time of
local noon and at 1430 G.M.T. Each of the observations consisted af
a double series of measurements in the order:- Zero - RG
S Total -RG
5
-7.4 Computation of the Sun's Zenith Distance (Z)
The Sun's Zenith Distance for each time of observation was obtained from a special table prepared for Valentia, based on Tables 5, 6 and 11 as given in Linke's "Meteorologisches Taschenbuch" Vol.
IV (Leipzig, 1939 edition) and the "Alt Azimuth Tables for Latitude limits 300 to 640", prepared by P.L.H. Davis and published by H.M.
Stationery Office, London (1918 edition). The values are correct to
the nearest tenth of a degree.
7.5 Computation of the Optical Air ~bss (m)
The Relative Air I.bss (m ) was obtained from the Sun's Zenith
Distance (Z) by using Table
1~7,
page 422 of "Smithsonian MeteorologicolTables· (1951 edition). This table is based on Bemporad's
formula:-Atmospheric Refractian in Seconds
mh
=
58.36 Sin ZThe Optical Air I.bss (m) was computed from the
formula:-P h P _ the atmospheric
were - pressure in millibars
1000
8. Radiation Balance
Measurement of the radiation balance commenced on c routine basis in 1971. .
.
Details of the instruments used will be found in the Appendix .The exposure is over a lawn surface adjacent to the Radiation House on the roof of which the other radiation instruments or~ exposed.
The calibration is checked regularly be reference to the Angstrom Pyrheliometer.
References
[1] Solar Radiation Observations at Valentia Observatory, 1954-1959
(Meteorological Service, Department af Transport and Pawer, Dublin, 1961 )
[2] Five years Continuous Recording of Total and Diffuse Solar Radiation
at Kew Observatory - by M. J. Blackwell.
Scal.
9
W,
-
.
- 6
[image:11.598.73.510.200.536.2]- 7
-~=
-...
,
-....I...-L..:L...: ..
,
....
! " ~' ~ . . . . " .,
_~,-,-' -1"-"-,' ..
. '...
..
..
o..
•
~
•
•
.c o
•
~
..
CQ
....
~
..
o....
•
..
•
c~
,4 •
. ,.
"
lO'
28
26'
?l.0
/1'
1)'
.~
1"
~
~ ~6'
, 4'
12
DO
f
6'
Curvn A. S, C, 0 and r
,lre the suns :nimuth
and ~ltY;Jtion for A. June 21
8 A,Jr;t ::1 .nd August :3 C. Milrch 21 OInd Sephmber 21
0, February 1e Clnd Oclot'a 1~
E fJecembl;:r 22
::t
:t"~h
JOSh IlO~h.l
/,~
,~\,d.lIIb
/i19h \ , ,-.,.-,, .,.
:4' l6' 4a' 6)' ,2' 81.' 9" 108' l2e' 132" W; ;56' 118' HO' 192' 204' 216" 128' 140' 252' 264' 276' lee' 3Jt" 3,2' 324' 336' He' 3/0'
EAST SOUTH W EST NORTH
NORTH
VALENTIA OBSERVATORY
Fig. 3, Exposure diagram showing Azimuth and Elevation of all objects which obscure the pyranometer, together with Elevation and Azimuth of the sun at different times of the year.
[image:13.840.41.765.93.480.2]9
-SOLAR RAOIATION OBSERVATIONS AT KILKENNY METEOROLOGICAL STATION
1981
1. Introduction
Meosurements of Global Solar Radiation were begun at Kilkenny towards the end of 1968 while measurement of Diffuse Solar Radiation
commenced in May 1979. Data given in this volume represent the results
for 1981.
2. Site of the Observotions
The Meteorologicol Station is situated 2 Km north-west of the
centre of Kilkenny at Lotitude 520 40' N; Longitude 070 16' W.
Kilkenny is mainly 0 marketing town of populotion 10,000, in which
there ore no major industries or sources of otmospheric pollution.
The countryside immediately surrounding the station is flot open
grosslond. Low hills beyond this area are sufficiently distont to
avoid causing obstruction.
3. Measurement of Global Solar Radiation
3.1 Exposure of the Pyronometer
The global pyranometer is installed on a stand at the southern edge of the flot roof of the station bUilding 5 metres above ground
level (Fig. 5) and 67 metres above sea level.
The exposure is good, all effective obstruction being below 20
elevation except between 57° and 59° azimuth where on anemometer mast obstructs to 650 elevation (See Fig. 6)
3.2 Pyrcnometer Used
See Appendix
3.3 Observing Procedure
Time marking of the records and control of print-out is by means of on electric clock, reset each night to maintain timing
within
t
minute of time L.A.T. The method of tabulation of therecords is the same as that already described for Valentia Observatory.
3.4 Calibration of the Pyranometer
The instrument in use is similar to that in use at Valentia Observatory ond was calibroted, before installation, against the Volentia Stondord.
4. Meosurement of Diffuse Solar Radiation
4.1 Exposure of the Pyranometer
The diffuse pyronometer is mounted on the same site as the global pyranometer, at a distonce of 9 metres north-east of the
- 10
-4.2 Pyranometer Used
See Append i x
4.3 Calibration of the Pyranameter
The shading-ring was displaced below the horizontal position and the calibration was done in exactly the same way as for the Global
pyranometer. The calibration was checked by comparing the values
recorded during the hours when the sky was overcase with the corresponding values as recorded by the global pyranometer.
4.4 Shading-Ring Correction
Corrections have been made to increase the values extracted from the charts to compensate for the diffuse energy intercepted by the
ring simultaneously with the eclipse of the sun's disc. Theoretical
Fig. 4.
'00
~lHrs~6LOGIC"'L
SUflON
•
(J
Hap showing site 0
_ l~_
'00
I 'cal Station. f Kilk enny Meteoro ogl
[image:16.598.95.529.191.599.2]/
FIg. 5.
STORE
~e
I
I
I
I
I
I
~"
, / , / OFFICE
®
... Diffuse pyranometer
"'-/ "
r - - - -..
"
"-..
, / Sunshtne recorder " - . .
• Atidilde
KILKENNY METEOROLOGICAL STATION - LAYOUT OF BUILDINGS AND INSTRUMENTS
DB.,.P.lth
..
Nepho~cope'
-..
Rilin gaugl!!
r
'
-...
Stevenson screen
E~rth
thermomet!"rs
Rain recorder
Scate 0 2 3 4 5 metres
....
[image:17.841.37.772.91.511.2]2 0 · , - - - -_ _ _ _ _ _ _ _ _ _ _ _ _ _ _ _ _ _ _ _ _ _ _ _ _
--.
c
o
li
'z 0
~ 10
QI
W
i
06
05
A
B
04
07
08
09
06
07
08
(
o
09
o' :-,'
..
., ,,-::::: '::::
<q~: :~:
-:"""""',
~~...t:~,
'~" ,~"
::,:-:t,';':-o," ,r":, ,:: :,':::, ' , . . . ..
.
. . . .
. .
....
: : ,':-: :.;.: ... .o·
N
KilKENNY
30· 60· 90·
E
120· 150·
,',
180·
S
:.:
.
16
o
15
,6, Exposure diagram showing (1) azimuth and elevation of all objects whith obsture pyranometer,
17
18
16
18 19
17
(
B
A
20
270· 300·
W
- 14
-SOLAR RAOIATION OBSERVATIONS AT BIRR METEOROLOGICAL STATION
1981
1. Introduction
Measurements of Global Solar Radiation were begun at Birr towards the end of 1970, while measurements of Diffuse Solar Radiation commenced
in May 1979. Data given in this volume represent the results for the
year 1981.
2. Site of the Observations
The Meteorological Station is situated in flat pasture land
6 fairly well wooded, about
It
Km
east of the town of Birr at Latitude 53 05' N;Longitude 070 54' W. The surrounding country is gently undulating.
About 16
Km
to the east lie the Slieve Bloam mountains, the main axis af which runs north east - south west. The highest peak of this range is 518 metres. About 10Km
ta the north af the statian, there is an extensive area of bog (see Fig. 7).3. Measurement of Global Solar Radiation
3.1 Exposure of the Pyranometer
The global pyranometer is installed on a stand at the southern edge of the flat roof of the station building 5 metres above ground level (Fig. 8) and 75 metres above sea level.
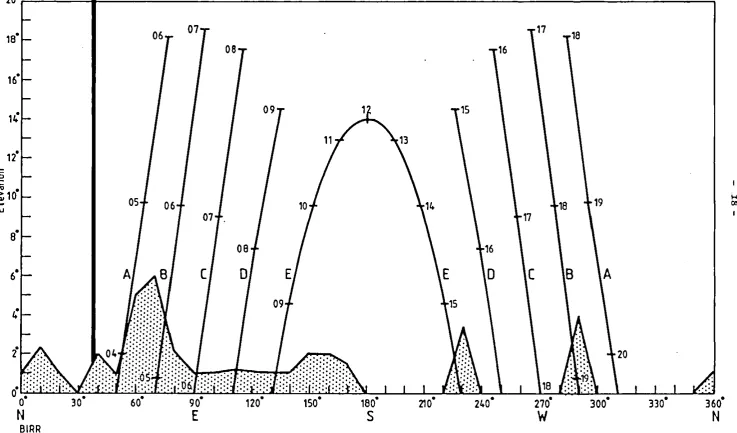
The exposure is generally good, all effective obstruction being below 20 elevation
6 except for a few isolated buildings which obstruct
the horizonobove 2 and between 370 and 390 azimuth where an anemometer mast obstructs to 640 elevation (See Fig. 9).
3.2 Pyranometer Used
See Appendix
3.3 Observing Procedure
Time marking of the records and control of print-out is by means of an electrical clock reset each night to maintain timing within
t
minute of true L.A.T. The method of tabulation of the records is the same as that already described for Valentia Observatory.3.4 Calibration of the Pyronometer
The instrument in use is similar to that in use at Valentia Observatory and was calibrated, before installation, against the Valentia Standard.
4. Measurement of Diffuse Solar Radiation
4.1 Exposure of the Pyranometer
- 15
-4.2 Pyranameter Used
See Appendix
4.3 Colibration of the Pyranometer
The shading-ring was displaced below the horizantal position and the calibration was done in exactly the Same way as for the
global pyrcnometer. The calibration wes checked by comparing the
values recorded during the hours when the sky was overcast with the corresponding values as recorded by the global pyranometer.
4.4 Shading-Ring Correction
Corrections have been made to increase the values extracted from the charts to compensate for the diffuse energy intercepted by the ring simultaneously with the eclipse of the sun's disc.
_ 16
-N
EB
Sule
r
~2
!.:
~
lli&oMwa0
00ELLVATION IN WORES
~
\
\
~IOb>1
, / PJriilnometer... / :
Sun.shine rKorder
STORE
Nephoscopl +
Clrth
thermomders
Daare
p~tch
R~in recorder +
BIRR METEOROLOGICAL STATION - LAYOUT OF BUILDINGS AND INSTRUMENTS
Fig.a.
-
----
...
-.
-
-
Sllven~on screen-,.
-:=:::::
!
-Sea I. ~L ... ....L....L...L...~l..1....L...L...L..J~ m. tr ..
•
....
...
64· II
•
2~r---~---.
B·
o· :-:
o·
N
BIRR05
60·
Fig. 9. Exposure diagram showing
06
06
07
07 .
(
90·
E
08
09
08
o
09
120· 150· 180·
S
15
210·
17
18 16
15
lB
1917
16
o
(B
A
20
240·
330·(1) azimuth and elevation of all objects which obscure pyranometer.
121 azimuth and elevation of sun at various times of year as follows (AI June 22 IBI April 21. August 23
(e
I March 21. September 23 101 February lB, October 25 (EI December 22360·
[image:23.840.40.778.65.498.2]19
-SOLAR RADIATION OBSERVATIONS AT DUBLIN AIRPORT
1981
1. Introduction
Measurements of Global Solar Radiation were begun at Dublin Airport in September, 1975 and of Diffuse Solar Radiation in ,,loy 1976. Data given in this volume represent the results for 1981.
2. Site af the Observations
Dublin Airport, Latitude 530 26'N, Longitude 060 14'W, is situated
an a low hill 8 Km north of Dublin City and 9 Km from the sea to the east
(Fig. 10). The surrounding country is flat, the nearest mountains lying
about 20
Km
to the south.3. Measurement of Global Solar Radiation
3.1 Exposure of the Pyranometer
The pyranometer is installed on the third storey balcony of the Terminal Building 13 metres above ground level and 82 metres above sea
level. (Fig. 11).
As the prevailing winds are westerly and the sources of pollution from the city lie to the south the site is relatively pollution free.
There is some obstruction from surrounding buildings (Fig. 12) but as the verticol component of radiation lost is less than O.5~ na attempt has been made to allow for it.
3.2 Pyranometer Used
See Appendix
3.3 Observing Procedure
Time marking of records and control of print-out is by means of an electric clock, which is maintained within
t
minute of L.A. T. The general procedure for maintaining the instruments and tabulating the records is the same as that already described for Valentia.3.4 Calibration of the Pyranometer
Tne instrument in use is similar to that in use at Valentia
Observatory and was calibrated, before installatian, ogainst the Valentia Standord.
4. Measurement of Diffuse Radiation
4. 1 Exposure of the Pyranometer
The diffuse pyranometer is mounted on the same site as the global pyranometer, at a distance of approximately 14 metres to the north of the latter. A description of the site is given in 2
above ..
4.2 Pyranometer Used
20
-4.3 Calibration of the Pyranometer
The shading-ring was displaced below the horizontal position and
the calibration was done in exactly the some way as for the global pyranometer. The calibration was checked by comparing the values recorded during the
hours when the sky was overcast with the corresponding values as recorded by the global pyranometer.
4.4 Shading-Ring Correction
Corrections have been mode to increase the values extracted from the charts to compensate for the diffuse energy intercepted by the ring
simultaneously with the eclipse of the sun's disc. Theoretical corrections
>00
D
- 21
-Dublin Airport. Meteorological Station
Scal~ 0 5 10 I(ilomef~ts
I I ! I I t ! I I ! !
[image:26.597.103.555.163.599.2]- 22_
oJ
q.~rr
~ q}
~q. <>~ ~q.
<> 'I' ~
'b'l' <'b c.,"i. «{ «->;
.~~e
~ q.
II I I
"",'b "," <$' (;),<> ~$> ",'I'
=
///?I
B888BBB
C! C! C! CJ CJCJ
~
BElElBElElBB8B
<III I
I L
....
f
8BB8BBBBBB
II I Y I
I'l
~
Jill
ICll:j8B88
m.
]
88El88ElBElBElEl
EAST ElEVATION
~ ~
..
..
- -
..
E.. ..
E ~0 0
...
c: c: .s::
'"
'"
c.~
,...
~,...
Vl0.. 0..
...
...
. s
'"
..
.s::•
•
.c ::I
..
.9 :t: c: ::I
'"
Ci VlTHIRD FLOOR PLAN
[image:27.597.90.546.94.711.2]20·r---~
08 06
07
12
05
06
07
8
08
A
B
(0
09
O.
...
o· •
o
30· 60· 90· 120· 150· 180·N
E
S
DUBLIN AIRPORT
16
17
18 7
16
0
(B
15
210· 240· 270·
W
18
19
A
19
[image:28.841.32.767.66.519.2]300·
...
...
...
...... ...
...
...
· ... .
...
·
... .
...
·
... .
...
...
...
...
...
...
...
. .
...
. .
.
. . .
.
.
...
20 .:::::::::::::::::::::::: •
fffrrf~I~
: ?::::.::::::?:::::: ...
330· 360·
N
Fig. 12. Expo.ure diagram .howing 111 azimuth and elevation of all objett. whith obscure pyranometer.
24
-SOLAR RADIATION OBSERVATIONS AT ~~LIN HEAD METEOROLOGICAL STATION
1981
1. Introduction
Measurements of Global and Diffuse Solar Radiation were begun at Molin
Head in June 1981. Data given in this volume represent the results
for June to December 1981.
2. Site of the Observations
The Meteorological Station is situated about 300 metres from the
shoreline on the northwestern headland of the Inishowen peninsula at Latitude 550 22'N; Longitude 070 20'W. The site is 2.5 Km southeast of the most
northerly point of Ireland. The countryside to the southeast. south and
southwest is mastly hilly. Open sea lies to the northwest. north and
northeast. The nearest major industrial centre is Derry City which is
40 Km to the south.
3. Measurement of Global Solar Radiation
3.1 Exposure of the Pyranometer
The global pyranometer is installed on the southern end of a concrete stand at the western side of the flat roof of the station building 4 metres above ground level (Fig 14) and 28 metres above sea level.
Some obstruction is caused by nearby buildings. poles and on anemometer lattice tower in the northeast to southeast sector end by
a hill in the sector southwest to northwest (Fig. 15).
3.2 Pyranometer Used
See Appendix.
3.3 Observing Procedure
Time marking of the records and control of printout is by means of on electronic clock. which' is maintained within
t
minute of L.A.T. The general procedure for maintaining the instruments and tabulatingthe records is the some as that already described for Valentia Observatory.
3.4 Calibration of the Pyranometer
The instrument in use is similar to that in use at Valentia Observatory and was calibrated. before installation. against the Valentia Standard.
4. ~~asurement of Diffuse Solar Radiation
4.1 Exposure of the Pyrcnometer
25
-4.2 Pyranameter Used
See Appendix.
4.3 Calibration of the Pyrcnometer
The pyranometer was calibrated against the Valentia Standard before
installation. The calibration was checked by displacing the shade ring
below the horizontal during periods of overcast or clear sky conditions
and co~paring the values recorded with the corresponding values as
recorded by the global pyranometer.
4.4 Shading-Ring Correction
Corrections hove been mode to increase the values extracted from the charts to compensate for the diffuse energy intercepted by the ring
simultaneously with the eclipse of the sun's disk. Theoretical
- - - _ . ---~
EleVa1ion in metres
N
EB
- 26
-MALIN HEAD METEOROLOGICAL STATION
[image:31.600.89.525.162.588.2]LOUGH FOYLE
I}
I
I
.
I
.
I
I
I
I
I
.
I
urth thermometers
A c Sunshine recorder 9:: Glob.J1 pJnnometcr
c:
Oiffull Plr1nomtterMALIN HEAD METEOROLOGICAL STATION - LAYOUT OF BUILDINGS AND INSTRUMENTS
Fig. 14.
Nfphoscope +
OFFICE
10'IJUk. ,1ncmo
r:;;-r'-...J
tower lbove housing ~--=~Uamm
SCilie 0 5 10 metres
[image:32.840.58.814.99.473.2]Lattice an •• a fa".,. IplaHa,.. 1161.2-1
20r---~·~~~---~---~
MALIN HEAD
Fig. IS. Exposure diagram showing
,.
360'
N
(11 azimuth and elevation of all objects which obscure pyranometer.
[image:33.840.53.790.57.504.2]29
-SOLAR RADIATION OBSERVATIONS AT CLONES METEOROLOGICAL STATION
1981
1. Introduction
~~asurements of Global and Diffuse Solar Radiation were begun
at Clones in June 1981. Data given in this volume represent the global
radiation results for the period June to December 1981. Due to instrument
malfunction ond other problems encountered in the recording of the diffuse data there are cansiderable breaks in continuity and these data are not published.
2. Site of the Observations
The Meteorological Station is situated an a hill about 1 Km to the north of the town of Clanes at Latitude 540 II'N; Longitude 070
14'W. The site overlooks the adjacent countryside but ot a distance af
10 Km from the station there are gently sloping hills in most sectors. (Fig. 16).
3. Measurement of Global Solar Radiation
-3.1 Exposure of the Pyranometer
The global pyranameter is mounted an a concrete pillar
2t
metres above ground level (Fig. 17) and 89 metres above sea level.The exposure is generally goad but a terrace of houses obstructs to between 70 and 90 elevation from aximuth 3100 to 0200• In addition an anemometer most and some poles obstruct to about 200 elevation
(Fig. 18).
3.2 Pyranometer Used
See Appendi x
3.3 Observing Procedure
Time marking of the records ond control of printout is by
means of on electronic clock, which is maintained within
t
minute ofL.A.T. The generol procedure for maintaining the instruments ond
tabulating the records is the some as that already described for Valentia Observatory.
3.4 Calibration of the Pyranometer
The instrument is use is similar to that in use at Valentia Observatory and was calibrated, before installation, against the Valentia Standard.
4. Measurement of Diffuse Solar Radiation
4.1 Exposure of the Pyranometer
The diffuse pyranometer is maunted on the some pillar as the global pyranometer at a distance of 1.2 metres north of the latter. A description of the site is given in Section 2
30 -4.2 Pyranometer Used
See Appendix.
4.3 Calibration of the Pyranometer
The pyranometer was calibrated against the Valentia Standard before instollation. The calibration was checked by displocing the shade ring below the horizontal during periods of overcast or cleor sky conditions and comparing the values recorded with the corresponding values as recorded by the global pyranometer.
4.4 Shading-Ring Corrections
Corrections have been made to increase the values extracted
from the charts to compensate for the diffuse energy intercepted by the ring simultaneously with the eclipse of the sun's disk.
- 31
-Scac 0 5 10 lI(~o~cr.
,",,11''''
EllVillion in ",.t, .. [image:36.596.94.527.183.617.2]d
'\
~
\
\
Chem}c:.1-\ Alida de .n.lysls 0
".~,.~
..
cabinet\ s(retn
O~FlCE
IOLDI-
_.
1-._-+I
+ ~
+f
-+
Nepho5cope Rain QIUIJU Ra\n recorder
/
/
,
+
Sunshme recor el'.
d Earth therometer'5I I
+ Sunshine recordtr stand loldl
DBart patch
+ flood-119M on Oiffu~e pyranomtter • 20 ft higtl standard Glot:a\ pyranomettr.
t
f
E5B poloCLONES HETEOROLOGICAL STATION - LAYOUT OF BUILDINGS AND INSTRUHHlTS
Fig. 17.
i-P. T pole
Scale 0
I 5 I
-OFFICE
10 metres
I I
CAR PARK
~
--I
w
[image:37.841.38.786.59.482.2]20r---~---r---,
CLONES
w w
Fig. lB. Exposure diagram showing (1) azimuth and elevation of aU objects which obscure pyranometer.
(2) azimuth and elevation 01 sun .t various times of year as follows (AI June 22 (0) April 21. August 23
[image:38.841.46.770.65.494.2]34
-SOLAR RADIATION OBSERVATIONS AT BELMULLET METEOROLOGICAL STATION
1981
1. Introduction
Measurements of Global Solar Radiation were begun at Belmullet
in 1977. Due to instrument malfunction and non-availability of
replacements there was a long break in continuity of the records. Measurements recommenced with the installation of new equipment in mid
1981 and data given in this volume represent the results for June to December 1981.
2. Site of the Observations
The Meteorological Station is situated on the northern edge of Blacksod Bay about
It
Km west af the town of Belmullet at Latitude 54014'N; Longitude 100 OO'W. The surrounding countryside is generally flat
but with some low hills in the distance.
3. Measurement of Global Solar Radiation
3.1 Exposure of the Pyranometer
The pyranometer is installed on a stand at the southern edge of the flat roof of the station building 4 metres above ground level
(Fig. 20) and 14 metres above sea level.
The exposure is good with practically all effective obstruction being below 20 elevation. Between 200 and 220 Azimuth an anemometer mast obstructs to 640 elevation (Fig. 21).
3.2 Pyronometer Used
See Appendix.
3.3 Observing Procedure
Time marking of the records and control of print-out is by means of an electronic clock, reset each night to maintain timing within
t
minute L.A.T. The method of tabulation of the records is the same as that already described for Valentia Observatory.3.4 Calibration of the Pyranometer
Sc.a.1c 0 5 10 I(ilomc(ru
11111111111
BELMULLET METEOROLOGICAL
35
[image:40.598.96.529.155.585.2]I
Fig. 20.
,
B aft patch
Nephoscope
+
Chemic~1
Inlll,515
cilbinet
o
STORE
I
[uth thermometers
D
+'--+----..d--:~h:±N9l::
..
~:-~s-!"-.n-so-n
.-,,-.. -n - - - - ,R illn giluge Rain recorder ~
+
Rain gauge
~A
cobin.!
SCilie 0
I 5 I
9
I
I
I
I
I
I
I
10 metres
I I
BELMULLET METEOROLOGICAL STATION - LAYOUT OF BUILDINGS AND INSTRUMENTS
w
[image:41.841.88.751.64.484.2]20'
06 la
Hi
07 1708 16
16'
14
12
1i
c:
0 01 19
~ 10·
>
..
'.,
06 18 W"
!oJ ~
:;; 07 17
B' •
"
08 16
6'
A
B
[0
0
[B
A
4
0' 20
i
0'0' 30' 60' 90' 120' 150' 180' 210' 270' 00' 330' 360'
N
E
S
W
N
BfLHULLET
fig, 21. Expowr e diagram showing (11 azimuth and elevation of all objects which obscure pyranometer.
APPENDIX TABLE OF INSTRUMENTS IN USE - 1981
Diffise Shade Ring
Sensar Recorder Integrator Wi
a
tfi
DiameterValentia
Global G2-847 No. 29 Llntranic 717A
Di ffuse G18-1387 No. 168 Lintronic 484B 48mm 308fTYT1
Balance Funk 695 Honeywell 68B/2124
Infra-Red Eppley 1715F3 Eppley 411-5879
Direct Sun Eppley 17247E6 Eppley 411-5880
Kilkenny
Glabal CM5-690224 XR4-550106 lintronic 415A
01 ffuse CM5-78514 BD8-77 4733 51mm 305fTYT1
Birr
Global CM5-690246 XR4-188730-13 CCI-680076
01 ffuse CM5-785160 BD8-785761 51mm 305fTYT1
Dublin Airport
Global CM5-773731 Philips 8053 CC2-750338 w CD
Di ff use CM5-752732 Philips 8056 CC2-750262 52mm 315mm
Molin Head
Global CM5-807223 BD8-806738 Eppley 411-7092
Di ffuse CM5-807230 BD8-806748 51mm 304mm
Clones
Global CM5-807237 BD8-806742 Eppley 411-7093
Di ffuse CM5-807231 BD8-806752 51mm 304mm
Belmullet
Global CM5-683279 XR4-188730-15 CCI-680082
[image:43.841.102.766.54.512.2]Table 1 VAlENTIA DAILY TafAIB OF Gr.onAL SOIAIl IlADIATla-I (J/cm2) 1981
Month Jan Feb Mar Apr May June July Aug Sept Oct Nov Dec
Day 1 217 92 160 ll67 693 1094 2107 2736 ll27 493 129 264
2 321 102 184 1351 2226 1278 2513 1583 ll86 569 239 264
3 101 276 605 1795 1287 ll85 1876 1449 ll50 428 148 102
4 246 216 396 ll85 1405 1929 893 2250 401 3ll 630 240
5 180 362 260 1288 778 1294 2472 1072 701 1081 289 78
6 133 200 506 607 592 1999 1533 997 1544 1163 290 280
7 160 201 343 1151 447 662 1548 2223 943 561 360 155
8 66 344 908 1733 1577 1067 2215 1605 1549 441 291 120
9 279 749 198 1062 1920 2467 2702 2001 905 821 290 202
10 331 731 262 707 251 1081 629 883 1376 518 170 168
11 297 274 679 280 1820 849 1005 1401 1364 450 249 266
12 226 151 836 1206 1687 1275 1286 466 1451 996 322 333
13 141 451 1064 754 1812 292 1700 692 933 962 223 87
14 47 276 1127 968 1840 291 596 1888 414 273 146 146
15 160 309 1224 1682 2240 2295 1503 2254 1021 1120 74 235
10 240 792 1242 866 1563 2358 2071 1995 432 1112 433 218
17 342 233 919 560 1012 1898 2299 1598 210 970 349 314
18 243 197 630 1972 1340 2617 1005 1370 1300 286 456 349
19 125 280 370 2201 1277 1976 819 959 218 ll6 202 35
20 74 921 902 2365 1575 2688 890 1337 1065 776 282 227
21 135 733 702 1704 1286 2922 694 483 1053 571 127 258
22 243 674 736 776 1089 2651 1962 1063 1451 572 48 344
23 275 934 907 881 1051 1855 1737 893 259 255 424 84
24 399 784 324 2245 2306 2298 1884 1968 1319 610 399 175
25 307 595 537 2507 1619 1540 526 1638 671 525 245 75
26 213 217 986 1967 2449 3158 1430 2118 509 298 65 82
27 296 318 293 2619 423 2109 2216 2031 1180 600 294 315
28 235 570 1158 671 2104 1152 774 800 1312 549 254 149
29 156 1362 1141 1989 1897 2750 695 450 269 71 393
30 190 870 1096 . 648 1315 2627 1496 813 154 108 286
31 240 1452 1762 2299 739 386 248
Totnl 6618 ll982 22142 40507 44668 51792 50561 44683 28307 18236 7607 6492
[image:44.845.39.806.66.531.2]Table 2 VALENTIA DAILY TarA IS OF DIFFUSE SOLAR RADIATION
Month Jan Feb Mar Apr May June July Aug
Day 1 177 91 159 802 687 877 1332 506
2 197 102 178 773 610 1157 1142 1123
3 99 252 328 685 989 1090 1450 839
4 195 198 380 819 1009 1181 801 082
5 179 238 253 571 665 1014 1283 912
6 131 196 461 576 586 1153 1129 910
7 159 194 337 991 435 643 1054 779
8 65 301 040 898 1005 895 967 903
9 165 213 197 841 821 1212 910 1032
10 150 200 259 609 249 9~~ 621 823
11 191 263 013 278 998 820 970 998
12 185 145 529 733 1340 1098 1009 465
13 140 377 557 648 1347 289 1207 662
14 44 264 589 662 858 287 590 1028
15 HiO 301 514 918 916 1372 1142 633
16 19·1 361 532 809 1117 1383 1142 !J74
17 218 220 566 520 1145 1491 982 800
18 197 197 001 653 1043 1141 931 914
19 124 277 304 571 1085 1113 811 857
20 73 347 612 403 1052 802 801 1102
21 133 324 504 922 1064 735 677 481
22 234 0125 602 732 989 1174 1115 901
23 257 308 o~~ ~~ 832 964 1610 1194 849
24 241 453 322 604 1030 1069 1209 640
25 285 525 508 529 1250 1234 521 976
20 212 216 820 033 007 758 1253 637
27 190 316 290 531 418 1544 1124 563
28 220 412 750 035 1280 1291 611 687
29 155 609 1010 1404 1211 631 631
30 182 784 992 037 1234 611 898
31 229 854 1275 1059 646
Total 5387 7725 15187 21330 29211 31869 30621 25007
Menn 173.7 275. {) <199.6 711.0 9·12.3 1002.3 987.8 806.7
2
(J/cm )
[image:45.843.46.819.57.525.2]•
Table 3 VAlENTIA DAILY TUfAlB OF RADIATICl'< nALANCE (J/cm2) 1981
-Month Jan Feb Mar Apr May June July Aug Sept Oct Nov Dec
Day 1 -88 8 93 555 327 530 1000 992 515 172 09 102
2 83 01 45 522 838 767 1295 760 538 35 100 -72
3 15 6 208 744 554 564 863 777 604 129 -89 44
4 -91 2 121 383 663 948 493 1065 236 131 -133 -61
5 -39 110 147 1112 354 521 1409 511 278 293 -102 -47
6 -34 33 241 144 281 1133 786 401 611 377 -2 -3
7 89 60 208 380 230 348 892 933 379 63 -27 -19
8 -23 183 465 632 675 536 1077 848 650 88 -70 -151
9 -126 128 136 479 780 1102 1239 938 453 274 62 -131
10 -219 37 156 317 79 422 353 , 474 567 65 30 -97
11 -57 26 349 165 904 460 566 777 482 19 99 -252
12 -101 5 304 517 768 685 704 273 563 192 27 -239
13 4 -81 518 391 769 180 831 409 362 179 38 -44
14 -30 7 523 426 825 147 306 1034 258 50 -20 -213
15 -34 -68 399 613 1122 1038 782 1058 486 75 -155 -98
16 - 19 226 404 412 725 1207 1149 944 198 -3 -37 -203
17 -146 -25 364 121 768 878 1217 869 15 20 50 -352
18 28 46 261 552 451 1328 511 729 439 105 -86 -371
19 2 45 81 723 613 909 474 514 -45 88 13 -55
20 53 140 406 784 794 1253 528 652 255 83 4 -107
21 83 219 305 704 642 1216 366 248 322 87 52 -15
22 87 157 184 341 532 1251 1125 517 461 70 9 -183
23 98 86 413 442 558 906 820 428 16 91 -44 -230
24 8 167 181 1019 1073 1198 914 895 446 155 -102 -101
25 43 310 188 979 790 737 318 801 126 84 37 -22
26 30 36 449 836 1109 1371 783 908 189 50 43 -107
27 -90 105 170 970 173 781 1181 681 358 64 -81 -133
28 -136 139 409 289 978 669 393 438 409 79 -111 -73
29 -61 368 600 984 1013 1167 410 204 -52 36 -221
30 36 259 584 337 702 1161 640 291 04 68 -55
31 -83 614 907 1015 270 32 -82
Total -718 2168 8969 16142 20603 24800 25718 21200 10660 3159 -322 -3591
[image:46.846.23.816.62.535.2]Table 4 Valentia
~
Q
·
Q E-o
·
~ <
·
o-l
i=
E'l~ ~
....
;:; E-o
I"eb
9 1336 10 1128 15 0948 21 1144 23 1036 23 1328
\pr
3 0852 3 1328 18 0904 19 0804 19 0912 19 1028 19 1304 19 1356 19 1520 20 0808 20 0832 20 1016 20 1312 24 1032 24 1508 25 0920 25 1112 25 1316
27 1248
.Jay
2 1240 2 1512 2 1556 26 1248 June
16 1300 18 1116 18 1324 18 1348 19 .J.356 20 0944 20 444 24 332 26 1224
'"
U ~ E-o'"
....
Q~ _N E:::~....
z'"
N 69.7 66.6 70.3 62.5 64.3 64.5 60.6 50.0 54.3 62.3 52.9 44.8 42.7 45.9 65.8 61.5 58.1 45.5 42.9 42.9 54.1 50.2 39.9 41.5 39.3 37.4 52.6 58.9 32.1 30.8 29.8 32.7 35.2 36.1 38.6 42.3 33.5 28.942
-DIRECT SOlAR RADIATIO~ AT NORMAL INCIDENCES
lliSTANTA.'IEOL'S VALUES (mW/em-) 1981
RADIATIO);
'"
§
'"
~ ~'"
S ...
'"
'"
~
8
c:: c::~ ~ :::>
'"
'"
N ~ 0:'"
E-oCJ1 0 0
§
<§
:i
c::'"
c:: (;i~ ~
S
~'"
0'"
'"
""
c::
:l
fJ
o-l Q'"
;:; <....
~'"
§:'"
>< U c:: c:: E-o
-1 -1 -1 X10⁻¹ 0
x10 x10 x10 mb C mb
2.86 737 506 546 417 1021 8.0 6.4 2.51 802 539 658 444 1031 8.0 7.2 2.95 758 525 637 432 1025 8.5 8.1 2.16 802 530 650 440 1008 9.4 7.2 2.30 712 511 607 429 1014 5.7 6.8 2.31 693 506 601 425 1015 5.8 6.6
2.03 698 460 568 380 1024 10.0 10.5 1.55 687 457 562 379 1024 12.5 12.6 1.71 811 549 666 454 1027 12.5 8.5 2.14 573 429 506 361 1028 10.0 10.0 1.65 666 475 570 397 1028 10.5 10.3 1.41 715 497 601 418 1028 11.8 10.5 1.36 724 496 602 419 1027 13.2 11.1 1.46 674 479 570 404 1027 13.2 11.1 2.43 654 470 ~51 392 1026 14.2 11.6 2.09 779 530 643 437 1032 7.5 7.0 1.89 790 531 648 439 1032 9.0 7.5 1.43 848 556 684 457 1033 11.0 7.7 1.36 832 544 676 448 1033 13.0 8.3 1.36 882 554 699 469 1009 8.1 5.4 1.70 825 560 680 454 1010 7.3 5.8
1~56 890 583 716 487 1018 7.1 4.9
1.30 923 595 738 489 1019 8.9 5.6 1.33 912 586 731 483 1019 9.4 5.1 1.29 897 568 705 470 1025 11.0 7.0
1.26 916 582 725 478 1021 10.0 7.6 1.64 866 558 693 456 1020 9.7 8.0 1.93 825 540 668 443 1020 9.7 8.0 1.18 833 534 667 439 1004 13.4 10.9
1.16 791 506 627 406 1028 13.8 10.2 1.15 882 542 691 445 1030 14.3 13.3 1;19 873 539 679 437 1029 14.5 13.1 1.22 842 524 655 432 1029 14.5 13.1 1.24 796 506 629 410 1025 15.2 15.6 1.28 850 526 663 425 1026 17.5 15.0 1.35 790 491 617 401 1026 17.4 15.5 1.20 882 547 688 444 1024 15.4 12.0 1.14 861 549 681 449 1020 15.3 10.9
CWUD
><
E-o
....
o-l
....
E-oc::
5
....
'"
'"
""
0....
>< ;:;<
> E-o
Km Okta
45 CUFe 1
50 CUFe 2
50 CUSe 2
25 CbSe 3
10 CUSe 1+
16 CU
1-30 Ac Tr
30 Fe Tr
25 Fc Tr
18 0
18 0
18
a
18 OlFeCi 3
18 FcCi 3
15 Ci 3
30 CUSe Tr
30 CU Tr
30 CU 1
30 CU Tr
50 CUCi 3+
50 CU 5
45 Fc Tr
60 CUFc 1
60 CUFe 1
60 CUCi 3
45 01 3
50 CUCi 3
50 CUCi 3
35 CU 4
-40 CUSeCi 4
50 CUAeCi 4
50 CUAe , 3·
50 CUAe 3
40 StOl 3
45 StCUSe 4
50 CUFe 4
45 CUSe 4
[image:47.597.25.555.83.826.2]•
Table 4 (Contd.)
>-..:
Q
.
f-o
~
..:.
...i
~ Eo!
0
~~
:; f-o
June
26 1320 26 1408 26 1448 26 1540 July
8 1448 9 1440 17 0848 29 0916 29 0956 29 ll08 29 1252 29 1400 29 1520 30 0848 30 0956 30 1056 30 1248 30 1412 30 1520 Aug
1 0908 1 1132 1 1352 4 1308 4 1408 14 1044 15 0932 15 1056 15 1320 15 1444 17 1248 26 0832 26 1004 26 1048 26 1116 26 1508 27 1108 27 1236 Sept
11 1512
til
u
z
..: ~
f-o a
til
...
~
Q~
~
:::t:.
:l!
f-o~
z :::
til
....
N ..:
32.4 1.18 37.6 1.26 43.0 1.37 50.5 1.57
43.7 1.38 42.7 1.36 48.0 1.49 46.1 1.44 41.2 1.33 34.8 1.22 34.8 1.22 40.7 1.32 51.1 1.59 50.1 1.56 41.4 1.33 35.8 1.23 34.8 1.22 42.3 1.35 51.4 1.60 .
47.8 1.49 34.4 1.21 40.6 1.32 37.3 1.26 42.9 1.36 40.6 1.32 48.1 1.50 40.1 1.31 41.2 1.33 50.1 1.56 39.8 1.30 59.0 1.94 47.7 1.48 44.0 1.39 42.5 1.36 56.3 1.80 43.3 1.37 42.6 1.36
61.8 2.11
- 43
-DIRECT SOIAR RADIATION AT N£RMAL INCIDENCES
INSTANT~~OUS VALUES (mW/em-) 1981
RADIATION til
5
~ til
....
til til8
5
til>-~ ~
g:
f-oC\I
...
'"
'"
!;:
....
0 0
§
o-l:::
§
::: gj5
....
~
...
...
til Cltil 0.. 0 ~
;j
B
Q til :;~ til
'"
'"
::: til....
u 0: >- ::: 0.. f-o ;> ;>
x10-1 x10-1 x10-1 x10⁻¹ mb
°c
mb Km855 546 679 444 1020 15.5 8.2 60 796 525 643 432 1020 16.1 1l.6 60 789 517 640 425 1020 16.0 12.2 60 745 499 613 411 1020 16.0 12.2 60
802 508 635 413 1014 14.6 14.6 30 826 529 656 433 1019 15.5 1l.3 45 775 497 618 411 1017 13.1 12.0 30 777 490 594 401 1022 16.1 13.2 30 804 507 637 411 1022 17.0 13.6 30 826 518 652 416 1022 17.8 14.1 30 816 509 643 410 1022 18.6 14.3 30 784 494 617 398 1022 18.8 15.6 30 742 471 586 381 1021 19.5 16.4 30 754 489 607 400 1022 17.2 17.0 18 773 501 619 405 1022 18.8 17.4 25 799 513 634 416 1021 19.5 16.6 25 770 496 617 405 1020 21.5 16.0 25 686 460 565 376 1020 20.6 17.5 25 633 431 526 354 1020 18.5 17.6 25
814 528 654 432 1018 14.8 10.9 40 852 546 852 441 1018 17.0 9.4 60 792 515 636 421 1018 18.5 13.3 60 874 538 677 435 1025 19.0 15.4 40 851 526 666 427 1025 18.8 16.2 40 867 524 670 418 1019 22.1 17.9 50 813 517 647 419 1021 17.0 13.6 50 802 520 642 420 1021 17.6 14.1 50 730 483 596 397 1021 17.1 13.7 70 709 475 582 385 1021 17.0 13.6 70 823 511 646 411 1026 18.6 17.9 50 781 495 624 396 1030 18.7 18.8 40 813 507 643 410 1030 19.2 19.4 50 842 518 659 416 1030 20.0 19.2 50 823 512 645 410 1030 20.0 19.2 50 660 441 547 373 1029 21.6 19.9 50 694 480 579 393 1023 23.3 18.1 18 685 473 571 390 1022 24.2 18.1 18
741 488 602 393 1003 14.6 10.7 30
CLOUD
~
til 0..~
>-f-o OktaCuSe Tr
CuSe Tr
Cu Tr
Cu Tr
Cu 3
CuCi 5
CuCbSC 4
CuSeCi 1+
CuSe 1
FeSe Tr
FeSe Tr
Fe Tr
Fe Tr
FeCi 1
CUCi Tr
CUCi 1+
CuFe 1
FeCi Tr
FeCi Tr
CUCi Tr
Ci Tr
0
CUCi 1
CUCi
1-CuSe 3
CuSeAe 2
CuFe 1
CU 1
CuFe 1
CUSe 4
FsSe 2
CuFe 3
CuFe 1
CuFe 1
CuFe 5
Fe Tr
Fe Tr
I I
[image:48.597.28.577.94.837.2]