Journal of Chemical and Pharmaceutical Research, 2013, 5(9):584-591
Research Article
CODEN(USA) : JCPRC5
ISSN : 0975-7384
Reliability analysis of switched ethernet based train communication network
Jieqiong Zhou
1, Lide Wang
1, Ping Shen
1and Liyuan Liu
21
School of Electrical Engineering, Beijing Jiaotong University, Beijing, China
2
Department of Electrical and Computer Engineering, University of Florida, Gainesville, Florida, USA
_____________________________________________________________________________________________
ABSTRACT
With the development of rail transit technology, more and more data are being transmitted in train communication networks, reflected both in the number of data types and in the amount of data. Traditional train communication networks do not have sufficient bandwidth. We propose a switched Ethernet solution based on virtual links. Using flow shaping and virtual link scheduling techniques ensures that no more than one frame is using the virtual link in each BAT interval, which leads to the determinacy of data transfer. To research the real time performance of this network, we have analyzed the in time reliability and the connectivity reliability of single virtual link scheme, multiple virtual links scheme, and all virtual links scheme in this model, using binary decision diagram, or BDD. We have also confirmed, through network simulation research, that such train communication network based on switched virtual link Ethernet posses high in time reliability and that it is a feasible Ethernet train communication network solution.
Key words: Virtual Link Switched Ethernet, Train Communication Network, In time Reliability, BDD Algorithm,
Network Simulation
_____________________________________________________________________________________________
INTRODUCTION
As rail transit becomes more convenient, comfortable and intelligent, trains become more and more complex. Meeting the challenge for safe and reliable and efficient operation, video surveillance systems are being deployed in train fault detection and diagnosis systems. Video stream transmission requires huge network bandwidth. In addition, with the development of technologies and increased user demands, more and more new subsystems are being added into trains. Thus more and more data are being transmitted in train communication networks, reflected both in the number of data types, including control commands, device statuses, video surveillance, and PIS audio/video streams, and in the amount of data. Common field bus networks, such as MVB, ARCNET, LonWorks and CAN, do not have sufficient bandwidth to meet the demand for real time high volume data transfer in trains. Therefore, Ethernet, which has a clear edge on network bandwidth, emerges as a candidate for better solutions of train networks.
______________________________________________________________________________
solution based on virtual links. Binary decision diagram (BDD) is adopted to analyze the in time reliability of the train communication network. Network simulations confirm that such train communication network based on virtual link based switched Ethernet posses is a real time and reliable Ethernet train communication network solution.
VIRTUAL LINK SWITCHED ETHERNET BASED TRAIN COMMUNICATION NETWORK Train Communication Network Scheme Based on Switched Ethernet
Ensuring determinacy and real time of the switch Ethernet based train communication network is the premise that it is used for real time information transmission and is basis for reliability analysis. Ways to improve real time performance of traditional Ethernet are divided into two kinds: One is trying to improve real time performance while preserving existing Ethernet protocols.
The second way easily leads to incompatibility with existing Ethernet equipment, increasing development costs substantially.
The first method is cheaper in costs and integrates better with management and information layers and benefits automatically from latest Ethernet technology advancement. The first method has several research hot pots, such as full-duplex switched Ethernet, priority techniques and IPv6.
Leveraging full-duplex switched Ethernet to improve real time performance, we propose a virtual link based switched Ethernet. Switched Ethernet divides network into micro-segments, freeing data input and output between ports from constraints of CSMA/CD, thus avoiding conflicts. Full-duplex communication makes possible that equipment behind different ports can transmit and receive data simultaneously. Full-duplex switched Ethernet avoids the conflict domain in traditional media-shared Ethernet leading to non-deterministic communication, laying the foundation for real time communication.
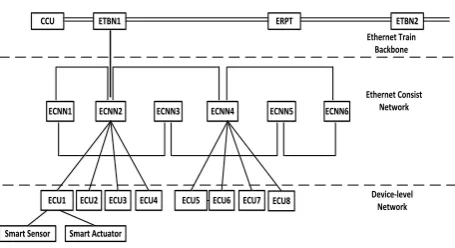
We have designed the switched Ethernet based train communication network, as is shown in Figure 1.
ETBN1
ETBN1 ERPTERPT ETBN2ETBN2
ECNN1
ECNN1 ECNN2ECNN2 ECNN3ECNN3 ECNN4ECNN4 ECNN5ECNN5 ECNN6ECNN6
ECU1
ECU1 ECU2ECU2 ECU3ECU3 ECU4ECU4
Ethernet Train Backbone
Ethernet Consist Network
Device-level Network
CCU
CCU
ECU5
ECU5 ECU6ECU6 ECU7ECU7 ECU8ECU8
Smart Sensor
[image:2.595.191.419.378.502.2]Smart Sensor Smart ActuatorSmart Actuator
Fig. 1: Switched Ethernet Based Train Communication Network
The whole network is divided into two tiers, train-level Ethernet Train Backbone network and vehicle-level Ethernet Consist Network. The ETB has on double Ethernet redundancy. An ETBN is a backbone switch node. One vehicle may have one or multiple train-level switch node. Ethernet relay ERPT may fit in appropriate places on the link. Central control units, or CCU, are placed in driver cabs at the ends. The ECN has a loop redundancy structure. ECNNx is a switch node on ECN. One ECN may encompass multiple vehicles. The device-level network mainly consists of electronic control units (ECU), such as traction control units, brake control units and door control units, and smart sensors and smart actuators connected to them. Device-level and ECN have a cascaded start topology. We choose the nodes and links in Figure 1 as our research network objects. We analyze its real time performance, thus trying to validate rationality of this topology and feasibility of such scheme.
The Design of Virtual Link Based Switched Ethernet
On the basis of train communication networks in Figure 1, this section details the design and implementation of virtual links. The design of controllers, including CCU and ECU, is the core, with protocol stacks responsible for complex functions, such as virtual link management, redundancy network control and flow shaping. The network protocol stack consists of a physical and logic-link layer based on IEEE 802.3, a network layer based on IP protocol, and a transmission layer based on UDP, which has good real time performance. Communications within controllers and between them and switches are realized in virtual links.
Each VL is logically separated from others. Each VL has its reserved bandwidth, as determined by the system administrator, and is independent from others within its effective bandwidth. Every controller exchanges Ethernet frames through a VL, as is shown is Figure 2.
Transport Layer
Network Layer
Data Link and Mac
Layer VL1
UDP port UDP port UDP port UDP port
VL2 VL3 VL4
[image:3.595.198.416.117.234.2]Controller1 Controller2
Fig.2: VL Based Communication Model
In the output of controllers, the speed and volume of flow in a specific VL can be programmed and controlled, realizing flow shaping. The speed and volume of VL flows correlate with bandwidth allocation gap, or BAG, jitter and the maximum length of one frame Lmax. The BAG is defined as the minimum time interval between the first bits of two consecutive frames in VL, varying from 1 to 128ms. Lmax is between 64 to 1518 bytes, and may jitter if multiple VLs exist.
Frame BAG
Frame BAG
Frame BAG MAX JITTER MAX JITTER MAX JITTER
0<Jitter<Max Jitter=0 Jitter=Max
Fig. 3: Flow shaping diagram
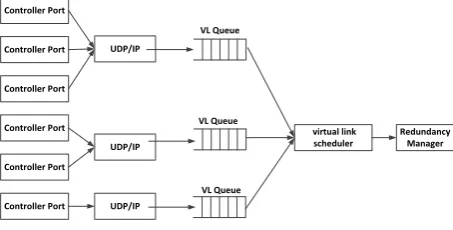
[image:3.595.196.420.334.395.2]Flow shaping and virtual link scheduling are mechanisms that ensure real time data transmission. Flow shaping is to allocate communication resources, such as available bandwidth, BAG and Lmax, between virtual links based on multiple factor, such as demand, fairness, and economics. The procedure is shown is Figure 3. With virtual link scheduling techniques, Ethernet frames are sent to physical links in order and real time. The procedure is shown is Figure 4. Each controller port is connected to a VL. Information that needs to be transmitted in trains is sent to the VL queue in the switch via the source controller port. The virtual link scheduler in the terminal controller schedules all the transmissions of VL. Within a VL, algorithms such as FIFO, PQ, and WFQ can be applied to do data management.
UDP/IP
virtual link scheduler
Redundancy Manager VL Queue
Controller Port
UDP/IP
UDP/IP Controller Port
Controller Port
Controller Port
Controller Port
Controller Port
VL Queue
VL Queue
Fig. 4: Virtual Link Scheduling Technique
Using flow shaping and virtual link scheduling techniques ensures that no more than one frame is transmitting within each BAG interval, which ensures real time and deterministic data communications and is the basis of the reliability discussions in the paper.
[image:3.595.192.419.527.642.2]______________________________________________________________________________
Research on network reliability includes three aspects, connectivity reliability, volume reliability and performance reliability. In recent years, scholars are paying attention to business reliability. Defined as the capability to do correct and real-time transmission according to predefined performance characteristics under certain conditions and within certain time limits, performance reliability is used to characterize the influence of congestion and interference on network service during information transmission. It is mostly measured as the probability that certain performance parameters, such as throughput, packet loss rate, and delay, remain within the threshold. No clear standard on reliability research on Ethernet train network has been established. We started the reliability research with reference to Ethernet based aerial electronic networks, facing complete and new reliability evaluation parameters in switched Ethernet based aerial electronic networks, including data integrity reliability, in time reliability, order reliability and correctness reliability. Since real-time is the basis for reliable switched Ethernet train communication networks operation, we focus on the in time reliability in performance reliability.
The in time reliability as discussed in the paper is defined as the capability that data be received at the receiving end in time after the data passes VLSTCN under certain condition and within certain time limits. The measurable parameters for in time reliability is the degree of in time reliability RT, which is defined as the probability that service data transmission delay is less than the deadline of the task under certain conditions and within certain time limits. In simulations and measurement activities, delay range can be determined based on practical requirements. Together with certain reliability algorithm we can get the corresponding degree of in time reliability.
According to the investigation perimeter of virtual links, the degree of in time reliability, or DITR, can apply to a single VL, k specified VLs, and all VLs. The DITR of a single VL is defined as the probability that data transmission delay between the source port and the destination port of a single VL in a VLSTCN does not exceed the threshold. The k specified DITR is defined the probability that the maximum data transmission delay between the source port and the destination port of k specified VLs within a VLSTCN does not exceed the threshold. The all DITR is defined the probability that the maximum data transmission delay between the source port and the destination port of all VLs within a VLSTCN does not exceed the threshold.
The reliability analysis of the paper is based on two criteria: 1) All nodes in the network are fully reliable; and 2) Links in the network may either be Normal or Faulty.
Delay Model of TCN
Any network can be abstracted as a probability graph G(V, E) consisting of a group of nodes V={V1,V2…Vn} and a group of links E={E1,E2…En}. The train communication network in Figure 1 can be represented as the probability diagram shown in Figure 5. To be able to describe more conveniently while preserving generality, only node ECU8 in Figure 1 is selected in the device-level network, which is also node V7 in Figure 5. Nodes V1 to V6 are vehicle-level switch nodes in the corresponding network. V0 reflects characteristics of both CCU and ETB1.
V0
V1 V2 V4
V3
V5 V6
V7
e1
e2 e3 e7
e4 e
5
e6
[image:4.595.226.385.501.597.2]e8
Fig. 5: Probability Graph G of the TCN in This Paper
A task in train communication networks is represented, in a four-element way, as t[S, T, P, D]. S represents the source node of the task; T stands for the destination node of the task; P denotes the period of the task; and D is the deadline of the task. To simply expression, the delay variable of a unit is denoted by the symbol of the node or link. The delay of a virtual link is represented by the delay variable of the link.
A network is abstracted and divided into a group of network units by deterministic network calculation theory. The upper bound of end-to-end delay is the sum of upper bounds of network unit delays on a transmission path. Assume that the minimum path set of routes of task t[S,T,P,D] from the source node to the destination node is
Rk | 1 k m
. Among them, the node set and link set are represented as
Nk i, | 1 i nk
and
Lk j, | 1 j lk
, respectively. Thus the delay of task t on pathR
k is calculated using, ,
1 1
k k
n l
k k i k j
i j
D N L
(1)Therefore for the task t shown in Figure 5 from node V0 to node V7, the delay is D7 V0 e1V1 e3V2 e8 V7
on its routeV0 e1 V1 e3 V2 e8 V7.
For communication task t, we define as the weight function of task path delay
D
k
1,0,
k k
k
D
D
F D
D
D
(2)
A successful transmission of communication task in train communication networks requires that at least one path can be used to transmit while satisfying message deadline requirements. Of course, the link be in Normal state is a necessary condition. Thus the DITR in a task-oriented train communication network can be represented as
,
1 1
Re ( ) ( ) k ( )
l m
T k r k j
k j
R l G F D P L
(3)where ,
1
(
)
k
l
r k j
j
P L
is the probability that the link is normal. Equation (3) represents the DITR under the condition of good connectivity.In-time Reliability of A Single VL Based on BDD
BDD, being a directed acyclic graph, is an efficient way to represent and manipulate Boolean functions. Any Boolean function f can be represented as a BDD using Shannon expansion theorem. As most reliability analysis functions are Boolean functions, BDD becomes a basic approach to do reliability analysis. The Shannon expansion
theorem isf x f x1 x f x0
0 1
X1
0 1
X2
X3
0 1
X1
X2
X3
( 1,2,3)
i
x i
x2 x3 x1 x2 x3
[image:5.595.195.421.462.547.2]Fig. 6: BDD Representation and Construction of A Boolean Function
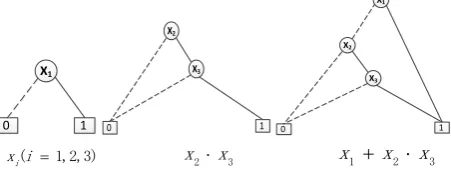
Figure 6 shows the BDD representation and its construction process of Boolean function f=X1+X2*X3. The middle node has two directed edges pointing to bottom nodes. The solid edges point to the bottom structure when the node is 1, which is the right child node. The dashed edges point to the bottom structure when the node is 0, which is the left child node.
The computation of network reliability follows two steps: 1) Construct the BDD structure of the network; 2) Get the reliability of the resulted BDD structure by applying Shannon expansion to each variable and doing recursive solutions.
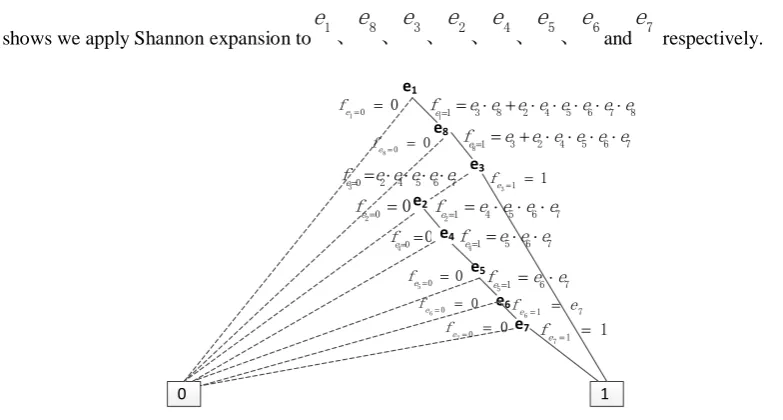
The in-time and not-in-time states of a link in the network can be mapped to 1 and 0 states in Boolean functions. We recursively construct the BDD representation by applying Shannon expansion to every variable in the minimum path set Boolean function in order. The process is shown is Figure 7. The minimum path set Boolean function as discussed in the paper for the train communication network, the probability graph of which is Figure 5, is
1 3 8 1 2 4 5 6 7 8
______________________________________________________________________________
Figure 7 shows we apply Shannon expansion to 1
e
、
e
8、e
3、e
2、e
4、e
5、e
6and 7e
respectively. e1 e8 e3 e2 e4 e5 e6 e7 0 111 3 8 2 4 5 6 7 8
e
f e e e e e e e e
81 3 2 4 5 6 7
e
f e e e e e e
30 2 4 5 6 7
e
f e e e e e
21 4 5 6 7
e
f e e e e
41 5 6 7
e
f e e e
51 6 7
e
f e e
6 1 7
e
f e
7 1 1
e
f
7 0 0
e
f
6 0 0
e
f
5 0 0
e
f
40 0
e
f
31 1
e
f
8 0
0
e
f
10 0
e
f
20 0
e f
Fig.7: BDD Representation After Applying Shannon Expansion to Minimum Path Set Boolean Function of Graph G
We use the constructed network BDD representation to recursively solve DITR of each single link, which is
Re ( ) Re ( ( )) T
R l G l BDD G . Its recursive form is
1
0
0,
Re ( ( )) Pr( 1) * Re ( ( ) | )
Pr( 0) * Re ( ( ) | ),
task
x
x task
D D
l BDD G x l BDD G
x l BDD G D D
(5)
where: Dtask>D represents the delay of task exceeds the deadline, while Dtask≤D represents the delay of task does not exceed the deadline. BDD(G) stands for BDD representation of network G; BDD(G)|x=1 denotes the right child node of node x; BDD(G)|x=0 means the left child node of node x; Pr(x=1) is the probability that link x is normal; and Pr(x=0) is the probability the link x fails.
In-time Reliability of Multiple VLs
Assume there’re m VLs in the network. When m=1, the approach discussed in Section 3.1 can be applied to measure DITR of this single VL.
Assume one transmit port in the ith VL corresponds to t receiving ports. Now that
R
Ti
R
T1t, the data reliability of a single VL is1 1 1 1 1
1 1
/ 1 /
t t
t i i i i
T T NT
i i
R N tN N tN
(6)
where:
N
T1i is the number of data packets in a single VL whose transmission delay from the source port to thedestination port i is less than given deadline;
N
1i is the number of data packets in a single VL whose transmission delay from the source port to the destination port i is larger than given deadline; andN
1i is the number of all data packets from source port to the destination port on this single VL. SoN
1i
N
T1i
N
NT1i and the numbers of data packets from the source port to all destination ports on a single VL are the same.When m=k, the data reliability of k specified VLs is given as
TK 1
=
/
k Ti iR
R
k
Tn 1
=
/
n Ti i
R
R
n
(8)Values of parameters in DITR can be retrieved by comparing data transmission in simulations or measurement networks and give deadlines.
RELIABILTY SIMULATION AND VALIDATION OF VIRTUAL LINK SWITCHED ETHERNET BASED TRAIN COMMUNICATION NETWORK
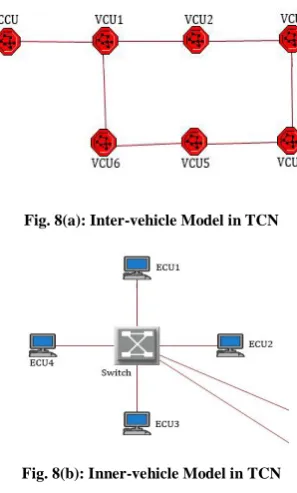
[image:7.595.230.379.233.480.2]To validate the reliability of VLSTCN, we set up a switched Ethernet train communication network model, shown in Figure 8, using the OPNET Modeler simulation platform. Each VCU (vehicle control unit) in Figure 8(a) consists of a switch and a group of ECU (electric control unit) connected to it, which is shown in Figure 8(b). In the simulation, CCU in Figure 8(a) is set as the source node, and the ECU4 inVCU2 is set as the destination node.
Fig. 8(a): Inter-vehicle Model in TCN
Fig. 8(b): Inner-vehicle Model in TCN
Fig. 8: Train Communication Network (TCN) Model
Two scenes are realized in OPNET simulations, simulating two scenarios: One is network 1 where the link between VCU1 and VCU2 is Normal; the other one is network 2 where the link connecting VCU1 and VCU2 is Faulty. The delays in these two scenarios from source node to destination node are shown in Figure 9.
Fig. 9: Delays When the Link is Normal (lower graph) and Faulty (upper graph)
[image:7.595.227.384.238.318.2] [image:7.595.199.416.549.701.2]______________________________________________________________________________
between VCU1 and VCU2 is 95% and 90%, respectively. The probability that other links are normal is 98%. Based on BDD algorithm, we get the reliability shown in Table 1.
Tab. 1: Reliabilities under different network conditions
Net T Src node Dst node Prob. Link between VCU1 and VCU2 is normal reliability Net.1 T1 Server in Subnet 1 Device 4 in Subnet 3 95% 0.95578628 Net.2 T2 Server in subnet 1 Device 4 in Subnet 3 90% 0.9547521
From the above experiment results, we can conclude:
(1)The upper bound of delay in the TCN discussed in this paper is 0.25ms, and the minimum feature cycle time of MVB is 1ms, thus the TCN discussed here satisfies requirements of real time performance.
(2)When the normal probabilities of core link, which is the link between VCU1 and VCU2, is 95% or 90%, the reliability of the network is guaranteed, through redundancy mechanisms, to be 0.95578628 and 0.9547521. Thus we conclude that the DITR of designed train communication networks is sufficiently good.
CONCLUSION
Adopting Ethernet as a train communication network is a recent research hot pot. The main focus has been on solving the non-determinacy and improving real-time performance. We design a highly redundant train communication network based on Virtual Link Switched Ethernet. By using flow shaping and VL scheduling techniques we can guarantee the determinacy of the network. Simulations confirm that the upper bound of delay in the network is 0.25ms, which satisfies requirements of train communications. Meanwhile, we have computed the reliability of train communication network set up in the simulation, using BDD algorithms, and the results show that DITR of the network can be as high as 0.9547521 when the probability that the core link be normal is just 90%, confirming that the Virtual Link Switched Ethernet Based Train Communication Network is a highly in-time reliable network.
REFERENCES