Journal of Chemical and Pharmaceutical Research, 2013, 5(9):314-323
Research Article
CODEN(USA) : JCPRC5
ISSN : 0975-7384
Use of response surface methodology to optimal-parameters adjustmentfor
CNC machine tool by corner speed control
Shao-Hsien Chen
1, Wern-Dare Jehng
1and Yen-Sheng Chen
21
Department of Mechanical Engineering, National Chin-Yi University of Technology
2
Department of Automation, Lan Yang Institute of Technology
_____________________________________________________________________________________________
ABSTRACT
This paper mainly focuses on investigating the parameter adjustment of corner acceleration and deceleration speed, which mainly affects machining accuracy and efficiency, for CNC machine tool, coordinated with Regression Analysis Method and Taguchi Analysis Method to conduct the optimal design and prediction of the controller parameters. The equipment used in this study is FANUC high-end controller, its data acquisition software is servo guide. This study conducted analysis and adjustment for servo parameters of feed shaft on CNC accuracy machinery in three phases. In the first phase, Regression Analysis Method was adopted to conduct parameter screening from captured data; in the second phase, Regression Analysis Method and Taguchi Analysis Method were adopted to conduct the works of parameter optimization; and in the third phase, used both methods to carry out circular measurements and the planning and selection of important parameter data. In this study, Regression Analysis Method was used to predict the experimental data analysis, semi-normal probability chart, Plato and analysis of variance (ANOVA) were used to understand significant factors of parameters and effects of interactions, then calculated best value based on response surface chart and contour chart, and adopted Taguchi Analysis Method to conduct analysis, comparison and verification. The experimental result proved that the experiment after changed can improve experiment with verification, so the problem in parameter screening of Taguchi Analysis Method can be voided. This study adopted Experimental of Design (DOE) to carry out processing accuracy and processing efficiency.
Keywords: CNC controller; parameter adjustment; design of experiment
_____________________________________________________________________________________________
INTRODUCTION
Along with the advance of technology age, machine tools have become very important in automated production. The volume processing and manufacturing capacities as well as high-accuracy processing are unattainable by human. Machine tools are very popularly used in domestic and foreign factories, however, in the adjustment of controller parameters, usually only the Try Error Method is adopted to repeatedly adjust controller parameters, and no further way to break through. Therefore, the adjustment of controller parameters is a very important issue in factories using machine tools. Moreover, the controller is the core component of a machine tool, parts and components can not have high-accuracy if the parameters of controller have not been approximately adjusted and calibrated, so the controller in a machine tool really plays a very important role.
ahead of the pack among these four well-known brands, and it enjoys a very high utilization rate in domestic machine tool factories. In a study of using the features of 18i-MB controller to do parameter adjustment, it revealed that the functionality of FANUC 18i-MB controller can also achieve high-speed and high-accuracy processing [7].
2. Parameters affecting trajectory accuracy:
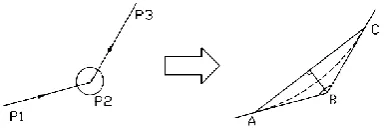
Reasons for errors generated while a CNC machine tool is accelerating and decelerating in the corner are many. As shown in Figure 1, while moving along two axes, P1, P2, and P3 are movement paths, corner error would be generated in the path of movement, the generated corner error started from point A to point B and C, and forms a triangle, this ABC contains all the errors, the error relationship (ε) between paths in ABC can be obtained from formula 2-17, while (εmax ) is the maximum value of the corner error.
max
2 2 cos sin
[image:2.595.213.407.309.377.2](1)
Figure 1.Schematic diagram of corner error
Use calculated corner error of automatic corner deceleration at corner speed and angle of cutting tool, feed rate automatically covers corners at both ends, as shown in Figure 2, there are four types of interior angles, including linear and circular movements between straight-line movements (tangent line of straight-line movement and circular movement between angles), and circular movement (between tangent lines of angle and circular movement). when identified as the inside part of the corner, set ratio for feed rate at between within the range of from the intersection point of the corner to Le of previous program segment and within the range of from the intersection point of the corner to Ls of next program segment, distances Le, Ls represent the straight-line distances between the points on center path of the cutting tool to the intersection point of the corner.
Figure 2. Schematic diagram of interior angle error
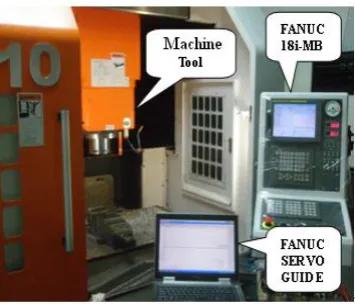
4.Laboratory equipment and experimental design: 4.1 Laboratory equipment
[image:2.595.200.417.525.640.2]Figure. 4 The actual experimental machine: the H10 high-speed machine tool
4.2Experimental design
In the first phase of the main course in this study, conducted the process of high frequency filtering, mainly to reduce the effect of high frequency response on machine accuracy; the second phase is experimental parameters screening and analysis, main purpose is to analyze effect proportions of CNC controller parameters for corner acceleration and deceleration on accuracy; the third phase is testing and analysis, mainly to conduct optimization experiment for parameters with larger effect proportions, and compare and discuss the experimental result with the result of Taguchi Analysis Method.
In the experiment, planed experimental parameters for corner acceleration and deceleration measurements, mainly referenced recommended values provided by controller manufacturer, and conducted parameter screening experiment. The main parameters are listed in Table 2, including acceleration / deceleration time constant after cutting feed interpolation (1768), speed gain (2021), feed-forward coefficient (2092), and fine finishing acceleration / deceleration time constant (2109). Adjusted the parameter values affecting one fourth of corner acceleration and deceleration to perform one fourth corner acceleration and deceleration measurements, its moving direction is clockwise rotation, feed rate is 2000m/min, a rectangle with side length 20mm, and arc angle R5. After executed the measurement program, the result showed that all the vibrations generated while in high-speed cutting are very obvious on the convexes and overcuts of one fourth corner acceleration and deceleration, and all of these convexes and overcuts would have a very big effect on surface roughness and contour of workpieces while in high-speed cutting.
Table2.Parameter addresses affecting circular measurements
A. Analysis of Variance (ANOVA)
The analysis method, used to simultaneously test whether the means of k populations are equal under the same significance level α, is called Analysis of Variance (ANOVA). Table 1 is the analysis of variance table [15]. ANOVA steps:
B. Test coefficient R2
Model appropriateness can be determined by the determinant coefficient R2, and is defined as:
2 R
T
SS R
SS
(2)
R
i=1 j=1
(4)
SST=SSR+SSE
E
SS
is Residual Sun of Sequare, also called variance within population:i n k
2
E i j
i=1 j=1
SS =
[ (y -y...) ](5)
R2 value is the ratio used to describe the variance between populations to experimental total variance value, i.e., the ratio can be described for total variance value of experimental data.
C. F-value or t-value test:
If want to detect whether the regression coefficient of an experimental factor is significant, can use F-value or t-value to perform statistical detection. MSEis sum of residual squares, while
MS
R is sum of average squares.R
E
MS F=
MS (6)
2
t =F
RESULTS AND DISCUSSION
5.1 Frequency response measurement
Through the frequency response measurement, can know the resonance point of various machine tool shafts, and then set filter parameters to suppress the vibration in high frequency areas; pass the set filter parameter values to motor of machine tool, and re-measure frequency response to achieve the waveform of suppressed vibration, by doing so the vibration of the machine can be effectively suppressed while in high-speed processing.
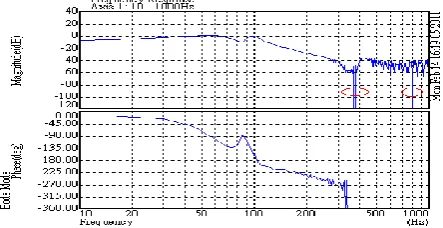
5.1.1 Before filtering adjustment
[image:4.595.194.416.614.728.2]In the X-axis frequency response measurements before filtering adjustment, its Gain values will fall to -339.5db, 342.9db at the frequency of 375Hz, 750Hz, as shown in Figure 4. The reason of the falling of Gain values may be caused by that machine is transmitting oil or the fan of main shaft motor is running. Therefore, from the measurement of Bode diagram, it can be seen that there will be an instability phenomenon. As shown in Figure 5, can switch the time domain in the Torque Command relative frequency chart to show the feedback input waveforms and corresponding frequencies of Bode diagram.
Figure 5 X-axis Torque Command relative frequency chart before filtering adjustment
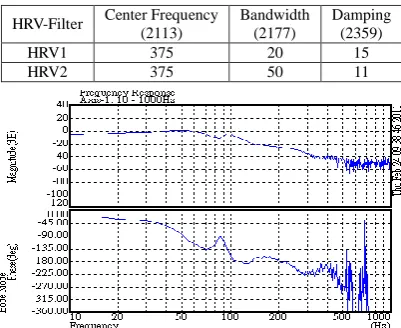
5.1.2 High frequency filtering to suppress vibration
Utilized vibration damping function, and performed adjustment through using HRV1 filter frequency center parameter (2113), bandwidth parameter (2177), damping coefficient parameter (2359) and HRV2 (2360), (2361), (2362) as listed in Table 2 [14]. As shown in Figure 6, contrast to the case of before filtering adjustment in Figure 7, the frequency response Bode diagram after filtering adjustment did not show obvious lowered Gain values, demonstrating that the filtering adjustment made by us is effective for improving the vibration of machine tools.
Table 2 Filter adjustment
HRV-Filter Center Frequency (2113) Bandwidth (2177) Damping (2359)
HRV1 375 20 15
HRV2 375 50 11
Figure 6 X-axis frequency response measurements after filtering adjustment
’
Figure 7 X-axis Torque Command relative frequency chart after filtering adjustment
5.2 Measurement of corner acceleration and deceleration 5.2.1 Experimental parameters screening analysis
[image:5.595.201.408.504.605.2]Figure Error in Experiment 1 (Error=0.635μm) Figure Error in Experiment 5 (Error=0.676μm)
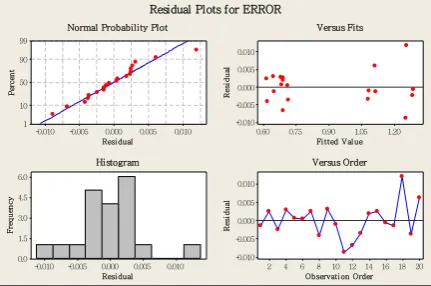
As shown in Figure 8, from the first-order regression model Pareto Chart, the situation of main utility or interaction of control parameter can be understood, its representative factors 1768, 2021 and 2092 have a significant effect, and as shown in the figure, parameter 1768 has biggest effect on the accuracy of corner acceleration and deceleration, then the experimental parameter is A2B2C1. Then carried out residual analysis on constructed regression model to verify whether this regression model is appropriate; from the residual analysis test in Figure 10, it can be viewed that there is no any graphical variation violated the hypothesis, indicating that this configuration mode meets the hypothesis. Distinguished whether the stable point is the easiest method for using maximum value, minimum value to determine the steep descending (ascending) direction, used the completed fitted model to plot contour chart and response surface diagram and find out the best points, then this is the best combination to make errors optimized, as shown in Figure 11.
D C AB B A
200 150
100 50
0
T
er
m
Standardized Effect 2.2
A 1768 B 2021 C 2092 D 2109 Factor Name
[image:6.595.132.496.87.404.2]Pareto Chart of the Standardized Effects (response is ERROR, Alpha = .05)
[image:6.595.200.413.557.696.2]24 16 1.20 1.05 0.90 0.75 0.60 400 300 9950 9850 1.20 1.05 0.90 0.75 0.60 24 8 1768 M ea n 2021 2092 2109
M ain Effects Plot for ERROR
Data Means
Figure 9 Main effect analysis diagram
5.2.2 Regression analysis optimization experiment:
Combination of all first-order level factors can fit first-order regression model as follows:
A
B
C
D
y
0 1 2 3 4 (7)A = feed interpolation acceleration / deceleration time constant (1768), B = speed gain (2021), C = feed-forward coefficient (2092), D = fine finishing acceleration / deceleration time constant (2109), conducted first-order mode and Lack-of-Fit test:
H0:y01A2B3C4D5E
(8)
H1:y 0 1A 2B 3C 4D 5E
(9)
When using first-order model fitness test, the parameters are A, B, C and D, the P value of this model in Lack-of-Fit test is 0.004, less than α = 0.05, experimental parameter design needs to be adjusted, from discriminant 10 it can be learned that the first-order Lack-of-Fit test is H1, therefore this system is a non-linear regression model, the appropriateness of the model can be determined from determinant coefficient R2 and is 0.9908, the more it is closer to 1, the smaller its error is.
(10)
When using second-order model fitness test, the parameters are A, B, C and D full mode and interactive, the P value of this model in Lack-of-Fit test is 0.551, larger than α = 0.05, is do not reject null hypothesis, from discriminant 11 it can be learned that the first-order Lack-of-Fit test is H1, the appropriateness of the model can be determined from determinant coefficient R2 and is 0.99.
(11)
Therefore, used second-order model fitness test, the parameters are A, B, C and AB interactive mode, the P value of this model in Lack-of-Fit test is 0.76, larger than α = 0.05, is do not reject null hypothesis, from discriminant 12 it can be learned that the first-order Lack-of-Fit test is H1, the appropriateness of the model can be determined from determinant coefficient R2 and is 0.99.
(12)
Optimized parameters used in second-order model and after conducted experiment obtained the regression equation:
y=3.257+0.0173A-0.00152B-3.129e-04C+0.000136AB (13)
(53.19)
81 . 52 000021 . 0 001109 . 0 3 , 11 , 05 . 0 F F
(0.96)
952 . 0 000021 . 0 00002 . 0 3 , 5 , 05 . 0 F F
(0.39)
3846 . 0 000039 . 0 000015 . 0 11 , 3 , 05 . 0 F
0.010 0.005 0.000 -0.005 -0.010 10 1 Resi dual P 1.20 1.05 0.90 0.75 0.60 -0.005 -0.010
Fi tted Val ue
R 0.010 0.005 0.000 -0.005 -0.010 6.0 4.5 3.0 1.5 0.0 Resi dual F re q u en cy 20 18 16 14 12 10 8 6 4 2 0.010 0.005 0.000 -0.005 -0.010
Observati on Order
R e si d u al
[image:8.595.198.414.109.252.2]Histogram Versus Order
Figure 10 Circular residual analysis chart
2021 1 7 6 8 400 380 360 340 320 300 24 23 22 21 20 19 18 17 16 2092 9850 2109 8 Hold Values > – – – – – < 0.7 0.7 0.8 0.8 0.9 0.9 1.0 1.0 1.1 1.1 1.2 1.2 ERROR
Contour Plot of ERROR vs 1768, 2021
Figure 11 Circular contour chart
5.2.3 Taguchi Method experimental analysis:
In the third phase, mainly used the regression equation to screen and analyze experimental parameters, and selected important parameters to optimize the design and testing. This experimental test belongs to static S\N ratio of Smaller the Better, five second level control factors can coordinate with L 12 right angle table to conduct analysis, calculated and correspondingly analyzed the output data in accordance with S\N ratio, as shown in figure, its optimized parameters are A2B2C1, as can be learned from table, the parameter 1768 has biggest effect on corner accuracy error, and regression analysis method used the same parameters, its optimized parameters were equally adjusted with regression equation.
Response Table for Means
Level A(1768) B(2021) C(2092) 1 0.6647 0.8689 0.9440 2 1.1869 0.9827 0.9076 Delta 0.522 0.1138 0.0365
Rank 1 2 2
5.2.4Experimental verification:
Accuracy of original parameters
Accuracy after adjusted parameters
CONCLUSION
The following conclusions can be drawn from this study:
1. This study mainly adopted regression equation to conduct the work of parameter screening, avoided the use of the rule of thumb for parameter screening. Through regression analysis, it is learned that the feed interpolation and acceleration / deceleration time constant, the speed gain, and the feed-forward coefficient have bigger effect on corner accuracy error.
2. With respect to the optimization of parameter adjustments, compared regression analysis with Taguchi Method, and through experimental verification method, it can be learned that the error before adjustment is 1.31 μm, and the accuracy after adjustment is 0.606 μm, while the optimized parameters derived form Regression Analysis Method are the same as those from Taguchi Analysis Method.
3. While cutting, the greater the feed interpolation acceleration / deceleration time constant, speed gain, and feed-forward coefficient, the smaller the error of relative cusp, but likely to cause a resonance problem.
REFERENCES
[1]Schulz,H., and Scherer J.,“High-speed Milling,” Industry and Production Engineering, (1989) [2]Schulz,H.,Annals of the CIRP, Vol.4, (1992)
[3]D.Renton, M.A. Elbestawi, International Journal of Machine Tools & Manufacture 40, p539-559.(2000) [4]Y. Koren, Journal of Engineering for Industry, Transactions of the ASME 101,326–332.(1979)
[5]G.-C. Han, D.-I. Kim, H.-G. Kim, K. Nam, B.-K. Choi and S.-K. Kim, “A high speed machining algorithm for CNC machine tools,” Industrial Electronics Society, 1999. IECON ’99 Proceedings. The 25th Annual Conference of
the IEEE, Vol. 3, pp. 1493-1497, San Jose, CA, USA, 1999.
[6]Dong-II Kim, “Study on Interpolation Algorithms of CNC Machine Tools”, Industry Applications Conference,IEEE,p.1930-1937, 1995.
[7]KO MING-SHENG ,the FANUC controller vibrates suppresses the parameter adjustment, Mechanical industry magazine, Vol. 275, 2006.6
[8]Precision Machinery Research Development Center,CNC control system adjustment application introduction,Vol.135,2005.6.
[9]Precision Machinery Research Development Center,CNC control system adjustment application introduction,Vol.147,2006.6.
[10]FANUC Servo Adjustment training material,B-10085/09
[17]Huang, S. and Chen, C., Int J. Mach Tools Manufact, Vol.35, No.4, pp.577-591, 1995.
[18]P.V.S Suresh,P.VenkateswaraRao,S.G.deshmukh, International Journal of Machine tools &Manufacture VOL. 42 PP. 675-680, 2002.
[19]DelCastillo, E., Journal of Quality Technology, Vol. 28, No. 1, pp. 61-70, 1996.
[20]DelCastillo, E., Montgomery, D. C. and McCarville, D. R., Journal of Quality Technology, Vol. 28, No. 3, pp. 337-345, 1996.
[21]Biles, W. E., and Swain, J. J., Industrial and Engineering Chemistry, Vol. 13, No. 3, pp. 134-155, 2000. [22].J.A. Ghani,I.A. Choudhury,H.H. Hassan, Journal of Materials Processing Technology,Vol.145,pp.84-92,2004. [23]Y.S. Hwang,R.S. Lin,”The Research on Acceleration/Deceleration Algorithm for CNC Motion Control”,The Department of Mechanical Engineering at the National Chung Cheng University, master's thesis,1999.