ISSN 1450-216X Vol.26 No.4 (2009), pp.611-619 © EuroJournals Publishing, Inc. 2009
http://www.eurojournals.com/ejsr.htm
The Implementation of Taguchi Method on EDM Process of
Tungsten Carbide
Mohd Amri Lajis
Faculty of Mechanical and Manufacturing Engineering, UTHM, Malaysia
E-mail: [email protected]
H.C.D. Mohd Radzi
Department of Manufacturing and Material Engineering, IIUM, Malaysia
A.K.M. Nurul Amin
Department of Manufacturing and Material Engineering, IIUM, Malaysia
Abstract
In this paper, the cutting of Tungsten Carbide ceramic using electro-discharge machining (EDM) with a graphite electrode by using Taguchi methodology has been reported. The Taguchi method is used to formulate the experimental layout, to analyse the effect of each parameter on the machining characteristics, and to predict the optimal choice for each EDM parameter such as peak current, voltage, pulse duration and interval time. It is found that these parameters have a significant influence on machining characteristic such as metal removal rate (MRR), electrode wear rate (EWR) and surface roughness (SR). The analysis of the Taguchi method reveals that, in general the peak current significantly affects the EWR and SR, while, the pulse duration mainly affects the MRR. Experimental results are provided to verify this approach.
Keywords: EDM, Taguchi method, Tungsten Carbide, metal removal rate, electrode wear
rate, surface roughness
1. Introduction
study of these parameters has been performed by many researchers, most of the studies do not much consider both engineering phylosophy (DOE) and mathematical formulation (ANOVA)[3, 4], particularly in machining very hard materials such as Tungsten Carbide. Therefore, the Taguchi method[3, 4, 5], which is a powerful tool for parametric design of performance characteristics, is used to determine the optimal machining parameters for minimum electrode wear ratio, maximum material removal rate and minimum surface roughness in the EDM operations. The experimental details when using the Taguchi method are described.
2. Experimental Process
Tungsten carbide alloy was the target material used in this investigation. Table 1 shows the material
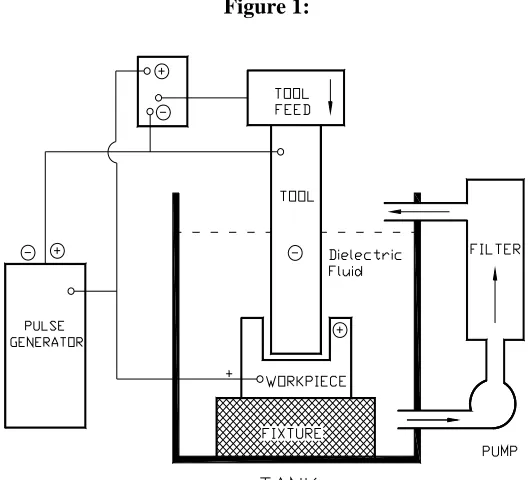
related properties. Experiments were performed using a Charmilles Electrical Discharge Machine, Series-Roboform. Figure 1 depicts schematically the experimental set-up. A cylinder of pure graphite
[image:2.612.166.432.278.518.2]with a diameter of 9 mm was used as an electrode to erode a workpiece of tungsten carbide. Kerosene was used as the dielectric fluid in this experiment.
[image:2.612.56.548.575.707.2]Figure 1:
Table 1: Material properties of Tungsten Carbide
Properties Value
Transverse rupture strength(Mpa) 550
Young’s Modulus(Gpa) 620
Vicker’s hardness(Gpa) 22
Shear Modulus(Gpa) 262
Poisson’s Ratio 0.18
Density(g/cm2) 15.8
Electrical resistivity(x 10-6 Ohmcm) 17
Specific heat(J/molK) 39.8
Melting point(ºC) 2870
Thermal conductivity(W/mK) 63
(Source: Fan Steel VR/Wesson – Hydro carbide)
average amount of material removed and the required cutting time. Next, the SR of the tungsten carbide was measured by a Taylor Hobson Surface Roughness Tester, series-Talysurf. The cut-off length for each measurement was 0.8 mm. The Ra values were measured three times on each specimen and then, the surface roughness values were averaged. Machining experiments for determining the optimal machining parameters were carried out by setting negative polarity of discharge voltage in the range of 120-200 V, the discharge current in the range of 8.0–64.0 A, the pulse duration in the range of 1.6-50 µs, and the interval time in the range of 3.2-800 µs. Essential parameters of the experiment are given in
Table 2.
Table 2: Electrical discharge machining condition
Work Condition Description
Electrode Graphite, diameter 9 mm, Length 70 mm
Workpiece Tungsten Carbide ceramic, square shape(100x100x7mm) Voltage -120 to -200 v
Peak current 8 to 64 A Pulse duration 1.6 to 50 μs Interval time 3.2 to 800 Dielectric Fluid Kerosene Technology used Blank/user tech
3. Design of Experiments and Data Analysis
3.1. Design of Experiments
[image:3.612.66.569.515.606.2]The experimental layout for the machining parameters using the L9 orthogonal array was used in this study. This array consists of four control parameters and three level, as shown in table 3. In the taguchi method, most all of the observed values are calculated based on ‘the higher the better’ and ‘the smaller the better’. Thus in this study, the observed values of MRR, EWR and SR were set to maximum, minimum and minimum respectively. Each experimental trial was performed with three simple replications at each set value. Next, the optimisation of the observed values was determined by comparing the standard analysis and analysis of variance(ANOVA) which was based on the taguchi method.
Table 3: Design scheme of experiment of Parameters and levels
Control Parameters
Level
Observed Values 1 2 3
Minimum Intermediate Maximum
Machining voltage, V(volt) -120 -160 -200 1.Material Removal Rate(cm3/min)
Peak Current, P(ampere) 8 32 64 2.Electrode Wear Rate(%) Pulse Duration, A (µs) 1.6 12.8 50 3.Surface Roughness(Ra) Interval Time, B (µs) 3.2 50 800
3.2. Analysis of Variance(ANOVA)
Analysis of variance(ANOVA) and the F test(standard analysis) are used to analyse the experimental data as follows [2, 3, 4]:
CF = T2/n (1)
ST = ∑i=1to 27 Yi2 - CF (2)
Sz = (Yz12/Nz1 + Yz22/Nz2 + Yz32/Nz3) - CF (3)
fz = (number of levels of parameter z) - 1 (4)
fT = (total number of results) - 1 (5)
Vz = Sz/fz (7)
Se = ST - ∑Sz (8)
Ve = Se/fe (9)
Fz = Vz/Ve (10)
Sz’ = Sz - (Ve * fz) (11)
Pz = Sz’/ ST * 100% (12)
Pe = (1 - ∑ Pz) * 100% (13)
Where;
CF correction factor
T total of all results
n total number of experiments
ST total sum of squares to total variation
Yi value of results of each experiment (i= 1 to 27) Sz sum of squares due to parameter z(z= V, P, A and B) Nz1, Nz2, Nz3 repeating number of each level(1, 2, 3) of parameter z Yz1, Yz2, Yz3 value of results of each level(1, 2, 3) of parameter z fz degree of freedom(DOF) of parameter z
fT total degree of freedom
fe degree of freedom(DOF) of error term
Vz variance of parameter z
Se sum of squares of error term
Ve variance of error term
Fz, F ratios of parameter z
Sz’ pure sum of square
Pz percentage contribution of parameter z Pe percentage contribution of error term
3.3. Data Analysis
In this study, all the analysis based on the taguchi method is done by Taguchi DOE software(Qualitek-4) to determine the main effects of the process parameters, to perform the analysis of variance(ANOVA) and to establish the optimum conditions. The main effects analysis is used to study the trend of the effects of each of the factors, as shown in figures 2, 3 and 4. The machining performance(ANOVA-significant factor) for each experiment of the L9 can be calculated by taking the observed values of the EWR as an example from table 4. Table 5 lists the ANOVA and F test results for EWR. F0.05;n1,n2 is quoted from “Stastitical Tables” [7]. If the calculated Fz values exceed F0.05;n1,n2
Table 4: L9 table and Observed values
No.of Trial
Control Parameter (level) Result/Observed Value
V P A B
EWR MRR SR
(%) (cm3/min) X 10^-3 (Ra)
1 2 3 1 2 3 1 2 3
1 -120(1) 8(1) 1.6(1) 3.2(1) 37.00 37.76 37.40 1.07 1.05 1.03 2.18 2.38 2.25 2 -120(1) 32(2) 12.8(2) 50(2) 17.20 17.95 17.58 3.79 3.83 3.75 3.06 3.02 3.05 3 -120(1) 64(3) 50(3) 800(3) 8.72 8.36 8.54 4.21 4.19 4.26 3.64 3.31 3.38 4 -160(2) 8(1) 12.8(2) 800(3) 28.40 30.90 29.60 0.19 0.23 0.21 2.71 2.97 2.63 5 -160(2) 32(2) 50(3) 3.2(1) 21.28 21.20 21.16 5.23 5.25 5.33 4.40 4.17 4.07 6 -160(2) 64(3) 1.6(1) 50(2) 10.93 11.10 10.83 1.25 1.23 1.30 2.98 2.12 2.89 7 -200(3) 8(1) 50(3) 50(2) 40.93 43.67 42.30 1.89 1.92 1.88 2.56 2.68 2.47 8 -200(3) 32(2) 1.6(1) 800(3) 7.40 7.60 7.50 0.19 0.23 0.21 5.03 5.42 5.27 9 -200(3) 64(3) 12.8(2) 3.2(1) 24.10 22.40 23.24 3.13 3.25 3.10 3.54 3.68 3.58
Table 5: Analysis of variance and F test for EWR
Parameter
(z) DOF (fz)
Sum of Square (Sz)
Variance
(Vz) F-ratio (Fz) F0.05;n1,n2
Pure Sum
(Sz’) Percent (Pz)
V 2 73.487 36.743 73.256 * 3.55 72.483 1.940 P 2 2,806.092 1,403.046 2,797.268** 3.55 2,805.089 75.085
A 2 159.688 79.844 159.186 * 3.55 158.685 4.247 B 2 687.577 343.788 685.415 * 3.55 686.574 18.377
e 18 9.028 0.501 0.351
** Significant Parameter; * subsignificant parameter
Table 6: Analysis of variance and F test for MRR
Parameter
(z) DOF (Fz)
Sum of Square (Sz)
Variance
(Vz) F-ratio (Fz) F0.05;n1,n2
Pure Sum
(Sz’) Percent (Pz)
V 2 7.314 3.657 2,201.500 * 3.55 7.310 9.024 P 2 22.612 11.306 6,806.095 * 3.55 22.608 27.907
A 2 39.337 19.668 11,840.221** 3.55 39.334 48.551
B 2 11.721 5.860 3,528.034 * 3.55 11.718 14.464
e 18 0.028 0.001 0.054
** Significant Parameter; * subsignificant parameter
Table 7: Analysis of variance and F test for SR
Parameter
(z) DOF (fz)
Sum of Square (Sz)
Variance
(Vz) F-ratio (Fz) F0.05;n1,n2
Pure Sum
(Sz’) Percent (Pz)
V 2 3.647 1.823 43.234 * 3.55 3.562 16.255 P 2 12.019 6.009 142.486 ** 3.55 11.935 54.456 A 2 0.414 0.207 4.907 * 3.55 0.329 1.504
B 2 5.077 2.538 60.188 * 3.55 4.993 22.780
e 18 0.758 0.042 3.55
** Significant Parameter; * subsignificant parameter
Table 8: Summarization of significant parameters on the machinablity of EDM
EWR MRR SR
V * * *
P ** * **
A * ** *
B * * *
4. Results and Discussion
The following discussion focuses on the effects of process parameters to the observed values(EWR, MRR and SR) based on the Taguchi methodology.
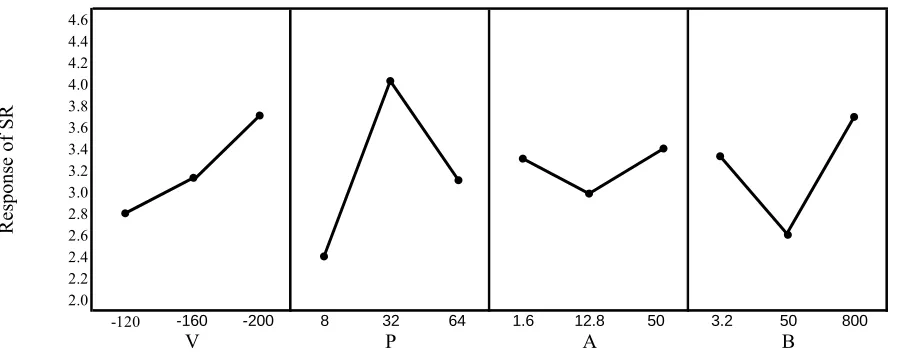
[image:6.612.96.517.306.480.2]4.1. Electrode Wear Rate
Figure 2 shows the main effects of EWR of each factor for various level condition. According to figure 2, the EWR decreases with the two major parameters, P and B. And also we notice that minimum machining voltage (negative polarity), maximum peak current, minimum pulse duration and maximum interval time may imply a smaller EWR. Thus, according to J.L. Lin, etc.[8], discharge current, workpiece polarity and discharge voltage are the important machining parameters affecting the electrode wear ratio. According to this figure, for initial value of pulse duration (1.6 μs) with negative polarity (electrode, -ve), EWR was smaller. Thus according to B.Thomas[9], in such a case the polarity is reversed (negative polarity) so that maximum material removal is on the workpiece and the electrode suffers the least possible amount of wear. For this reason, the electrode is given negative polarity for short pulse duration and positive polarity is used when the pulse duration is longer.
Figure 2: Main effects of each factor on EWR
38.0 36.0 34.0 32.0 30.0 28.0 26.0 24.0 22.0 20.0 18.0 16.0 14.0 12.0
-120 -160 -200 8 32 64 1.6 12.8 50 3.2 50 800
V P A B
Re
spons
e of
E
W
[image:6.612.73.519.349.695.2]R
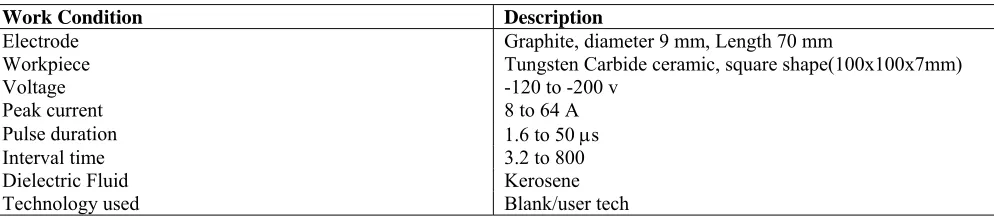
Figure 3: Main effects of each factor on MRR
3.2 3.0 2.8 2.6 2.4 2.2 2.0 1.8 1.6 1.4 1.2 1.0 0.8 0.6
-120 -160 -200 8 32 64 1.6 12.8 50 3.2 50 800
V P A B
R
es
pons
e of
M
R
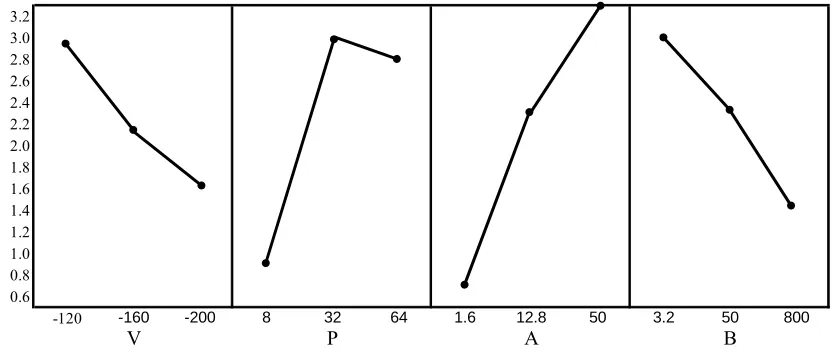
[image:6.612.100.517.527.703.2]Figure 4: Main effects of each factor on SR
4.6 4.4 4.2 4.0 3.8 3.6 3.4 3.2 3.0 2.8 2.6 2.4 2.2 2.0
-120 -160 -200 8 32 64 1.6 12.8 50 3.2 50 800
V P A B
R
esp
on
se
o
f SR
Table 9: Optimum Machining Condition based on results of EWR
Factors Level Description Level Contribution
V: Machining Voltage -160 V 2 -1.439
P: Peak Current 64 A 3 -7.793
A: Pulse Duration 1.6 µs 1 -3.426 B: Interval Time 800 µs 3 -6.815 Total contribution from all factors -19.472 Current grand average of preformance 22.038 Expected result at optimum condition 2.567
Table 10: Optimum Machining Condition based on results of MRR
Factors Level Description Level Contribution
V: Machining Voltage -120 V 1 0.679
P: Peak Current 32 A 2 0.749
A: Pulse Duration 50 µs 3 1.454
B: Interval Time 3.2 µs 1 0.819
[image:7.612.68.562.553.650.2]Total contribution from all factors 3.702 Current grand average of preformance 2.340 Expected result at optimum condition 6.043
Table 11: Optimum Machining Condition based on results of SR
Factors Level Description Level Contribution
V: Machining Voltage -120 V 1 -0.394
P: Peak Current 8 A 1 -0.776
A: Pulse Duration 12.8 µs 2 -0.175
B: Interval Time 50 µs 2 -0.554
Total contribution from all factors -1.899 Current grand average of preformance 3.312 Expected result at optimum condition 1.414
4.2. Material Removal Rate
A<5μs). According to this figure, MRR increases with short interval time (3.2 μs) and peak current. The possible reason for the higher MRR may be due to more frequency discharges per unit cycle time.
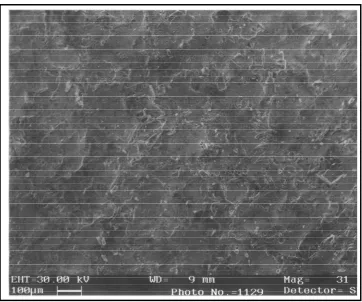
Figure 5: Influence of Peak current(8 A) on discharging crater
[image:8.612.119.481.438.740.2]4.3. Surface Roughness
Figure 4 evaluates the main effects of SR of each factor for various level condition. According to this figure the SR increases with voltage and slightly increases with peak current. Larger craters were produced by a larger power supply voltage, possibly producing a larger discharging energy. The influence of peak current with various setting is shown in figures 5 and 6. According to K.P.Rajurkar, etc.[10], The variation of crater diameter, depth and volume with respect to peak current is consistent with the general findings in EDM literature that higher currents generate larger crater and therefore produces rough surfaces.
5. Conclusion
This paper has discussed the feasibility of machining Tungsten Carbide ceramics by EDM with a graphite electrode. Taguchi method has been used to determine the main effects, significant factors and optimum machining condition to the performance of EDM. Based on the results presented herein, we can conclude that, the peak current of EDM mainly affects the EWR and SR. The pulse duration largely affects the MRR.
References
[1] J.A. McGeough, “Advanced Methods of Machining”, Chapman and Hall, New York, 1998. [2] B.H. Yan, C.C. Wang, W.D. Liu and F.Y. Huang, “Machining Characteristics of Al2O3/6061Al
Composite using Rotary EDM with a Disklike Electrode”, The International Journal of Advanced Manufacturing Technology, 16:322-333, 2000
[3] Ranjit K.Roy, “A Premier On The Taguchi Method”, Van Nostrand Reinhold, New York, 1996. [4] Ranjit K.Roy, ”Design of Experiments Using the Taguchi Approach”, John Wiley & Sons, New
York, 2001.
[5] Glen Stuart Peace, “Taguchi Methods”, Addison-Wesley Publishing, inc, 1993
[6] D.Scott, S. Boyina and K.P. Rajurkar, “Analysis and Optimization of ParameterCombination in Wire Electrical Discharge”, International Journal of Production Research, 29, pp. 2189-2207, 1991.
[7] J. Murdoch and J.A. Barnes, “Statistical Tables”, Macmillan, London, 1986.
[8] J.L. Lin, K.S. Wang, B.H. Yan and Y.S. Tang, “An Investigation into ImprovingWorn Electrode Reliability in the Electrical Discharge Machining Process”, The International Journal of Advanced Manufacturing Technology, 16:113-119, 2000
[9] B. Thomas, “The Technology of Electrical Discharge Machining”, Maho Hansen GmbH Co., 1991